
Market Overview
| Study Period | 2021 - 2031 |
|---|---|
| Forecast Data Period | 2026 - 2031 |
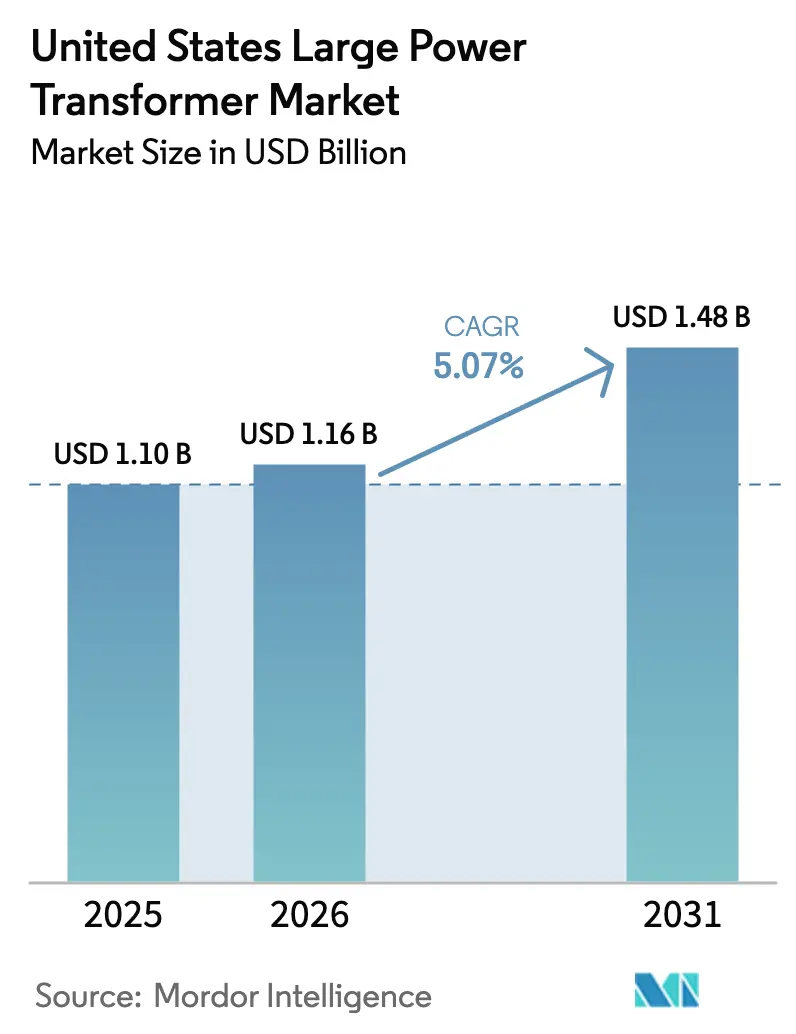
| Base Year Market Size (2025) | USD 1.10 Billion |
| Market Size (2026) | USD 1.16 Billion |
| Market Size (2031) | USD 1.48 Billion |
| Growth Rate (2026 - 2031) | 5.07 % |
| Market Concentration | Medium |
Major Players *Disclaimer: Major Players sorted in no particular order Image © Mordor Intelligence. Reuse requires attribution under CC BY 4.0. | |
United States Large Power Transformer Market Analysis by Mordor Intelligence
The United States Large Power Transformer Market size is expected to grow from USD 1.10 billion in 2025 to USD 1.16 billion in 2026 and is forecast to reach USD 1.48 billion by 2031 at 5.07% CAGR over 2026-2031.
Robust federal and state grid modernization funding, surging renewable interconnections, and a rapidly accelerating replacement cycle for aging equipment anchor near- to medium-term demand. An 80% import dependence highlights structural supply risk, while lead times have stretched to as long as 210 weeks, amplifying price pressure that has already lifted average unit costs by 60-70% since 2020.(1)Mary B. Powers, “Industry Pushes Congress for $1.2B to Fix US Transformer Shortage,” Engineering News-Record, enr.com Parallel capacity-expansion programs exceeding USD 1.8 billion aim to localize production, but ramp-up hurdles in skilled labor and grain-oriented electrical steel availability temper relief prospects. Utilities are responding by locking in multi-year transformer procurement agreements, evaluating ester-based insulating fluids for fire-safe urban substations, and embracing digital monitoring systems that meet evolving NERC cybersecurity mandates.
Key Report Takeaways
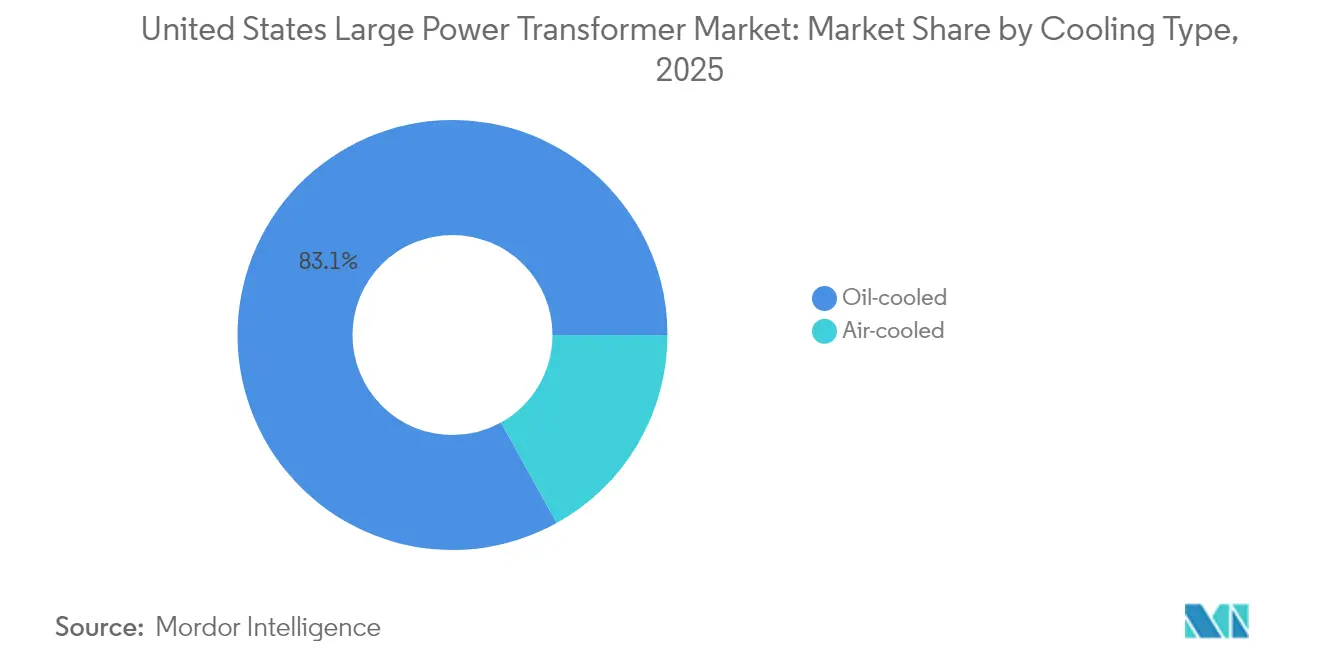
- By cooling type, oil-cooled units held 83.05% of the United States large power transformer market share in 2025, while air-cooled units are projected to expand at a 6.46% CAGR through 2031.
- By phase, three-phase designs led with an 87.02% revenue share in 2025, and the configuration is expected to post a 5.56% CAGR to 2031
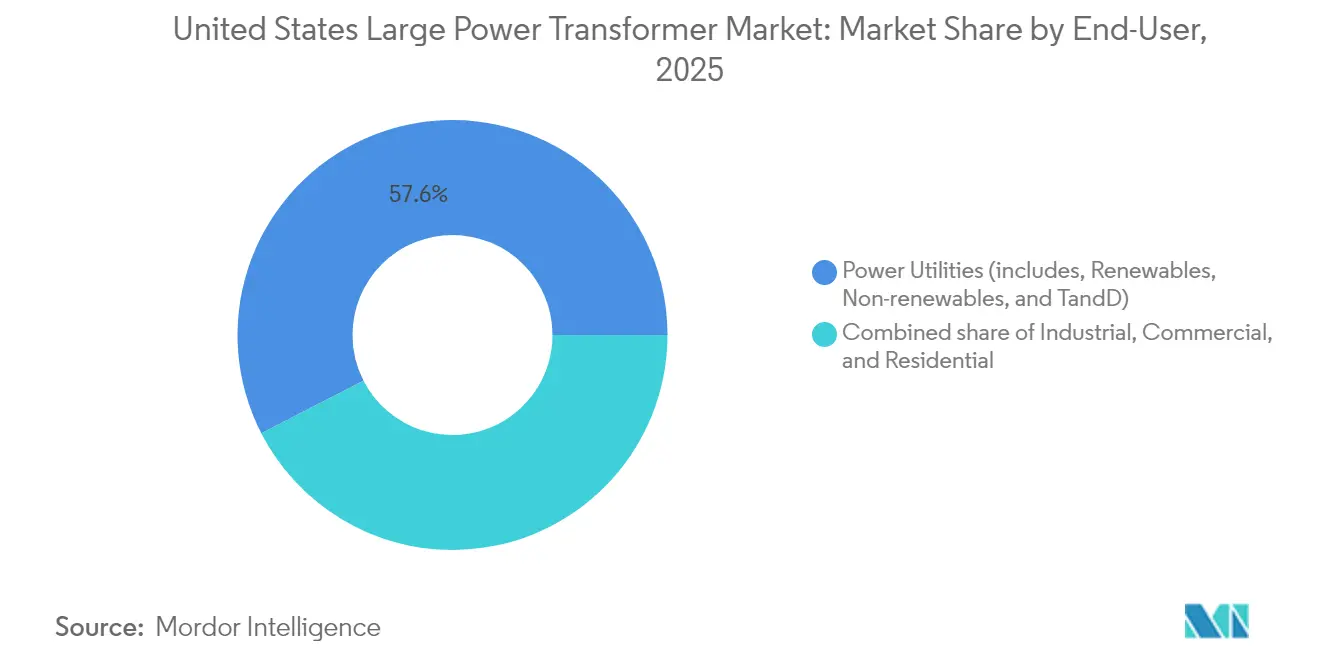
- By end-user, power utilities accounted for a 57.55% share of the United States' large power transformer market size in 2025, while industrial applications are advancing at a 6.05% CAGR through 2031
Note: Market size and forecast figures in this report are generated using Mordor Intelligence’s proprietary estimation framework, updated with the latest available data and insights as of 2026.
United States Large Power Transformer Market Trends and Insights
Drivers Impact Analysis*
| Driver | (%) Impact on CAGR Forecast | Geographic Relevance | Impact Timeline |
|---|---|---|---|
| Government grid-modernization funding surges | +1.8% | National, concentrated in Texas, California, Northeast | Medium term (2-4 years) |
| Utility-scale renewable build-outs escalating inter-tie demand | +1.5% | ERCOT, CAISO, PJM interconnections | Long term (≥ 4 years) |
| Aging U.S. transformer fleet replacement cycle accelerates | +1.2% | National, priority in Northeast, Midwest legacy grids | Medium term (2-4 years) |
| Hyperscale data-center clusters requiring high-MVA LPTs | +0.9% | Virginia, Texas, Ohio, Oregon data center corridors | Short term (≤ 2 years) |
| Rail-corridor electrification projects (freight & high-speed) | +0.7% | California, Northeast corridor, Texas freight routes | Long term (≥ 4 years) |
| Source: Mordor Intelligence | |||
Government Grid-Modernization Funding Surges
Federal programs such as GRIP's USD 10.5 billion allocation in 2024 and the Transmission Facilitation Program's USD 2.5 billion credit facility are compressing utility upgrade timelines.(2)U.S. Department of Energy, “Grid Resilience and Innovation Partnerships Program Fact Sheet,” energy.gov The Infrastructure Investment and Jobs Act injects an additional USD 65 billion, incentivizing advanced transformer purchases that meet newer DOE 10 CFR 431 efficiency thresholds. Texas ERCOT's USD 18 billion, six-year roadmap and California's USD 7.3 billion transmission strategy stack further funding atop federal dollars, magnifying procurement volume.(3)Bank of America Institute, “Power Check: Watt's Going On with the Grid?,” institute.bankofamerica.com Utilities now accelerate retirements for assets beyond 30 years of service, a cohort representing roughly 70% of installed U.S. capacity. Higher-efficiency cores and digital sensors lift upfront material costs but trim lifetime no-load losses, sharpening the total-cost-of-ownership argument. Collectively, these initiatives deepen order visibility for the United States' large power transformer market and put pressure on constrained domestic capacity.
Utility-Scale Renewable Build-Outs Escalating Inter-Tie Demand
The National Transmission Needs Study forecasts a 64% increase in line-carrying capacity by 2040, primarily to transport solar and wind power from resource-rich regions to major load centers. Projects in the Great Plains and Southwest require extra-high-voltage units and high-voltage DC converter transformers that can manage variable power flows. Offshore wind ventures, typified by forthcoming 1.25 GW Lake Michigan arrays, demand corrosion-resistant designs and integrated submarine-cable terminations. Grid architects specify dynamic ratings, on-load tap changers, and advanced cooling schemes to accommodate harmonic-heavy inverter output. Co-located battery storage compounds loading volatility, heightening the need for broader thermal margins. These technical shifts reinforce a premium subsegment within the United States' large power transformer market, favoring suppliers that offer application-specific engineering.
Aging U.S. Transformer Fleet Replacement Cycle Accelerates
Field studies indicate an average fleet age of 45 years and growing, surpassing design expectations and increasing failure risk during heatwaves or winter storms. Insulation degradation below a 400 DP index and mechanical relaxation from winding-clamp fatigue are primary retirement triggers. Lead times now span up to four years for bespoke units, driving utilities toward condition-based monitoring using dissolved-gas analysis and infrared imaging to stretch service life. The National Infrastructure Advisory Council urges the creation of a "strategic virtual reserve" to mitigate the consequences of outages—a plan that could institutionalize the standby procurement of critical ratings. Replacement urgency feeds directly into constant baseline demand, anchoring volume even during macroeconomic slowdowns. Consequently, the United States' large power transformer market maintains stable order pipelines despite cyclical swings elsewhere in the energy sector.
Hyperscale Data-Center Clusters Requiring High-MVA LPTs
AI-driven compute loads are pushing single-campus power needs beyond 500 MW, translating into multi-bank 200 MVA transformer stations at sites across Loudoun County, Dallas-Fort Worth, Columbus, and Portland. Operators strive for 99.99% availability, necessitating N+1 or even 2N redundancy, which effectively doubles the unit count per site. Short 18-month construction clocks force developers to secure transformer slots early, often paying deposits to lock factory windows and expedite logistics. Technical specifications emphasize harmonic mitigation, low-noise design, and ester-fluid fire protection, as many facilities are located near residential zones. Data-center clustering concentrates demand peaks geographically, further straining an already tight supply chain. As a result, the hyperscale segment emerges as a price-insensitive buyer within the United States' large power transformer market, attracting manufacturers willing to customize and fast-track production.
Restraints Impact Analysis*
| Restraint | (%) Impact on CAGR Forecast | Geographic Relevance | Impact Timeline |
|---|---|---|---|
| CRGO steel supply-chain constraints | -1.4% | National manufacturing, import dependency | Long term (≥ 4 years) |
| Domestic LPT manufacturing capacity limits | -1.1% | Regional capacity clusters: Southeast, Texas, Pennsylvania | Medium term (2-4 years) |
| Cyber-security certification delays for digital monitoring | -0.8% | National, critical infrastructure priority regions | Medium term (2-4 years) |
| Rising insurance & financing premiums post-failure events | -0.6% | National, concentrated in extreme weather zones | Short term (≤ 2 years) |
| Source: Mordor Intelligence | |||
CRGO Steel Supply-Chain Constraints
The United States houses a single producer of grain-oriented electrical steel, leaving 85% of demand filled by imports from South Korea, Japan, and Germany. Parallel EV motor demand has tightened coil allocations, pushing GOES prices to multi-decade highs and lengthening mill lead times to nine months or more. Alternative amorphous alloys deliver up to 30% lower core losses but cost roughly 1.5 times standard M3 steel and have only one domestic source, limiting near-term substitution. Industry groups are lobbying for Defense Production Act prioritization and direct federal incentives to underwrite the construction of new annealing furnaces, but any capacity build will require three years or more. In the interim, manufacturers ration sheet width to top clients, forcing smaller buyers to accept mixed grades that complicate loss-calculation guarantees. This material bottleneck constrains output, capping the upside for the United States' large power transformer market even as demand climbs.
Domestic LPT Manufacturing Capacity Limits
High-voltage coil winding requires precision machinery, vacuum oil-processing tanks, and high-current test bays—equipment that costs tens of millions of dollars per factory line. Announced investments from Siemens Energy, Hitachi Energy, Eaton, and Prolec GE exceed USD 1.8 billion, yet labor remains a gating factor as specialized technicians require multiyear apprenticeships. Freight bottlenecks add complexity: only a handful of heavy-haul railcars can accommodate 400-ton cargo, and permit lead times for interstate moves can reach 18 months. Quality-assurance regimes entail full-wave impulse tests and heat-run verifications that consume scarce test-bay hours, thereby throttling throughput even when mechanical capacity is available. These intertwined constraints hinder swift scaling, prolonging the structural supply-demand gap that underpins elevated prices and lead times in the United States' large power transformer market.
*Our forecasts treat driver/restraint impacts as directional, not additive. The impact forecasts reflect baseline growth, mix effects, and variable interactions.
Segment Analysis
By Cooling Type: Oil-Cooled Dominance Faces Fire-Safe Alternatives
Oil-cooled designs generated 83.05% of 2025 revenue, cementing their role as the default solution for bulk-power applications where thermal performance per MVA remains paramount and where compact footprints reduce substation real-estate costs. Their mature supply chain, wide performance envelope, and straightforward maintenance routines reinforce preference among utilities managing aging fleets. However, recent fires at densely populated urban substations fueled regulatory scrutiny, propelling air-cooled and ester-fluid units into pilot deployments. The latter's flash point of over 330 °C satisfies stringent NFPA urban fire codes, but its higher viscosity requires larger core-window dimensions, which in turn increase copper usage and cost.
Energy transition policies are expected to accelerate air-cooled orders by 6.46% per year through 2031, albeit from a relatively small base. Utilities balancing cost and risk are experimenting with hybrid cooling, integrating directed-oil channels alongside forced-air radiators to lower hot-spot temperature by 10 °C under cyclic loads. In the process, advanced computational fluid dynamics tools enable optimized fin spacing and radiator geometry, offsetting some of the efficiency penalties. Market entrants emphasizing modular radiator designs aim to shave eight weeks from fabrication schedules, a differentiator while lead-time anxiety persists. These developments collectively broaden supplier opportunities without displacing entrenched oil-cooled incumbents in the United States' large power transformer market.


By Phase: Three-Phase Systems Drive Grid Modernization
Three-phase units captured an 87.02% slice of 2025 revenue, reflecting their lower cost per delivered kVA and balanced-current benefits that cut overall line losses. Standardization on three-phase equipment also narrows spare-parts inventories and simplifies workforce training, appealing to utilities juggling large capital programs. Single-phase transformers continue to serve rail electrification and remote rural feeders, where phased construction defers capital outlay, yet their share remains marginal.
Emerging grid topologies nevertheless influence three-phase specifications. Renewable integration elevates the need for on-load tap-changer ranges of up to ±22.5 % to stabilize voltage against variable generation. Digital twin models allow operators to simulate harmonic penetration, guiding insulation coordination and bushing selection well before factory acceptance tests. Cybersecure sensors conforming to NERC CIP-013 feed utility-wide dashboards, enabling condition-based maintenance to transition from concept to practice. These capabilities embed high-margin software and service revenue into hardware bids, enriching the United States' large power transformer market beyond physical-goods sales.
By End-User: Power Utilities Lead While Industrial Demand Accelerates
Power utilities accounted for 57.55% of shipments in 2025, driven by DOE grants and state-level renewable mandates that require voltage-step-up and interconnection hardware at virtually every new solar, wind, or storage site. The segment’s forecast growth is based on a 64% transmission capacity expansion target through 2040, resulting in a steady queue of 230–765 kV units. Meanwhile, industrial users post the fastest 6.05% CAGR, prompted by semiconductor fabs, electric-vehicle battery plants, and green-hydrogen electrolyzers clustering across Texas, Ohio, and the Southeast. Hyperscale data centers augment this wave, often negotiating multi-year, multi-site master agreements with transformer manufacturers to lock delivery slots.
Industrial buyers are increasingly specifying high-impedance designs that limit fault currents in multi-converter environments, along with K-factor ratings accommodating high-frequency components from rectifier loads. In parallel, utilities rely on ester-based fluids to meet urban fire codes and achieve environmental milestones, gradually steering their supplier roadmaps. The spectrum of requirements broadens product outlines and challenges factories to balance batch sizes against customization depth, reinforcing the premium placed on agile production strategies within the large power transformer market in the United States.
Geography Analysis
Demand centers vary sharply by region. Texas heads the queue as ERCOT invests USD 18 billion through 2030 to integrate nearly 40 GW of wind and solar, triggering large-scale procurement of 345 kV and 500 kV autotransformers. California follows, where aggressive renewable portfolio standards and wildfire resilience programs necessitate high-efficiency, fire-safe units that comply with Title 24 efficiency rules. The Northeast has the nation’s oldest fleet, with 46% of its assets beyond their nominal life, resulting in a front-loaded replacement surge that stabilizes after 2028.
Manufacturing geography is shifting southward. New factories in Virginia, South Carolina, Tennessee, and North Carolina collectively add more than 15,000 MVA of annual capacity, reducing reliance on Gulf-Coast ports and heavy-haul rail from Midwest production hubs. These facilities shorten delivery routes to Southeast utilities and the fast-growing industrial corridors stretching from Georgia to Alabama. The Midwest’s Columbus corridor forms a second pole, where data center clusters and reshored steel and battery plants generate step-down transformer demand concentrated in fewer counties, yet measured in multi-gigawatt increments.
Regulatory regimes differ. California imposes the nation’s strictest energy-efficiency code, prompting utilities to adopt amorphous-core or high-grade GOES laminations, despite incurring price premiums. ERCOT emphasizes the use of inert-gas or ester-fluid insulation and advanced bushings to mitigate the risk of explosions in hot, drought-prone environments. Northeastern utilities prioritize corrosion-resistant tanks and smart monitoring to limit storm-outage durations. These nuances compel suppliers to maintain configuration variants and dedicated factory lines, thereby reinforcing regional-specific competition within the broader United States large power transformer market.
Regulatory Landscape
Large power transformers sit at the intersection of federal efficiency policy, grid-resilience programs, and critical-infrastructure security expectations. The US Department of Energy (DOE) regulates transformer energy conservation standards under the Energy Policy and Conservation Act, and in June 2026 DOE advanced work tied to its distribution-transformer standards, including a focused data-gathering effort on how the 2024 standards (with compliance required by 2029) intersect with national-security considerations and domestic manufacturing capacity constraints. DOE has also used the Distribution Transformer Working Group to coordinate supply-chain issues affecting utility procurement planning, including component and bottleneck constraints.
Policy attention to transformer and electrical steel supply chains intensified in April 2026, when a Presidential determination identified grid infrastructure supply chains, including distribution transformers and electrical core steel, as essential to national defense. For large power transformer buyers, that emphasis elevates supply assurance and domestic capacity expansion as compliance-adjacent priorities alongside established operational expectations such as NERC CIP cybersecurity for digital monitoring and communications on high-voltage assets. Taken together, procurement specifications increasingly tie efficiency, safety, and cyber requirements to delivery assurance, which raises the value of qualified domestic production footprints and secure supplier ecosystems.
Competitive Landscape
Market concentration is moderate: the top five global players command roughly 55% of U.S. revenue, while a long tail of regional specialists fills custom niches. Siemens Energy, Hitachi Energy, ABB, General Electric, and Prolec GE strive to secure local steel, scale domestic plants, and integrate digital diagnostics to defend their share. Hitachi Energy completed a USD 250 million expansion of its insulation components in 2025, sharpening its vertically integrated cost position. Siemens Energy followed with a USD 150 million commitment to the U.S. build-out of 750 kV-rated cores, specifically targeting upcoming high-voltage DC corridors.
Technology differentiation centers on cyber-secure monitoring suites, flexible 70–150 kV impedance-tunable designs for dynamic grid balancing, and ester-fluid product lines that reduce fire-risk insurance premiums by up to 40%. Smaller entrants, such as Virginia Transformer and Delta Star, exploit proximity advantages, offering five-month quicker deliveries on ratings below 200 MVA. Korean and Turkish suppliers remain pivotal stop-gaps, serving nearly 30% of annual imports under tailored delivery guarantees, but face mounting scrutiny as policy stakeholders emphasize supply-chain resilience.
Workforce scarcity presents the wild card. An aging technician base collides with soaring production targets, prompting consortiums of OEMs and community colleges to create 24-month apprenticeship tracks in coil winding, vacuum drying, and dielectric testing. Firms that automate core stacking and implement AI-guided winding tension controls are reducing per-unit labor costs by 15%, thereby cushioning wage inflation. These operational pivots may reset competitive hierarchies if demand outpaces legacy capacity for an extended period, an increasingly plausible outcome given the trajectory of the United States' large power transformer market.
United States Large Power Transformer Industry Leaders
Siemens Energy AG
General Electric Company
Mitsubishi Electric Corporation
ABB Ltd.
Hitachi Energy Ltd.
- *Disclaimer: Major Players sorted in no particular order


Market Opportunities and Future Outlook
Domestic manufacturing build-outs are creating near-term room across factory throughput, test-bay capacity, and qualification pathways that support large power transformer delivery commitments. The evidence anchors are the recent ramp plans of major OEMs, including Hitachi Energy breaking ground in June 2026 on a USD 457 million large power transformer facility expansion in South Boston, Virginia (positioned as the largest US facility of its kind), and Siemens Energy outlining a USD 1 billion US manufacturing investment program that includes added transformer manufacturing and service capacity. These expansions broaden opportunities for localized sourcing of critical inputs (components, insulation systems, bushings, tap changers) and for third-party services that reduce delivery risk, including heavy-haul logistics coordination, field installation, and accelerated commissioning support.
Utilities and large-load developers are also paying for specification upgrades that expand the value pool beyond the unit itself. Demand concentration from hyperscale data centers, where campuses are moving into multi-bank, high-MVA substations, along with grid-hardening programs, is driving adoption of condition monitoring and cyber-secure connectivity, as well as fire-safety design choices such as ester-based fluids for urban and constrained sites. With lead times for bespoke units stretching to as long as 210 weeks and the United States relying heavily on imports, OEMs and qualified service partners have room to differentiate through multi-year framework agreements, standardized platforms that reduce engineering cycles, and retrofit or life-extension packages that bridge replacement queues while new domestic capacity ramps.
Recent Industry Developments
- June 2026: Hitachi Energy broke ground on a 457 million expansion of its South Boston, Virginia manufacturing campus to produce large power transformers. The expansion strengthens domestic production capacity for large power transformers and supports grid modernization. The project advances U.S. supply resilience and scales transformer production for higher demand.
- February 2026: GE Vernova completed the acquisition of the remaining 50% stake in its Prolec GE joint venture with Xignux for 5.275 billion. The acquisition broadens electrification grid capabilities in the United States. Full JV integration enhances access to U.S.-based transformer design and manufacturing capabilities.
- August 2025: Siemens Energy expanded Charlotte transformer production facility to increase U.S. manufacturing capacity. The expansion provides a boost to the U.S. large power transformer supply. It improves domestic production footprint and reduces import dependence.


Research Methodology Framework and Report Scope
Market Definition and Coverage
This market covers the value of large power transformers supplied for use in the United States electricity network, including equipment sold for transmission and high voltage substation applications, along with associated replacement demand.
Scope exclusions: We exclude distribution transformers, routine spare parts sold separately, and service-only revenues (maintenance, testing, repairs) when they are not bundled with a transformer sale.
Segmentation Overview
- By Cooling Type
- Air-cooled
- Oil-cooled
- By Phase
- Single-Phase
- Three-Phase
- By End-User
- Power Utilities (includes, Renewables, Non-renewables, and T&D)
- Industrial
- Commercial
- Residential
Data Sources, Market Sizing, and Validation
Desk Research
Desk work starts with public system-level indicators that explain how many large units are likely to be ordered and installed each year. We lean on sources such as the US Energy Information Administration for transmission and generation trends, the Federal Energy Regulatory Commission for filings tied to grid buildouts, and the North American Electric Reliability Corporation for reliability driven replacements.
To keep the model grounded in actual activity, we also review US International Trade Commission and Census trade statistics for transformer imports and exports, along with customs documentation patterns. Other helpful checks come from utility integrated resource plans, ISO and RTO planning documents, and investor presentations that mention substation and transmission capex timing. For specific company context, we use paid subscriptions that consolidate company financials, news and filings, and global contracts and tenders where procurement language can be read consistently. The desk sources listed are illustrative, and many other public and paid references were used for cross-checking, clarification, and validation.
Primary Interviews and Surveys
Primary work is used to pressure test the desk assumptions, especially around replacement timing, lead times, and how utilities translate transmission plans into transformer orders. We speak with a mix of OEM and supply chain contacts, EPC and logistics participants, and utility and industrial buyers across the United States so the final inputs reflect how projects are actually sequenced and priced.
Distribution of primary research fieldwork respondents
| Company type | Respondent position |
|---|---|
| Top tier: 38% | CXOs: 14% |
| Mid tier: 48% | Functional/Unit leaders: 27% |
| Smaller Players: 14% | Managers: 59% |
Market-Sizing & Forecasting
Sizing begins with a top-down rebuild of the annual demand pool tied to US transmission additions and major substation upgrade programs, which is then translated into expected large transformer order volumes and value. To avoid over-relying on any single series, the model is subsequently checked using selective bottom-up approximations, such as sampled project award values, typical unit pricing ranges, and channel conversations on backlog conversion.
Key inputs include transmission line miles and substation investment trends, the cadence of grid hardening and replacement programs, renewable and storage interconnection activity that triggers new high voltage equipment, typical MVA class mix used in new builds, and lead-time driven delivery slippage that shifts revenue recognition. Pricing is treated carefully, since steel and copper movements and logistics constraints can lift delivered transformer prices without a similar jump in unit counts. Forecasts are built using scenario analysis supported by interview feedback on procurement timing, supplier capacity outlook, and utility capital plan confidence. When shipment or order visibility is incomplete, gaps are filled using ranges anchored to public capex disclosures and then tightened through repeat interview rounds until the implied totals stay consistent with observed trade and project signals.
Data Validation & Update Cycle
Validation is handled through several simple checks that can be repeated by another analyst. Model outputs are compared against independent signals like utility capex cycles, major project announcements, and import and export movement patterns, and then outliers are reviewed so unusual spikes are not carried forward without a clear reason.
Before sign-off, assumptions and calculations are reviewed in steps, starting with internal peer checks and followed by targeted re-contacts when a key variable shifts or when interview inputs disagree with public indicators. Reports are refreshed annually, and interim updates are made when material events occur, such as policy shifts, large tender releases, or sudden changes in lead times. Right before delivery, a final review pass is completed so the numbers reflect the most recent information available.
Mordor Intelligence's United States Large Power Transformer Market Size Measured Against Other Published Estimates
Published market values for this space can look far apart because different authors count different equipment types, use different capacity cutoffs, and sometimes mix product sales with services. Timing also matters since transformer deliveries can slip across quarters, which changes what is recognized in a given year.
In our checks, the biggest gap drivers tend to be whether the estimate is closer to shipment revenue versus booking value, whether it includes distribution or medium power transformers in the same pool, and how pricing is escalated when metal costs and freight rates change. A fast refresh cadence and project-level validation help keep assumptions aligned with what utilities are actually ordering, which is why the table below shows a tighter range once those factors are controlled.
Benchmark comparison
| Source | Market Size | Gaps in Research Methodology |
|---|---|---|
| Mordor Intelligence | USD 1.10 B (2025) | |
| Industry Publisher A | USD 3.50 B (2024) | This figure is published without a clearly stated capacity threshold and appears to include a broader set of transformer categories and buyer groups, which can lift totals versus counting only large power transformer equipment revenues in the year. |
| Specialist Research Bulletin B | USD 2.10 B (2025) | The number is described as domestic sales for 30 MVA and up, which can differ from an equipment revenue model when import content, delivery timing, and any non-large unit overlap are treated differently. |
The spread mainly comes from how the market boundary is drawn (capacity cutoffs and whether adjacent transformer classes are included) and from timing differences between orders, shipments, and recognized sales. By tying the sizing to US-only equipment revenues and validating pricing and delivery slippage through repeated checks, the total stays traceable to a consistent demand pool, a discipline applied by Mordor Intelligence.


Key Questions Answered in the Report
How large is the United States large power transformer market in 2026?
The United States large power transformer market size is USD 1.16 billion in 2026 and is tracking toward USD 1.48 billion by 2031 on its 5.07% CAGR trajectory.
What is the main growth driver for transformer demand through 2031?
Federal and state grid-modernization outlays, particularly GRIP and ERCOT programs, are the single largest growth catalyst, adding roughly 1.8 percentage points to forecast CAGR.
Why are lead times so long for new transformers?
Limited domestic manufacturing capacity, grain-oriented steel shortages, and scarce heavy-haul logistics stretch delivery schedules up to 210 weeks for high-MVA units.
Which transformer cooling method is gaining traction in urban areas?
Air-cooled and ester-fluid units are gaining share because their high flash points and lower fire risk align with stricter urban safety codes.
How does hyperscale data-center growth influence transformer specs?
Data-center transformers must manage non-linear loads, low noise targets, and redundancy requirements, often involving 200 MVA ratings with harmonic filtering features.
What steps are being taken to ease GOES shortages?
Investments such as Cleveland-Cliffs USD 150 million core plant conversion and policy discussions about Defense Production Act prioritization aim to expand domestic steel supply.
Page last updated on:


 Your data is secure and never sold or shared.


