
Market Overview
| Study Period | 2020 - 2031 |
|---|---|
| Forecast Data Period | 2026 - 2031 |
| Base Year Market Size (2025) | USD 26.90 Billion |
| Market Size (2026) | USD 28.24 Billion |
| Market Size (2031) | USD 35.99 Billion |
| Growth Rate (2026 - 2031) | 4.97 % |
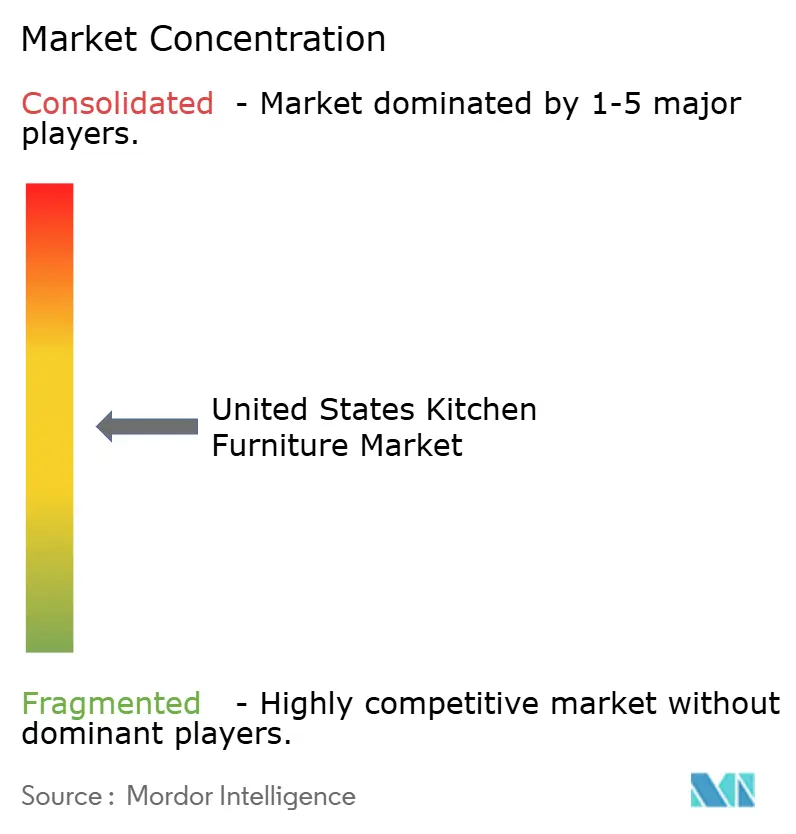
| Market Concentration | Medium |
Major Players *Disclaimer: Major Players sorted in no particular order Image © Mordor Intelligence. Reuse requires attribution under CC BY 4.0. | |
United States Kitchen Furniture Market Analysis by Mordor Intelligence
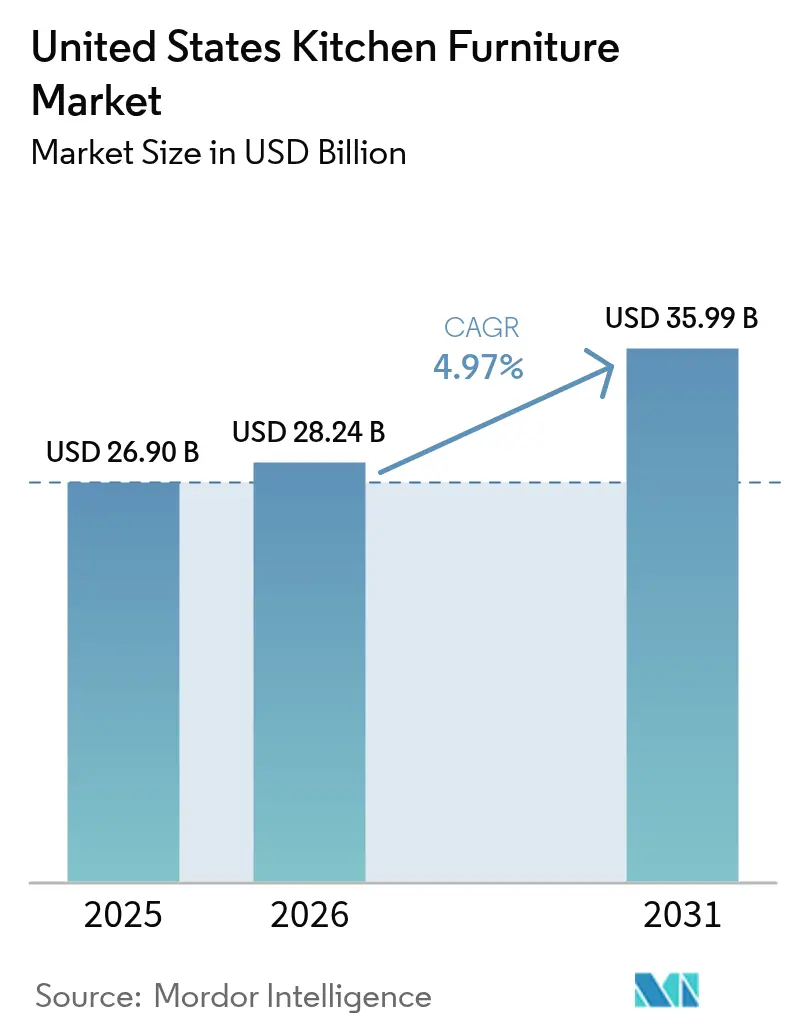
The United States kitchen furniture market size was valued at USD 26.90 billion in 2025 and estimated to grow from USD 28.24 billion in 2026 to reach USD 35.99 billion by 2031, at a CAGR of 4.97% during the forecast period (2026-2031). Consumers are increasingly viewing kitchens not just as places to cook, but as multifunctional hubs for socializing and remote work, driving this growth trajectory. Aging housing stock, digital transformation, skilled-labor scarcity, and rising appetite for premium solutions are rewriting design priorities, channel strategies, and pricing dynamics. A robust replacement cycle tied to older housing, persistent labor shortages, and fast-rising demand for ready-to-assemble (RTA) formats is reinforcing growth. The competitive landscape features MasterBrand Cabinets leading through strategic acquisitions and operational efficiencies, while American Woodmark pivots toward automation. Cabinetry remains the focal point of most projects, and frameless European construction, outdoor-rated solutions, and digital planning tools are reshaping product design and routes to market. While volatile lumber prices and installation bottlenecks weigh on margins, mid-range products continue to resonate with value-seeking homeowners, and premium lines are outpacing the overall United States kitchen furniture market as affluent households invest in bespoke, tech-integrated spaces. Together, these trends drive investment in lean production, omnichannel engagement, and selective consolidation as manufacturers seek scale advantages in purchasing, manufacturing, and distribution.
Key Report Takeaways
- By product category, kitchen cabinets led with 59.42% of the United States kitchen furniture market share in 2025, while pantry shelving and storage recorded the highest forecast CAGR at 5.72% through 2031.
- By material, wood accounted for 60.88% of the United States kitchen furniture market size in 2025; stainless-steel components are forecast to expand the fastest at a 6.02% CAGR to 2031.
- By price range, the mid-range segment commanded 54.35% of the United States kitchen furniture market size in 2025; the premium tier is set to grow 4.82% annually to 2031.
- By end user, residential demand held 79.30% of the United States kitchen furniture market share in 2025, while commercial installations are advancing at a 4.92% CAGR.
- By geography, the South captured 34.65% share of the United States kitchen furniture market in 2025; the West is the fastest-growing region at a 5.64% CAGR to 2031.
Note: Market size and forecast figures in this report are generated using Mordor Intelligence’s proprietary estimation framework, updated with the latest available data and insights as of 2026.
United States Kitchen Furniture Market Trends and Insights
Drivers Impact Analysis*
| Driver | (~) % Impact on CAGR Forecast | Geographic Relevance | Impact Timeline |
|---|---|---|---|
| Aging housing stock drives remodeling cycles | +1.2% | Northeast & Midwest | Medium term (2-4 years) |
| Online RTA cabinet sales accelerate DIY adoption | +1.0% | Urban centers nationwide | Short term (≤ 2 years) |
| Luxury outdoor kitchens lift demand for weather-resistant materials | +0.8% | Sunbelt states | Medium term (2-4 years) |
| Frameless European-style cabinets gain favor | +0.7% | Coastal metros & suburbs | Medium term (2-4 years) |
| Multifunctional, space-saving furniture preferences grow | +0.6% | Major cities with smaller dwellings | Short term (≤ 2 years) |
| Source: Mordor Intelligence | |||
Aging Housing Stock Driving Remodeling Cycles
The pressing need to modernize aging kitchens in America's older homes is witnessing robust demand for kitchen furniture. Harvard University's Joint Center for Housing Studies, "Improving America's Housing 2025" report, on 42,500 housing units, highlighted that homes constructed before 2000 account for 65% of the U.S. housing stock [1]. Similarly, according to the 2025 Cost vs. Value Report by Hanley Wood, kitchen renovations stand out as the most lucrative interior remodelling endeavour. Homeowners can recoup up to 72% of their renovation costs upon resale. This trend not only underscores a stable market but also highlights a resilience to economic fluctuations; as kitchen components age, their need for replacement remains constant, independent of the housing market's broader health.
Online RTA Cabinet Sales Accelerating DIY Adoption
The ready-to-assemble (RTA) cabinet segment is rapidly growing, outpacing the broader kitchen furniture market. Millennials, the largest homebuying demographic, are driving this trend by favoring cost-effective, direct-to-consumer models. Augmented reality tools offered by online retailers have enhanced the shopping experience, according to the Webstaurant Store's "Restaurant Industry Statistics: Revenue, Labor & More" report (2024), 90% of consumers research kitchen products online before purchasing. The report includes a Q3 2024 National Restaurant Association survey of 4,200 U.S. adults, showing 90% researched online before buying, rising to 94.3% among millennials (ages 28-43).
VividWorks' April 29, 2025 report, "eCommerce Trends in the Furniture Market for 2025," highlights that 3D product configurators increased conversion rates by 27% and reduced returns by 35%. Data from 42 North American furniture retailers (2023-2025) showed AR tool users spent 18 minutes longer on websites and had a 41% higher average order value.
Outdoor Kitchens Boost Weather-Resistant Materials
The kitchen furniture market is evolving as outdoor cooking spaces transition from basic grilling stations to fully equipped kitchens, creating a high-margin category. Traditional indoor cabinet manufacturers must adapt to specialized material demands or lose market share to outdoor-focused specialists. Weather-resistant cabinets for outdoor kitchens command 30-40% price premiums over indoor units. This trend, prominent in sunbelt states, is expanding northward as homeowners prioritize outdoor entertainment. A March 2025 Architectural Digest report highlights the growing demand for outdoor kitchens that combine indoor functionality with weather-resistant materials.
Frameless European-Style Cabinets Reshape Manufacturing
The kitchen furniture sector is shifting as frameless cabinet construction, requiring different machinery and techniques than traditional face-frame methods, gains traction. Urban markets and new constructions drive demand for frameless cabinets, aligning with modern design preferences. Frameless cabinets offer 10-15% more storage than framed options. Manufacturers investing in European-style production gain competitive advantages, while traditional American cabinet makers risk losing market share. Frameless cabinets are growing twice as fast as framed cabinets due to consumer demand for cleaner aesthetics and more storage. Facilities optimized for edge-banding and panel processing benefit from this trend.
Restraints Impact Analysis*
| Restraint | (~) % Impact on CAGR Forecast | Geographic Relevance | Impact Timeline |
|---|---|---|---|
| Volatile lumber & panel prices squeeze margins | -0.8% | Nationwide; heavier in Southeast & Pacific Northwest | Short term (≤ 2 years) |
| Skilled labor shortage extends custom lead times | -0.7% | High-growth South & Southwest | Medium term (2-4 years) |
| Elevated mortgage rates curb new single-family starts | -0.6% | Regions with stretched affordability | Short term (≤ 2 years) |
| Source: Mordor Intelligence | |||
Volatile Lumber Prices Compress Margins
The volatility of lumber prices is likely to hinder market growth. Hardwood lumber costs rose 23.5% year-over-year despite minor recent retreats, complicating pricing models [2]. Furniture manufacturers consistently grapple with the challenge of raw material costs, forcing dynamic surcharges and design shifts toward thinner panels or engineered substrates. Vertically integrated manufacturers that own sawmills buffer price swings better than peers reliant on spot markets, preserving share in the United States kitchen furniture market.
Acute Skilled Labor Shortage in Finish Carpentry Extending Lead-Times
Angi's 2024 State of Home Spending Report, which surveyed 6,500 homeowners, revealed that 54% faced challenges in hiring finish carpenters. The struggle was most pronounced in the West, where 62% reported difficulties, followed closely by the South at 58%. Among those renovating kitchens, 67% encountered project delays of 4 to 6 weeks. This pushed average installation lead times to 6 to 8 weeks and resulted in cost increases of 15 to 20%. National Association of Home Builders data show 85% of Southeast and 82% of Southwest builders tag labor shortages as their chief concern, underscoring regional concentration. Manufacturers are responding: 43% have rolled out low-complexity product lines, and 29% have formed installer training programs, according to the Q3 2024 Kitchen & Bath Market Index [3].
*Our forecasts treat driver/restraint impacts as directional, not additive. The impact forecasts reflect baseline growth, mix effects, and variable interactions.
Segment Analysis
By Product: Cabinets, Anchor Spending as Pantry Solutions Surge
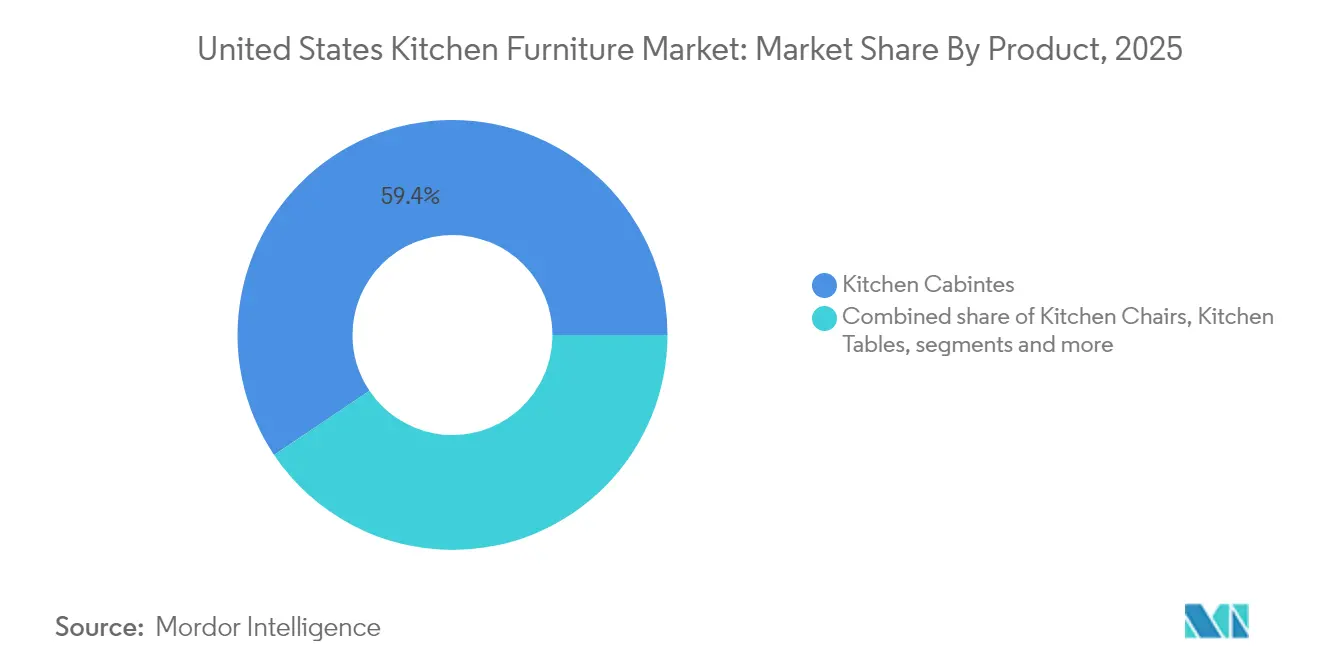
Cabinets commanded 59.42% of 2025 revenue, reflecting their centrality in layout planning. Frameless formats, hidden hardware, and LED-lit interiors differentiate offerings in the United States kitchen furniture market. Other products (pantry shelves), the fastest-growing sub-segment at 5.72% CAGR, capitalize on bulk-buying habits and the desire for decluttered countertops.
Expanded storage modules—pull-out racks, swing-out corner units, and vertical dividers—command a premium dollar per square foot. Manufacturers meet varied footprints with modular columns and clip-on baskets, accelerating shipments and easing installation pressures.

By Material: Wood Dominates, Metal Gains Ground
Wood held a 60.88% position in the United States kitchen furniture market size for 2025, buoyed by consumer affinity for oak, walnut, and maple in light to medium stains. Certification seals boost trust, and textured veneers satisfy interest in biophilic design.
Metal, led by stainless steel, is projected to grow 6.02% annually through 2031. Weather resistance and commercial aesthetics drive adoption indoors and outside. Hybrid designs—wood fronts with steel drawer boxes—blend warmth with robustness, cushioning the transition rather than displacing wood outright.
By Price Range: Mid-Range Leads, Premium Accelerates
The mid-range tier retained 54.35% of 2025 spend, leveraging scale to package soft-close glides and custom interior kits at approachable price points. Manufacturers employ lean tooling and shared platforms to hold margins despite raw-material volatility.
Premium collections will climb 4.82% a year to 2031, buoyed by households allocating USD 180,000 or more to major remodels. Exotic veneers, integrated lighting, and app-based lift doors define this tier, anchoring profitability for suppliers who can support bespoke configurations.
By End User: Residential Prevails, Commercial Advances
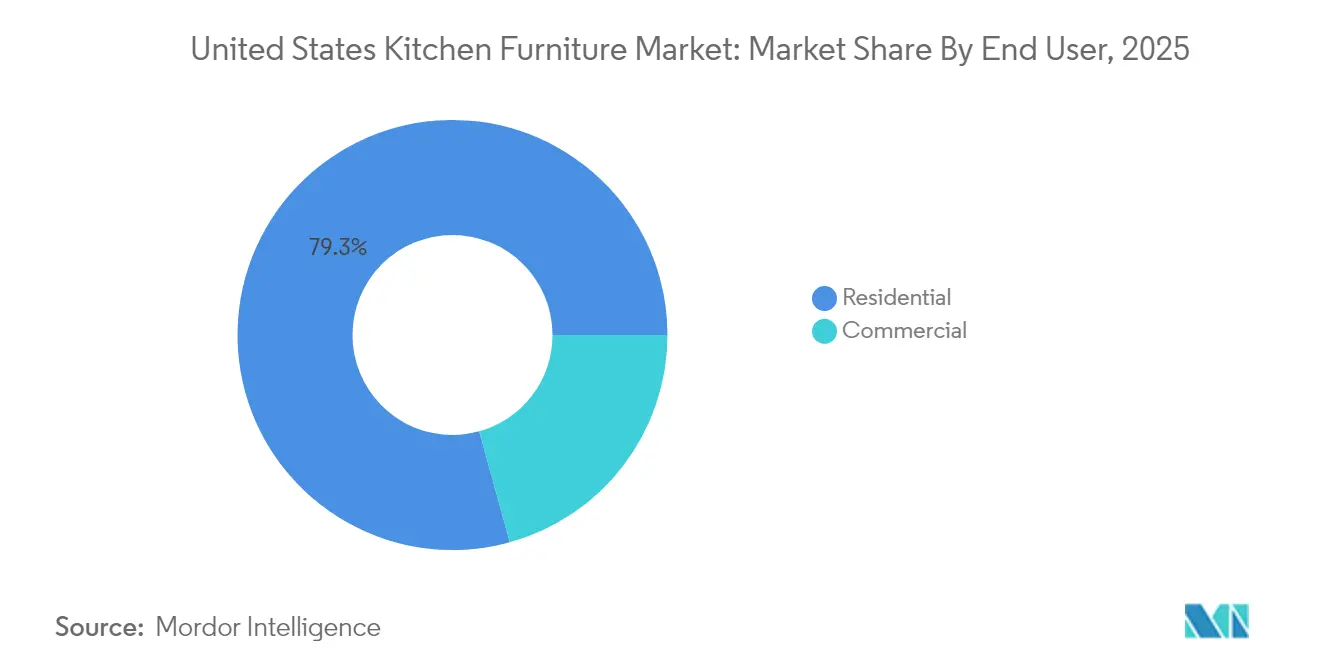
Residential projects represented 79.30% of 2025 turnover, sustained by single-family remodels and multi-family developments. Upgrades now blend storage, entertainment, and assistive features for aging family members, broadening the bill-of-materials scope.
Commercial kitchens, although 20.70% of demand, are set for a 4.92% CAGR as restaurants favor open-prep theatrics and hotels refresh back-of-house for efficiency. NSF-rated surfaces and heavy-duty hinges distinguish these products within the United States kitchen furniture market.
By Distribution Channel: Retail Dominates, Online Accelerates
Retail outlets captured 87.30% of 2025 sales. Big-box chains bundle financing, appliances, and install services, while boutique showrooms curate premium lines. Online sales inside retail are expanding at 6.58% CAGR, fueled by AR viewers and AI-driven personalization. Parcel-friendly RTA packs and omnichannel pick-up options align perfectly with digital journeys that start on mobile devices.
Geography Analysis
The South anchors the United States kitchen furniture market with 34.65% of 2025 revenue, propelled by migration inflows, lower land prices, and a construction pipeline. Installation costs run 12-15% below national averages, letting homeowners upgrade their finishes without straining their budgets. Outdoor living culture drives stainless steel cabinet demand, and transitional aesthetics blend shaker profiles with modern hardware. Supply tightness in skilled labor remains pronounced, so manufacturers pre-assemble modules or partner with production builders to secure volume quickly.
The West is the fastest-growing territory, projected at 5.64% CAGR through 2031. The January 2024 Houzz Kitchen Trends Study, which surveyed 3,437 U.S. homeowners, found that Western homeowners spend 22% more on renovations and lead in sustainable selections, with over 90% including at least one eco-feature in new kitchens. Frameless cabinets, minimalist pulls, and integrated smart appliances dominate in tech-savvy metros such as San Francisco, Seattle, and Denver. Retail foot traffic eased 4% in 2024, but digital research more than compensates, reinforcing omnichannel dynamics in the region. Elevated labor and material costs challenge timelines, yet the culture of design experimentation and home investment sustains premium demand.
Northeast and Midwest patterns diverge yet complement the United States kitchen furniture market growth. Space-efficient inserts and vertical dividers record 35% higher uptake than in other regions, reflecting urban density. The Midwest is stable and value-oriented, with homeowners more likely to emphasize durability over fashion. Functional triggers, such as failing doors or hardware malfunctions, rather than aesthetic updates, dominate project starts. Angi's 2024 State of Home Spending Report, conducted from September 15 to October 20, 2024, surveyed 6,500 homeowners nationwide, shedding light on their renovation priorities and spending habits. Both regions see rising interest in multi-use islands that serve meal prep and remote work, as 38% of Northeastern and 32% of Midwestern respondents cited work-from-home needs in planning decisions.
Value Chain Analysis
The value chain starts with raw materials and components, including hardwood and engineered wood panels, veneers, finishes and adhesives, drawer slides and hinges, and stainless components for indoor-outdoor applications. Panel and composite inputs also connect to emissions-compliance requirements for formaldehyde, shaping resin choices, supplier qualification, and testing and documentation practices across cabinet boxes, shelving, and other kitchen furniture elements.
Manufacturing runs from high-volume RTA lines to semi-custom and custom cabinetry, followed by finishing, kitting and packaging, and outbound distribution. Scale players such as MasterBrand operate multi-brand portfolios and apply procurement leverage, footprint alignment, and lean production to manage input volatility, while channels bring products through home centers, specialty dealers and showrooms, kitchen-and-bath designers, and direct-to-consumer online. Installation and project management, often the critical path due to skilled-labor scarcity, sit downstream alongside after-sales service, and industry bodies such as the Kitchen Cabinet Manufacturers Association (KCMA) and the National Kitchen and Bath Association (NKBA) influence specification preferences and product adoption through standards and professional community engagement.
Competitive Landscape
Competitive intensity in the United States kitchen furniture market remains moderate, with scale leaders leveraging multi-brand portfolios and smaller specialists carving niches. MasterBrand Cabinets, Inc., among the top suppliers, employs lean production and a multi-tier brand strategy to serve the economy through luxury. Its 2025 purchase of Supreme Cabinetry Brands widens reach in premium dealers and adds coastal-influenced design credence.
American Woodmark Corporation prioritizes automation and ERP upgrades after a 10.6% net-sales drop in fiscal 2024, aiming to lift EBITDA by streamlining order-to-delivery processes. The Home Depot’s 2025 acquisition of SRS Distribution broadens building-product logistics, strengthening sourcing clout for private-label kitchen lines and installation accessories.
Innovation also flows from component vendors. Outdoor specialist Brown Jordan Outdoor Kitchens captures affluent buyers with color-matched powder-coated stainless modules engineered for salt-air climates. Digital-native RTA brands exploit SEO, quick-ship logistics, and user-generated content to win millennial loyalty. Across the field, success hinges on supply-chain resilience, omnichannel reach, and the ability to integrate visualization software that reduces buyer uncertainty.
United States Kitchen Furniture Industry Leaders
-
MasterBrand Cabinets, Inc.
-
Cabinetworks Group
-
American Woodmark Corporation
-
IKEA
-
Wellborn Cabinet, Inc.
- *Disclaimer: Major Players sorted in no particular order
Market Opportunities and Future Outlook
Repair-and-remodel demand creates room for suppliers that can reduce friction in planning and fulfillment, especially in categories that simplify installation such as modular storage, pantry systems, and RTA formats, plus premium, high-margin upgrades including weather-resistant stainless or outdoor-rated cabinetry. NKBA industry outlook data for 2026 points to a split, with repair and remodeling spending expanding while new construction-related spending contracts. That pattern supports opportunities for manufacturers and retailers that build remodel-centric assortments, fast-ship programs, and dealer and designer enablement.
Smart kitchens and integrated features also remain a product-led opportunity, where cabinetry, storage, and kitchen furniture are sold together rather than as separate SKUs. As online research continues to shape purchase journeys, retailers and brands can monetize visualization, configuration, and measurement workflows to shorten decision cycles and limit return risk, particularly for RTA and modular components sold through omnichannel paths. Consolidation is another ongoing theme in competitive behavior, with large cabinetry platforms expanding portfolios and distribution leverage, which in turn pushes smaller brands toward clearer specialization in materials, customization, and service responsiveness.
Recent Industry Developments
- May 2026: MasterBrand, Inc. and American Woodmark Corporation complete a merger in May 2026, establishing a consolidated residential cabinetry portfolio in North America. The expanded footprint strengthens market alignment with home remodeling channels.
- May 2026: Cabinetworks Group closes a private notes exchange representing approximately 99 percent of notes and completes refinancing. The move improves liquidity and balance sheet flexibility to pursue growth and supply chain resilience.
- May 2026: MasterBrand, Inc. completes the all stock merger with American Woodmark Corporation on May 28, 2026, establishing a consolidated residential cabinetry portfolio in North America. The integration broadens product breadth and distribution across key channels.
Research Methodology Framework and Report Scope
Market Definition and Coverage
For this report, we size the United States kitchen furniture market as the value of kitchen-specific furniture sold for residential and commercial kitchens, including cabinets and kitchen tables, chairs, carts, and pantry or shelving storage units. Values are captured in current US dollars across the study period.
Scope exclusions: Excluded from this market are built-in kitchen appliances, countertops, sinks, faucets, and outdoor kitchen-only setups.
Segmentation Overview
- By Product
- Kitchen Cabinets
- Kitchen Chairs
- Kitchen Tables
- Other Products (kitchen trolley, cart, pantry shelves, etc.)
- By Material
- Wood
- Metal
- Plastic and Polymer
- Other Materials
- By Price Range
- Economy
- Mid-Range
- Premium
- By End User
- Residential
- Commercial
- By Distribution Channel
- B2C/Retail
- Home Centers
- Specialty Furniture Stores
- Online
- Other Distribution Channels
- B2B /Project
- B2C/Retail
- By Geography
- Northeast
- Midwest
- South
- West
Data Sources, Market Sizing, and Validation
Desk Research
Desk research started with mapping what is sold as kitchen furniture in the US, and then linking it to measurable indicators like housing turnover and remodeling activity. Public sources were used to ground assumptions on construction cycles, renovation spend, and pricing signals, before we moved to interviews.
We referenced sources such as the US Census Bureau (housing starts, permits, and new home sales), the Bureau of Labor Statistics (inflation series relevant to furniture), and the Bureau of Economic Analysis (personal consumption and macro context). For remodeling demand and contractor signals, inputs were also checked using industry association publications such as those from NAHB and JLC, along with customs and trade statistics where helpful for imported furniture flows. We also reviewed company filings, investor presentations, and reputable business press coverage, and we used approved paid subscriptions for company financials and news screening, plus selective patent checks tied to materials and finishes. The desk sources listed above are illustrative only, and many other sources were reviewed for data collection, validation, and clarification.
Primary Interviews and Surveys
Primary work was used to pressure test the desk-built view of demand, pricing, and channel mix, especially for cabinets versus other kitchen furniture items. We spoke with a mix of manufacturers, distributors, retailers, installers, and commercial buyers so that assumptions on replacement cycles, promotional pricing, and lead times could be confirmed, and then adjusted where needed. We also used respondent input to refine how quickly projects move from inquiry to order for kitchen cabinets and storage units in the US market.
Distribution of primary research fieldwork respondents
| Company type | Respondent position |
|---|---|
| Top tier: 34% | CXOs: 21% |
| Mid tier: 44% | Functional/Unit leaders: 36% |
| Smaller Players: 22% | Managers: 43% |
Market-Sizing & Forecasting
Sizing was built using a top-down demand reconstruction, where residential kitchen activity and commercial fit-out signals are translated into furniture demand and then valued using observed price movement. To keep the numbers practical, results were corroborated with selective bottom-up checks like sampled supplier revenue roll ups, channel checks across retail and contractor routes, and volume times average selling price spot checks for key furniture lines.
Key inputs used in the model included housing starts and permits, existing home sales (as a remodeling trigger), remodeling spend direction, furniture-related inflation and raw material pass-through, and shifts in distribution channels such as online share for ready-to-assemble items. Where the market mix changes, we reflected it through different price ladders for stock, semi-custom, and custom-oriented kitchen furniture. We also factored lead time and availability signals shared in interviews for cabinets and storage units.
For forecasting, scenario analysis was applied around housing and remodeling cycles, and then the base case was tuned using primary feedback on expected order books, discounting intensity, and material cost outlook. When a direct bottom-up number was not available for a niche product, we bridged the gap using share-of-wallet and penetration assumptions that were validated through interviews and then rechecked against broader furniture spend patterns.
Data Validation & Update Cycle
Outputs were validated through triangulation across demand indicators, price movement, and channel feedback so that one noisy input does not drive the total. We check for year-to-year jumps that do not align with housing and remodeling signals, and we revisit assumptions when the model produces an unusual mix shift across cabinets, seating, and storage furniture.
Before sign-off, the work goes through multi-step analyst review, and follow-up calls are triggered when interview feedback conflicts with desk indicators or when pricing and volume trends move in opposite directions. Reports are refreshed annually, with interim updates when a material event affects construction activity, remodeling budgets, or input costs. A final pre-delivery pass is then completed so clients receive the latest view.
Mordor Intelligence's United States Kitchen Furniture Market Estimate Compared With Other Published Estimates
Published market values for US kitchen furniture do not always match because the inclusion list varies, the pricing basis differs (factory price versus retail value), and the refresh timing can be weeks or months apart. Differences also come from whether estimates lean on housing construction only or also reflect remodel-led replacement demand.
Countertops and sinks often get bundled into kitchen-related totals, but those items sit outside Mordor Intelligence's scope here, which keeps the figure tied to kitchen furniture revenue rather than broader kitchen build packages. The spread is also shaped by how each source treats custom cabinetry markups, e-commerce discounting, and the year used for currency and inflation adjustments, which can move reported values even when unit demand is similar.
Benchmark comparison
| Source | Market Size | Gaps in Research Methodology |
|---|---|---|
| Mordor Intelligence | USD 28.24 B (2026) | |
| Trade Journal A | USD 20.60 B (2022) | Uses factory price framing and earlier-year conditions, and it is commonly centered on kitchen furniture production value rather than full channel value capture, which can understate installed-market spending in later years. |
| Industry Publisher B | USD 29.65 B (2026) | Often applies a broader kitchen furniture basket and a more aggressive price progression into the forecast window, with lighter linkage to remodeling triggers and fewer disclosed checks against housing turnover and channel-level discounting. |
The table shows that most of the gap comes from what gets counted as kitchen-related value and the pricing level used to value cabinets and other furniture items. By keeping inclusions consistent, tying totals to housing and remodeling signals, and then rechecking assumptions through interviews, the final number stays traceable to clear drivers and can be repeated when new data is released.
Key Questions Answered in the Report
What is the current United States kitchen furniture market size?
The United States kitchen furniture market size is USD 28.24 billion in 2026 and is set to reach USD 35.99 billion by 2031.
Which region leads the United States kitchen furniture market?
The South holds the largest share at 34.65% in 2025, supported by strong population growth, lower installation costs, and a flourishing outdoor-kitchen culture.
What product category dominates spending?
Kitchen cabinets account for 59.42% of expenditure, underscoring their critical role in both layout and aesthetics.
How fast are online sales growing?
Online purchases within the retail channel are expanding at a 6.58% CAGR to 2031, the fastest pace among all distribution modes.