Market Overview
| Study Period | 2021 - 2031 |
|---|---|
| Forecast Data Period | 2026 - 2031 |
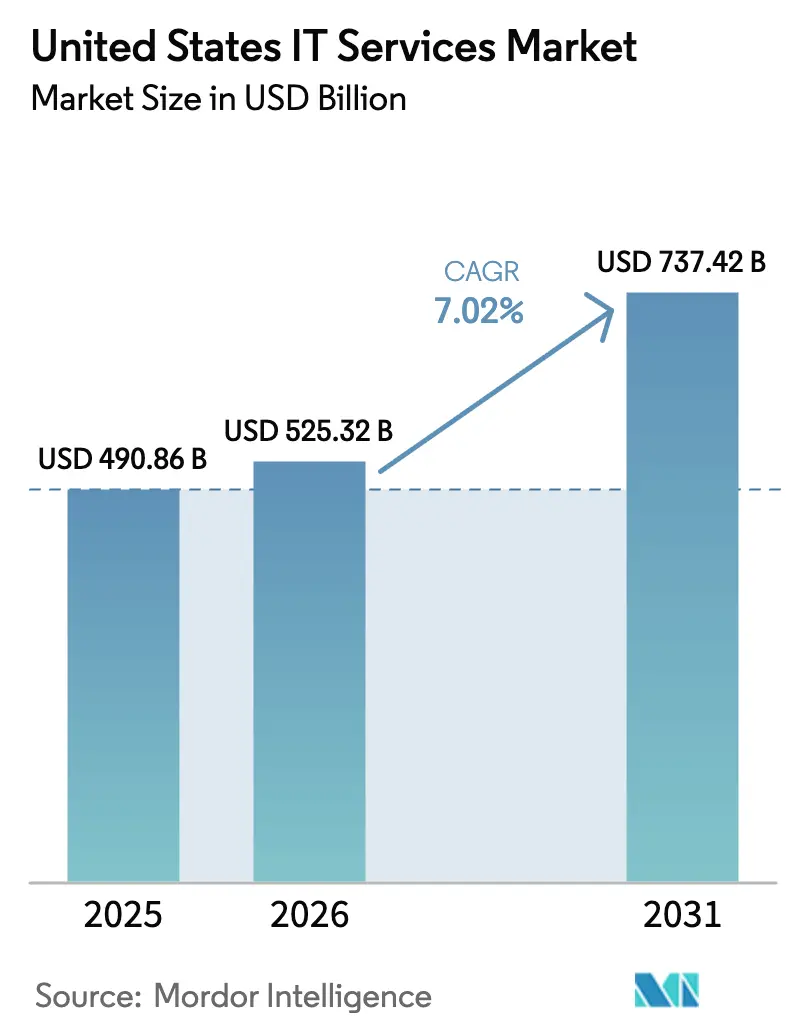
| Base Year Market Size (2025) | USD 490.86 Billion |
| Market Size (2026) | USD 525.32 Billion |
| Market Size (2031) | USD 737.42 Billion |
| Growth Rate (2026 - 2031) | 7.02% CAGR |
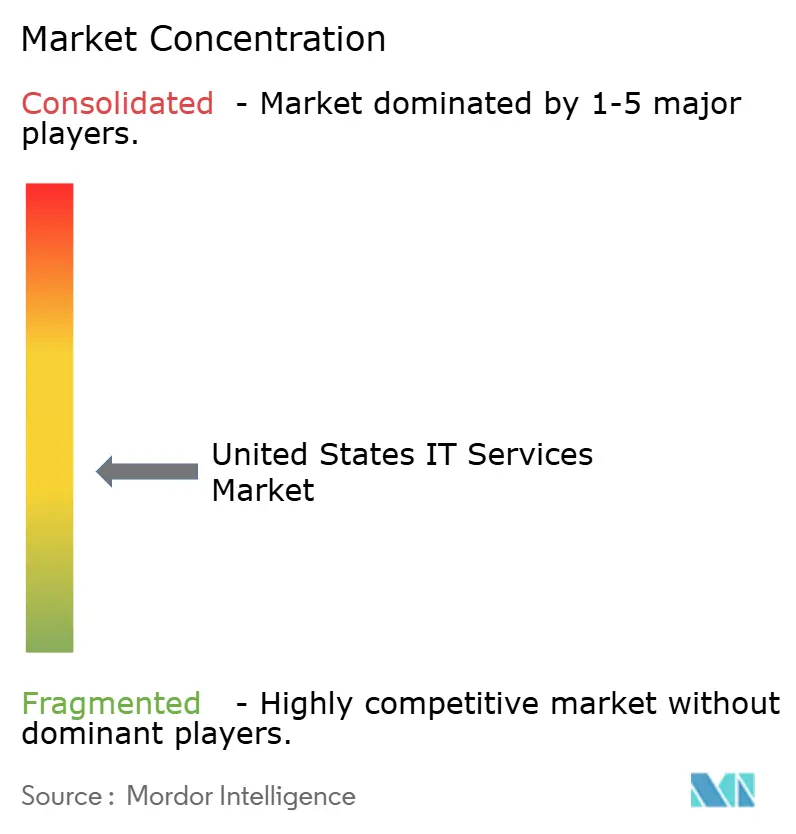
| Market Concentration | Medium |
Major Players *Disclaimer: Major Players sorted in no particular order Image © Mordor Intelligence. Reuse requires attribution under CC BY 4.0. | |
United States IT Services Market Analysis by Mordor Intelligence
The United States IT Services market size was valued at USD 490.86 billion in 2025 and is estimated to grow from USD 525.32 billion in 2026 to reach USD 737.42 billion by 2031, at a CAGR of 7.02% during the forecast period (2026-2031). The growth outlook reflects a decisive pivot from labor-arbitrage contracts to outcome-linked engagements, a shift driven by federal zero-trust mandates, generative-AI pilots, and healthcare interoperability deadlines. Enterprises now prize integration depth and measurable business impact over simple cost take-outs, reshaping vendor selection criteria toward FedRAMP-authorized cloud platforms, identity-fabric expertise, and edge-compute orchestration capabilities. Spending momentum is amplified by the Technology Modernization Fund’s 42% lift in fiscal-2026 appropriations, Fortune 1000 experimentation with large-language-model toolchains, and a nationwide 5G-plus-edge rollout that demands low-latency integration skills. Competitive dynamics remain fluid as outcome-based pricing transfers delivery risk to service providers, while offshore wage inflation and California privacy compliance squeeze margins.
Key Report Takeaways
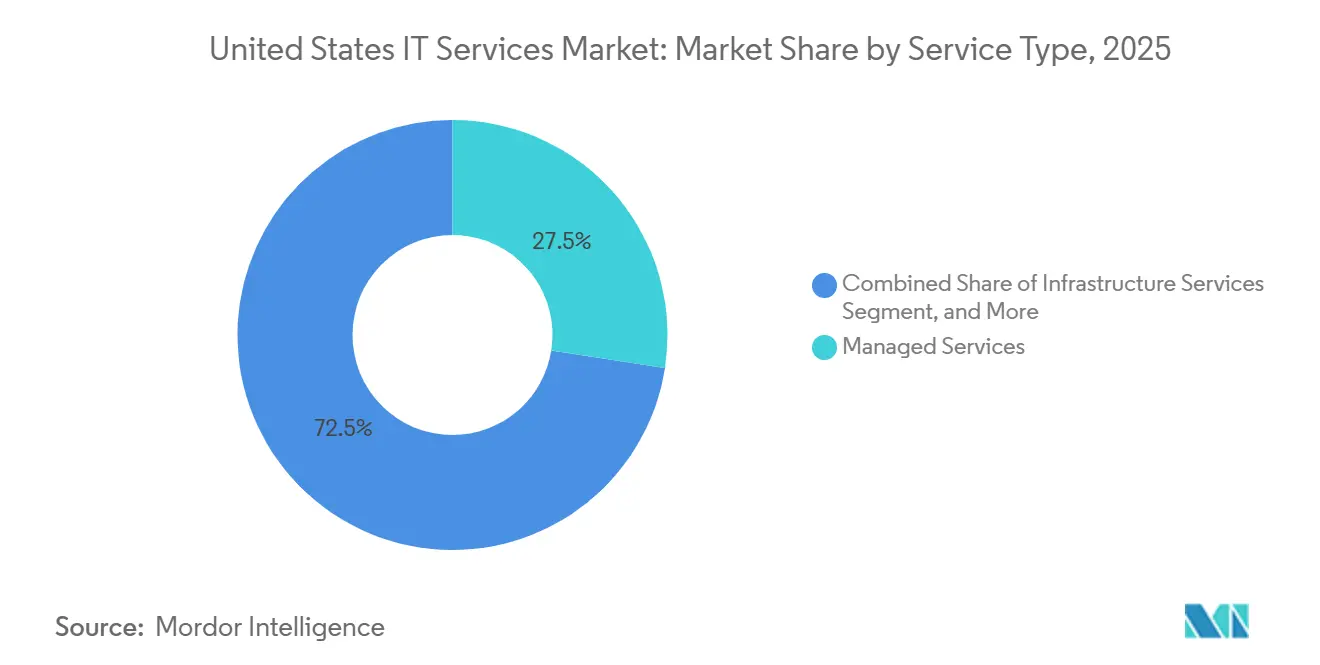
- By service type, Managed Services led with 27.46% share in 2025, whereas Cybersecurity Services is forecast to expand at an 8.42% CAGR through 2031.
- By deployment model, Onshore Delivery retained 54.63% share in 2025, while Nearshore Delivery is projected to post an 8.87% CAGR over 2026-2031.
- By engagement model, Managed Services and outcome-based contracts commanded 41.21% share in 2025 and are expected to accelerate at a 12.96% CAGR to 2031.
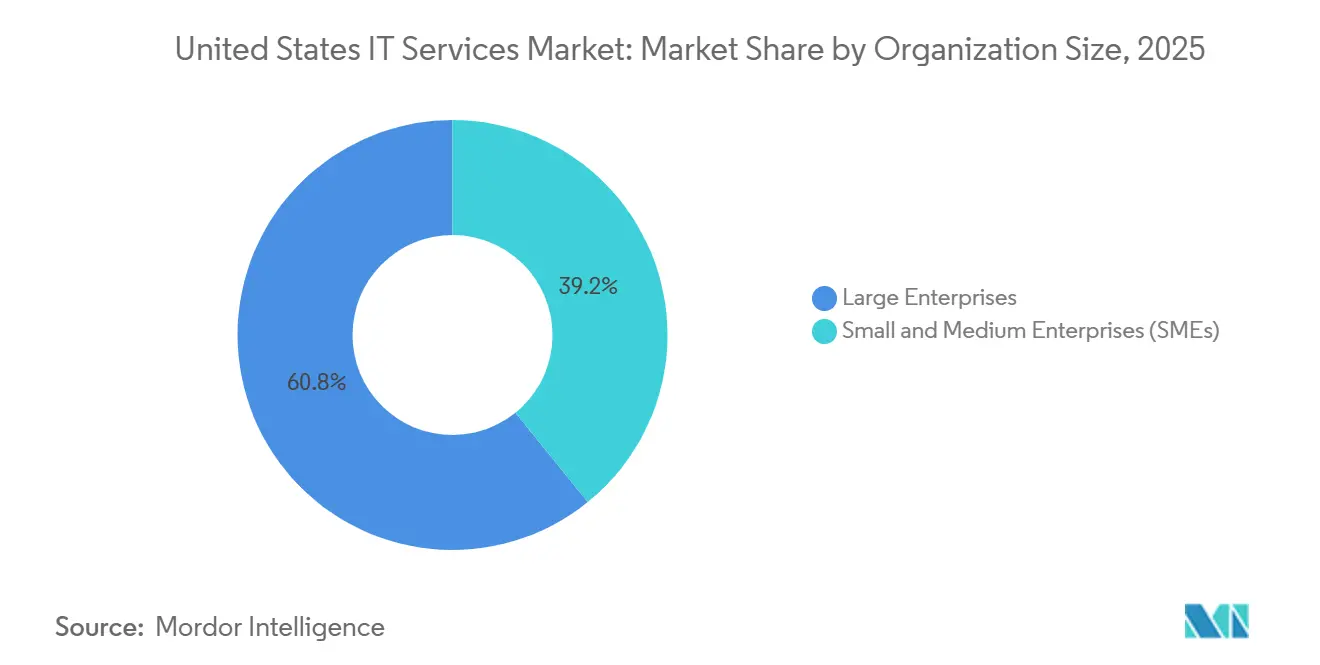
- By organization size, Large Enterprises accounted for 60.84% of 2025 spend, yet Small and Medium Enterprises are poised to grow at an 8.63% CAGR through 2031.
- By end-user industry, Banking, Financial Services and Insurance captured 18.78% share in 2025, whereas Healthcare and Life Sciences is projected to expand at a 9.02% CAGR during 2026-2031.
Note: Market size and forecast figures in this report are generated using Mordor Intelligence’s proprietary estimation framework, updated with the latest available data and insights as of 2026.
United States IT Services Market Trends and Insights
Drivers Impact Analysis*
| Driver | (~) % Impact on CAGR Forecast | Geographic Relevance | Impact Timeline |
|---|---|---|---|
| Federal Incentives Accelerating Cloud Migration in United States Public Sector | +1.2% | National, concentrated in Washington DC metro, Northern Virginia | Medium term (2-4 years) |
| Large-Scale Adoption of Generative AI among Fortune 1000 | +1.5% | National, with early concentration in technology hubs, San Francisco Bay Area, Seattle, New York | Short term (≤ 2 years) |
| 5G and Edge Roll-out Driving Network Integration Demand | +0.9% | National, with manufacturing belt (Midwest) and logistics corridors showing accelerated adoption | Medium term (2-4 years) |
| Zero-Trust Cybersecurity Mandates Boosting Security Services | +1.3% | National, federal agencies and defense contractors in DC, Virginia, Maryland leading | Short term (≤ 2 years) |
| Healthcare Interoperability Rules Fueling EHR Integration Services | +0.8% | National, concentrated in major health systems across Northeast, California, Texas | Medium term (2-4 years) |
| PE-Backed ERP Modernization Wave in Mid-Market Firms | +0.7% | National, with concentration in industrial Midwest and Southeast manufacturing clusters | Long term (≥ 4 years) |
| Source: Mordor Intelligence | |||


Federal Incentives Accelerating Cloud Migration in United States Public Sector
Federal agencies drew USD 1.05 billion from the Technology Modernization Fund in 2026, a steep rise that channels capital toward legacy-system retirement and FedRAMP cloud deployments, lifting demand for tier-1 integrators that can re-platform mainframe workloads at scale. Agencies have already migrated 67% of eligible systems, but the remaining estate involves data-sovereignty wrappers and custom middleware, widening the execution moat for vendors with cleared talent. The USD 9 billion Joint Warfighting Cloud Capability contract imposes a 35% small-business subcontracting quota, fragmenting delivery and raising program-management complexity. State and local governments, racing to obligate Infrastructure Investment and Jobs Act grants before 2027 expiry, compressed sourcing cycles in 2025, advantaging suppliers with catalog-based solutions. An acute talent deficit23,000 unfilled cyber and cloud positionshas pushed cleared hourly rates above USD 185 in the National Capital Region, inflating project budgets.
Large-Scale Adoption of Generative AI among Fortune 1000
Production deployments of generative-AI use cases climbed from 412 to 1,847 between January 2025 and January 2026, yet nearly two-thirds serve internal productivity workflows, not revenue generation. Data-quality shortcomings remain the chief barrier; 71% of chief data officers confess to lacking unified customer-master records, inflating preprocessing costs. Financial-services leaders are monetizing first, as illustrated by JPMorgan Chase’s contract-intelligence assistant that trims 360,000 review hours a year. Regulatory clouds persist, with the Federal Trade Commission probing 18 AI-driven pricing algorithms in 2025, stalling consumer-sector rollouts.[1]Federal Trade Commission, “AI Pricing Algorithm Investigations,” ftc.gov Integration specialists now package retrieval-augmented generation pipelines, bias detection, and audit trails, earning premium fees as they translate experimental pilots into compliant, scalable solutions.
5G and Edge Roll-out Driving Network Integration Demand
United States carriers lit up 2,100 5G standalone cores in 2025, enabling network slicing that guarantees bandwidth for industrial IoT, yet fewer than 9% of factories have knit edge nodes into production systems. Automakers already show what is possible; BMW’s Spartanburg plant processes 2.3 terabytes of sensor data daily, detecting paint defects within 140 milliseconds. Amazon’s 487 edge sites shave 63% off image-processing costs versus cloud inference, proof that latency gains drive tangible savings. Kubernetes adoption on the edge jumped 89% in 2025, but the skill gap forces enterprises to outsource cluster lifecycle management. Telecom-IT convergence is accelerating, typified by AT&T and Accenture’s network-as-code platform, which shrinks slice provisioning time from weeks to hours.
Zero-Trust Cybersecurity Mandates Boosting Security Services
The Cybersecurity and Infrastructure Security Agency’s March 2025 update introduced a five-stage maturity model, compelling quarterly progress reporting and sustained demand for assessments, architectures, and rollouts. Identity and access management leads the charge; federal customers pushed MFA coverage on privileged accounts from 54% to 91% in 12 months, yet micro-segmentation remains below 40% maturity. Private-sector players follow suit, with 68% of Fortune 500 adopting zero-trust roadmaps, a move rewarded by 18% cyber-insurance premium cuts. Although average ransomware demands fell to USD 1.4 million in 2025, attackers pivoted to data-exfiltration extortion, exposing gaps in data loss prevention. Service providers now bundle managed detection and response with risk-quantification dashboards that translate technical posture into financial exposure.
Restraints Impact Analysis*
| Restraint | (~) % Impact on CAGR Forecast | Geographic Relevance | Impact Timeline |
|---|---|---|---|
| Scarcity of Senior Cloud and Security Talent | -0.6% | National, acute in technology hubs, San Francisco, Seattle, New York, Austin | Short term (≤ 2 years) |
| Margin Pressure from Outcome-Based Pricing Models | -0.5% | National, affecting all major service providers | Medium term (2-4 years) |
| Compliance Complexity under CCPA and CPRA Litigation | -0.3% | California-based enterprises with national operations | Medium term (2-4 years) |
| Offshore Wage Inflation Eroding Cost Advantages | -0.4% | Global delivery centers in India, Philippines, Eastern Europe impacting United States clients | Long term (≥ 4 years) |
| Source: Mordor Intelligence | |||
Scarcity of Senior Cloud and Security Talent
United States employers faced 377,500 open information-security roles in 2025, a 22% uptick that pushed median cloud-architect salaries to USD 168,000. Demand for elite certifications far outstrips supply; only 47,000 professionals hold AWS Solutions Architect-Professional credentials, yet job postings climbed to 112,000.[2] Amazon Web Services, “Certification Statistics,” aws.amazon.com Zero-trust deployments require identity-fabric specialists who draw 28% wage premiums, intensifying churn. Vendors ramped apprenticeship programsCognizant alone enrolled 8,200 graduates in a 16-week bootcampbut 34% quit within 18 months as hyperscalers poached trained talent. Offshore arbitrage is narrowing, senior Java engineers in Bengaluru now draw USD 52,000, eroding the cost delta that once underpinned traditional support models.
Margin Pressure from Outcome-Based Pricing Models
Outcome-linked contracts represented 29% of 2025 signings, but 41% missed initial milestones, triggering penalties that trimmed vendor margins. Accenture disclosed that fixed-price projects delivered operating margins 340 basis points below time-and-materials work, despite making up 38% of revenue. Private-equity sponsors poured USD 1.2 trillion into deals requiring go-live guarantees, shifting execution risk to service partners. Senior architects capable of navigating ambiguous scopes command 40-60% salary premiums, raising blended delivery costs. Vendors are piloting modular fee structures with upside-sharing clauses, yet many mid-tier firms lack the contract-lifecycle systems needed to monitor granular business outcomes in real time.
*Our forecasts treat driver/restraint impacts as directional, not additive. The impact forecasts reflect baseline growth, mix effects, and variable interactions.
Segment Analysis
By Service Type: Managed Models Dominate Outcome-Driven Spend
Managed Services secured 27.46% of 2025 revenue, reflecting enterprise appetite for predictable operating expenses, while Cybersecurity Services is expected to deliver an 8.42% CAGR through 2031. The United States IT Services market share is consolidating around providers that layer breach warranties often capped at USD 5 million to managed detection and response offerings, aligning economic incentives with risk reduction. Application Development and Maintenance still drives the largest absolute spend, although growth slackens as low-code platforms let business users spin up departmental apps, trimming demand for bespoke Java and.NET builds. Cloud and Platform Services expanded 11.3% in 2025 as the average enterprise juggled 4.7 cloud platforms, intensifying demand for FinOps governance and multi-cloud orchestration. Infrastructure Services face commoditization, compelling vendors to bundle advisory, migration, and managed-ops layers. IT Outsourcing and Business Process Outsourcing increasingly converge, illustrated by Genpact’s 2025 acquisition of an RPA vendor that now stitches invoice-to-cash automation across IT and finance workstreams. Digital-transformation consulting remains in high demand, yet 57% of emerging-tech pilots stall at proof-of-concept, underscoring data-governance gaps.
Tailwinds extend as clients pursue outcome guarantees. Managed-security providers now price access to specialized SOC analysts and proprietary AI-driven threat-intel feeds within multiyear subscriptions, converting capital spend into OPEX. Conversely, legacy infrastructure deals replicate cloud’s pay-as-you-grow model, tying vendor remuneration to workload migration velocity and post-move cost savings. Application modernization is shifting from waterfall to agile pods that integrate DevSecOps from day zero, further tightening feedback loops between business stakeholders and delivery teams. The United States IT Services market continues to reward vendors that meld vertical-domain expertise with automation platforms that shrink test cycles and cut technical debt.


By Deployment Model: Nearshore Capacity Erodes Onshore Dominance
Onshore Delivery retained 54.63% share in 2025, anchored in regulated industries that prize co-location for compliance and collaboration, yet Nearshore Delivery is forecast to expand at an 8.87% CAGR. Mexico’s exports hit USD 9.2 billion, aided by USMCA protections and 41% labor discounts, prompting 187 United States enterprises to establish captive centers in Monterrey and Guadalajara. Canada’s cultural fit and robust IP laws lure financial-services clients, with Toronto engineers charging 22% less than Bay Area peers. The United States IT Services market size linked to nearshore centers is widening as clients compress sprint cycles by exploiting the same-time-zone overlap.
Offshore Delivery remains large but margin headwinds rise as Indian and Philippine wages climb and attrition nears 20%. Manila and Cebu pitch cybersecurity centers staffed by 23,000 SOC analysts, yet geopolitical tension nudges risk-averse clients toward the Americas. Eastern Europe wins compliance-sensitive work under GDPR, but 8.2% 2025 wage inflation and regional instability moderate its cost appeal. Providers now hedge delivery by architecting globally distributed agile pods, blending onshore product owners, nearshore scrum masters, and offshore developers to balance cost, speed, and talent depth.
By Engagement Model: Outcome-Based Structures Drive Risk-Reward Realignment
Outcome-linked Managed Services captured 41.21% share in 2025 and are projected to grow 12.96% annually through 2031. Private-equity sponsors make outcome clauses table stakes, compelling integrators to underwrite ERP go-live dates and commit to measurable cost reductions. Infosys’s USD 340 million SAP S/4HANA deal, with 30% fees contingent on order-to-cash improvements, typifies the model. Net Promoter Scores hover 47 for outcome deals versus 31 for T&M contracts, signaling higher client satisfaction and stickier relationships.
Traditional project-based and fixed-price work persists where scope is predictable, such as data-center consolidations, but staff-augmentation demand migrates toward niche expertise including quantum-computing and blockchain. Hybrid contracts emerge, coupling base fees with upside-sharing triggers, yet only vendors equipped with real-time KPI dashboards can reconcile delivery progress against business outcomes. The United States IT Services market continues to innovate contract frameworks that reward value creation rather than labor volume.
By Organization Size: SMEs Accelerate Cloud-First Modernization
Large Enterprises commanded 60.84% of spend in 2025, as Fortune 500 firms juggled 847 applications on average, many on legacy stacks. Yet SMEs are projected to expand at an 8.63% CAGR, buoyed by cloud-native SaaS models that erase hefty upfront licenses. Community banks under USD 10 billion in assets migrated to cloud cores, slashing maintenance that once ate 22% of IT budgets. Managed-service providers court this cohort with USD 150-per-user bundles covering cybersecurity, backup, and help desk, aligning with operating-expense constraints.
Meanwhile, large organizations bankroll multimillion-dollar compliance projects, such as pharmaceutical validation services and zero-trust programs, sustaining demand for tier-1 integrators. The bifurcation yields a two-tier ecosystem, hyperscale vendors chase USD 50-million plus engagements, while regional specialists package templated solutions for cost-conscious SMEs. The United States IT Services market share held by SME-oriented providers is set to rise as subscription pricing democratizes access to sophisticated digital capabilities.
By End-User Industry: Interoperability Spurs Healthcare Upside
Banking, Financial Services, and Insurance held an 18.78% share in 2025, underpinned by AML upgrades and stress-testing infrastructure, yet Healthcare and Life Sciences are expected to clock a 9.02% CAGR. The January 2025 TEFCA go-live mandates standardized APIs, opening a USD 6.8 billion integration addressable market. Epic and Cerner clients averaged USD 14.3 million each on third-party services to meet FHIR and consent-management requirements.
Automotive and discrete manufacturers harness edge analytics to cut unplanned downtime, spending heavily on network integration and digital twins. Public-sector demand climbed on the back of TMF and state grants, though protracted procurement cycles stretch delivery timelines. Retail, telecom, and logistics verticals lean on omnichannel platforms, 5G core integration, and inventory optimization. Collectively, these shifts reinforce cross-industry demand for talent capable of fusing domain knowledge with cloud, AI, and cybersecurity toolchains, sustaining the growth trajectory of the United States IT Services market.
Geography Analysis
Spending remains geographically concentrated; the Northeast corridor, California, and Texas contributed 61% of 2025 outlays. Washington DC and its Northern Virginia halo captured 9.4% of federal IT allocations, leveraging a pool of 340,000 cleared professionals who deliver classified cloud and zero-trust projects impervious to offshore competition.
California’s USD 94 billion market rides Silicon Valley’s AI surge and Hollywood’s move to cloud-rendered production workflows, though CPRA compliance drains USD 2.7 million a year from mid-market budgets, crowding out innovation. Texas markets itself as a nearshore alternative, hosting 240 captive centers with 67,000 engineers across Austin, Dallas, and Houston.
The Midwest manufacturing belt allocated USD 18.3 billion in 2025 to finance edge-compute rollouts that power predictive maintenance in automotive plants. Detroit’s automakers poured USD 4.1 billion into software-defined vehicles, driving integrator demand for over-the-air update frameworks. The Southeast chalked up 8.9% growth, with Atlanta logistics hubs and Charlotte banking centers investing in warehouse management systems and fraud defense analytics. Rural America lags; only 3.2% of 2025 IT-services spending occurred in counties that house 14% of the population due to limited fiber and a shortfall of digital skills.[3]Federal Communications Commission, “Broadband Deployment Report 2025,” fcc.gov The USD 42.5 billion broadband program will narrow this gap post-2026, but for now providers deploy hybrid models, keeping heavy compute in metro data centers while installing edge nodes to service latency-sensitive rural use cases.
Competitive Landscape
The top five vendorsAccenture, IBM, Cognizant, Tata Consultancy Services, and Microsoftheld about a major share in 2025, leaving room for niche consultancies and regional integrators. Platform ecosystems loom large; IBM’s USD 24.1 billion hybrid-cloud haul proves that owning the underlying stack amplifies services pull-through. Accenture’s USD 620 million cybersecurity buy and USD 3 billion AI investment underline the arms race for domain expertise and proprietary IP. Smaller players such as Slalom and Perficient grew 18% by pairing cloud-native chops with regional intimacy, winning mid-market contracts that tier-1s overlook.
Technology adoption separates winners from laggards. Vendors using proprietary AI coding assistants reduced development cycles 23%, enabling aggressive fixed-price bids. Patent filings reinforce the shift, Infosys logged 340 AI patents in 2025, while Cognizant concentrated blockchain IP on pharma provenance.
Wage inflation narrows offshore advantage, spurring automation investments that shield margins from rising labor costs. Outcome-based pricing spreads risk but elevates customer loyalty, reshaping how vendors staff, govern, and monetize projects across the United States IT Services market.
United States IT Services Industry Leaders
Accenture plc
IBM Corporation
Cognizant Technology Solutions Corp.
Tata Consultancy Services Ltd.
Microsoft Corporation
- *Disclaimer: Major Players sorted in no particular order

Recent Industry Developments
- January 2026: Accenture committed USD 3 billion to enlarge its data and AI practice, planning 25,000 hires and six U.S. innovation hubs.
- January 2026: IBM landed a USD 1.2 billion, seven-year Department of Veterans Affairs contract to migrate nine million patient records to a FHIR-compliant hybrid cloud.
- December 2025: Cognizant purchased a zero-trust cybersecurity consultancy for USD 480 million, adding 1,800 certified professionals.
- November 2025: Tata Consultancy Services and Microsoft forged an alliance to co-create generative-AI solutions for manufacturing and retail.


United States IT Services Market Report Scope
IT services use business and technical skills to assist enterprises in developing, administrating, and optimizing information and business processes. Moreover, the IT services industry in the United States includes a wide range of services that help businesses manage and optimize their information and business operations. IT consulting and implementation, business process outsourcing, IT outsourcing, and other IT services comprise the market.
The United States IT Services Market Report is Segmented by Service Type (IT Consulting and Implementation, Application Development and Maintenance, Infrastructure Services, Managed Services, IT Outsourcing, Business Process Outsourcing, Cloud and Platform Services, Cybersecurity Services, Digital Transformation and Emerging Tech), Deployment Model (Onshore, Nearshore, Offshore), Engagement Model (Project-based, Staff Augmentation, Managed Services), Organization Size (Large Enterprises, SMEs), and End-User Industry (BFSI, Manufacturing, Government, Healthcare, Retail, Telecom, Transportation, Energy, Others). The Market Forecasts are Provided in Terms of Value (USD).
By Service Type
| IT Consulting and Implementation |
| Application Development and Maintenance (ADM) |
| Infrastructure Services |
| Managed Services |
| IT Outsourcing (ITO) |
| Business Process Outsourcing (BPO) |
| Cloud and Platform Services |
| Cybersecurity Services |
| Digital Transformation and Emerging Tech (AI, IoT, Blockchain) |
By Deployment Model
| Onshore Delivery |
| Nearshore Delivery |
| Offshore Delivery |
By Engagement Model
| Project-based / Fixed Price |
| Staff Augmentation / Time-and-Material |
| Managed Services / Outcome-based |
By Organization Size
| Large Enterprises |
| Small and Medium Enterprises (SMEs) |
By End-User Industry
| Banking, Financial Services and Insurance (BFSI) |
| Manufacturing |
| Government and Public Sector |
| Healthcare and Life Sciences |
| Retail and Consumer Goods |
| Telecom and Media |
| Transportation and Logistics |
| Energy and Utilities |
| Other End-User Industries |
| By Service Type | IT Consulting and Implementation |
| Application Development and Maintenance (ADM) | |
| Infrastructure Services | |
| Managed Services | |
| IT Outsourcing (ITO) | |
| Business Process Outsourcing (BPO) | |
| Cloud and Platform Services | |
| Cybersecurity Services | |
| Digital Transformation and Emerging Tech (AI, IoT, Blockchain) | |
| By Deployment Model | Onshore Delivery |
| Nearshore Delivery | |
| Offshore Delivery | |
| By Engagement Model | Project-based / Fixed Price |
| Staff Augmentation / Time-and-Material | |
| Managed Services / Outcome-based | |
| By Organization Size | Large Enterprises |
| Small and Medium Enterprises (SMEs) | |
| By End-User Industry | Banking, Financial Services and Insurance (BFSI) |
| Manufacturing | |
| Government and Public Sector | |
| Healthcare and Life Sciences | |
| Retail and Consumer Goods | |
| Telecom and Media | |
| Transportation and Logistics | |
| Energy and Utilities | |
| Other End-User Industries |


Key Questions Answered in the Report
How large will the United States IT Services market become by 2031?
It is projected to reach USD 737.42 billion by 2031, representing a 7.02% CAGR over 2026-2031.
Which service line is growing fastest among U.S. buyers?
Cybersecurity Services leads with an expected 8.42% CAGR through 2031, driven by zero-trust mandates and rising ransomware risk.
Why are nearshore delivery centers attracting more U.S. clients?
Time-zone alignment, USMCA trade benefits, and labor rates roughly 40% below onshore equivalents are propelling an 8.87% CAGR in nearshore engagements.
What is prompting the shift to outcome-based contracts?
Private-equity sponsors and large enterprises increasingly insist on performance guarantees, causing outcome-linked deals to represent 29% of new signings in 2025.
Which vertical will post the strongest growth through 2031?
Healthcare and Life Sciences is expected to expand at a 9.02% CAGR as TEFCA interoperability rules push hospitals to modernize electronic-health-record integrations.
How severe is the talent shortage for cloud and security skills?
The U.S. faced 377,500 unfilled information-security roles in 2025, raising median cloud-architect salaries to USD 168,000 and compressing vendor margins.
Page last updated on:


