
Market Overview
| Study Period | 2018 - 2031 |
|---|---|
| Forecast Data Period | 2026 - 2031 |
| Base Year Market Size (2025) | USD 53.14 Billion |
| Market Size (2026) | USD 55.61 Billion |
| Market Size (2031) | USD 69.78 Billion |
| Growth Rate (2026 - 2031) | 4.64 % |
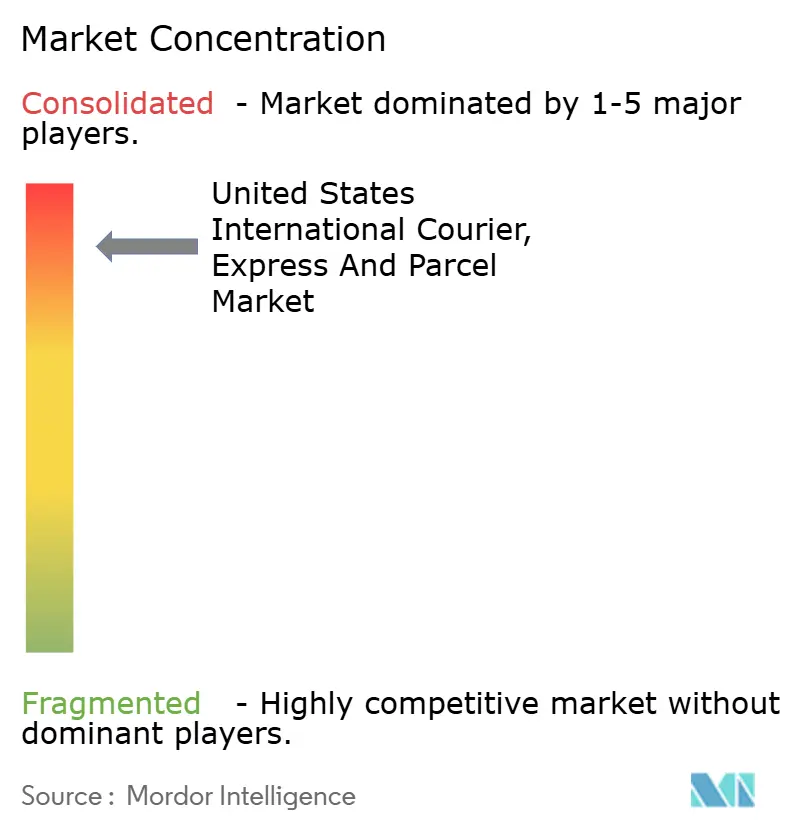
| Market Concentration | High |
Major Players *Disclaimer: Major Players sorted in no particular order Image © Mordor Intelligence. Reuse requires attribution under CC BY 4.0. | |
United States International Courier, Express And Parcel Market Analysis by Mordor Intelligence
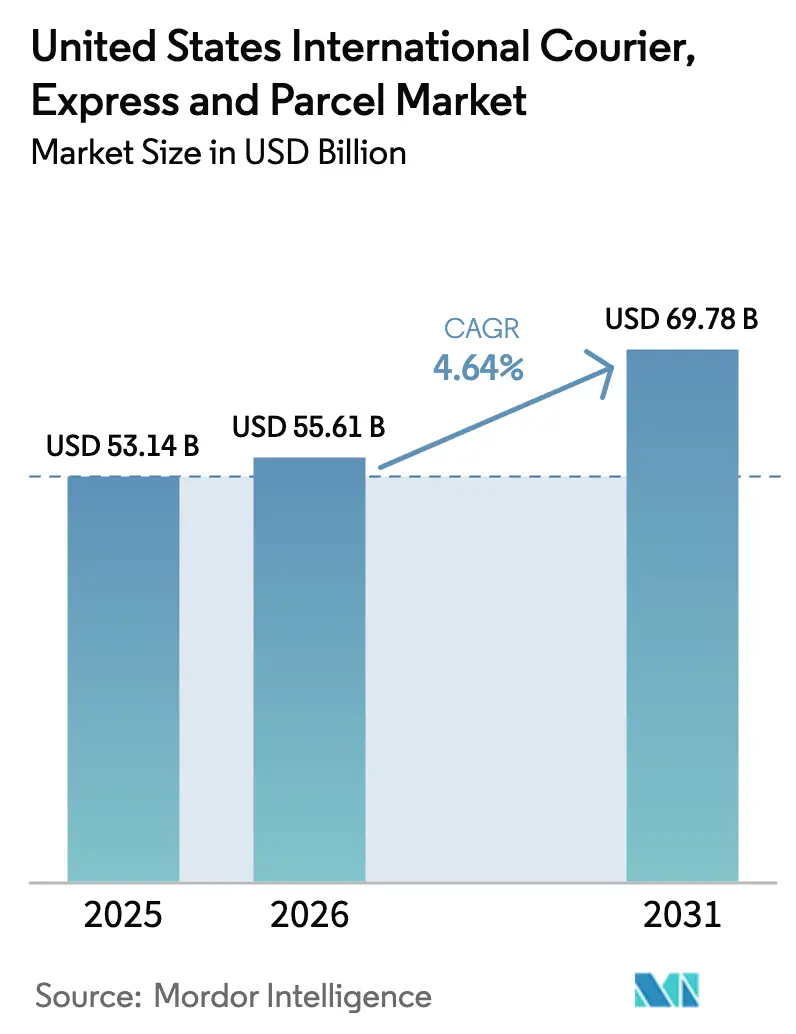
The United States International Courier, Express And Parcel Market size in 2026 is estimated at USD 55.61 billion, growing from 2025 value of USD 53.14 billion with 2031 projections showing USD 69.78 billion, growing at 4.64% CAGR over 2026-2031.
E-commerce-driven demand for rapid cross-border deliveries, new data-intensive customs rules, and the steady recovery of wide-body belly capacity collectively redefine network design and pricing power. Integrators continue to prioritize technological upgrades that cut clearance time and enhance shipment visibility, while smaller operators pursue niche verticals to offset rising compliance costs. Meanwhile, regulatory attention on the USD 800 de minimis threshold is re-shaping cost structures for ultra-fast fashion platforms and sparking debate over the duty-free treatment of Section 301 goods. Airport slot constraints, especially at Newark Liberty International, amplify the premium placed on operational agility as carriers juggle alternative routings to protect time-definite service guarantees.
Key Report Takeaways
- By end user industry, E-commerce retained a 42.20% revenue share in 2025; wholesale and retail trade (offline) is on track for the highest CAGR at 5.31% between 2026-2031.
- By speed of delivery, express services led with 67.05% of the United States international courier market share in 2025 and are projected to record the fastest segment growth at a 5.88% CAGR between 2026-2031.
- By shipment weight, light-weight shipments accounted for 72.10% share of the United States international courier market size in 2025, while the medium-weight shipments are projected to expand at a 5.74% CAGR between 2026-2031.
- By model, business-to-business (B2B) shipments held 50.30% revenue share in 2025, whereas business-to-consumer (B2C) flows will outpace at a 4.87% CAGR between 2026-2031.
Note: Market size and forecast figures in this report are generated using Mordor Intelligence’s proprietary estimation framework, updated with the latest available data and insights as of 2026.
Market Trends and Insights
Drivers Impact Analysis of United States International Courier, Express And Parcel Market*
| Driver | (~) % Impact on CAGR Forecast | Geographic Relevance | Impact Timeline |
|---|---|---|---|
| USMCA-driven growth in SME parcel flows to Canada and Mexico | +0.8% | North America | Medium term (2-4 years) |
| Cross-border DTC imports surge, influenced by USD 800 de-minimis threshold | +1.2% | Asia-Pacific to US | Short term (≤2 years) |
| Ultra-fast fashion platforms like Temu and Shein propel surge in less than 2 kg parcel shipments | +0.9% | China-to-US corridor | Short term (≤2 years) |
| Paperless trade and ACE/ITDS automation reducing clearance time | +0.4% | Major US gateways | Medium term (2-4 years) |
| Wide-body belly capacity recovery cutting international air-freight rates | +0.3% | Transcontinental routes | Short term (≤2 years) |
| ESG-focused contracts favor carbon-accounted green-lane express offerings | +0.2% | North America and EU | Long term (≥4 years) |
| Source: Mordor Intelligence | |||
USMCA-Driven Growth in SME Parcel Flows to Canada and Mexico
CBP regulations that took effect in March 2025 simplified origin certification, enabling blanket declarations that cover multiple shipments and lowering paperwork for frequent traders[1]. Small and medium sellers quickly expanded cross-border catalogs, lifting demand for fast, trackable parcel services. Integrators use enhanced data feeds to pre-clear consignments and shorten door-to-door transit by up to a full day on select lanes. Automakers that reorganized component flows within the USMCA bloc have also turned to express couriers for critical parts, elevating average revenue per shipment. Competitive differentiation now hinges on real-time visibility tools that reassure SMEs about customs compliance.
Cross-Border DTC Imports Surge, Influenced by USD 800 De-Minimis Threshold
CBP processed more than 1 billion de-minimis parcels in 2024, a six-fold jump since 2016. Proposed rules to deny Section 301 goods duty-free status and mandate richer data elements may generate up to USD 7.8 billion in new duties yet could tilt business toward carriers with robust compliance infrastructure. Platforms shipping straight from China ramped up pre-advice filings and SKU-level harmonized codes, pushing courier IT spend higher. Larger integrators view the heavier documentation load as a competitive moat that squeezes smaller rivals. The looming change also nudges online sellers to explore near-shore inventory models, fostering two-way trade within the Americas.
Ultra-Fast Fashion Platforms Propel Surge in Less Than 2 kg Parcel Shipments
Tech-enabled brands like Shein and Temu now dominate fast‐fashion import volumes, routinely dispatching less than 2 kg packages that bypass traditional distribution centers. Their data-rich order management systems feed directly into courier booking APIs, turning round-the-clock order drops into near-continuous uplift demand. Integrators rebalance aircraft mix toward narrow-body feeders to accommodate the skewed weight profile and increase sortation headcount at West Coast gateways. Although pending tariff changes threaten the existing model, platform agility and influencer-led micro-collections support sustained shipment frequency.
Paperless Trade and CE/ITDS Automation Reducing Clearance Time
Full electronic manifesting inside CBP’s ACE platform, covering all modes by 2025, slashes documentation errors and accelerates PGA risk assessments[2]. Digital container shipping association analyses show e-bills of lading can shave USD 6.5 billion in annual costs, benefits that cascade into the express parcel ecosystem through shared data standards[3]. Couriers leverage the same data pipes to preload entry summaries and achieve less than 2-hour average release windows at key airports, freeing line-haul capacity for additional rotations.
Restraints Impact Analysis of United States International Courier, Express And Parcel Market*
| Restraint | (~) % Impact on CAGR Forecast | Geographic Relevance | Impact Timeline |
|---|---|---|---|
| CBP advanced electronic data AED mandate raising compliance costs | -0.6% | All inbound US lanes | Short term (≤2 years) |
| Gateway airport congestion and slot constraints impacting time-definite SLAs | -0.4% | Major US hubs | Medium term (2-4 years) |
| Integrator peak surcharges and jet-fuel volatility compressing SME margins | -0.3% | High-volume corridors | Short term (≤2 years) |
| Return and dispute rates surge due to gaps in destination market postal services | -0.2% | Selected developing regions | Medium term (2-4 years) |
| Source: Mordor Intelligence | |||
CBP Advanced Electronic Data Mandate Raising Compliance Costs
Enhanced ACAS requirements obligate carriers to transmit 100% shipment data before wheels-up, driving multi-million-dollar platform upgrades. Penalties for late or inaccurate filings intensify operational risk, especially for smaller couriers with fragmented agent networks. Integrators amortize investment over higher shipment density, widening a cost gap that accelerates consolidation. Parallel USPS inbound mail rules reinforce a shift toward private-sector handlers able to guarantee data integrity.
Gateway Airport Congestion and Slot Constraints Impacting Time-Definite SLAs
Newark Liberty capped movements at 28 per hour during ongoing works through 2025, forcing carriers to re-time wide-body arrivals and build regional truck-air shuttles. Similar slot stewardship programs at JFK and LAX tighten peak-hour flexibility. These constraints boost the strategic value of secondary gateways in Tennessee and Indiana, although ground line-haul distances add cost and erode some express transit advantages. Carriers continue to lobby the FAA for seasonal slot flexibility tied to ecommerce peaks.
*Our forecasts treat driver/restraint impacts as directional, not additive. The impact forecasts reflect baseline growth, mix effects, and variable interactions.
United States International Courier, Express And Parcel Market Segment Analysis
By End-User Industry:
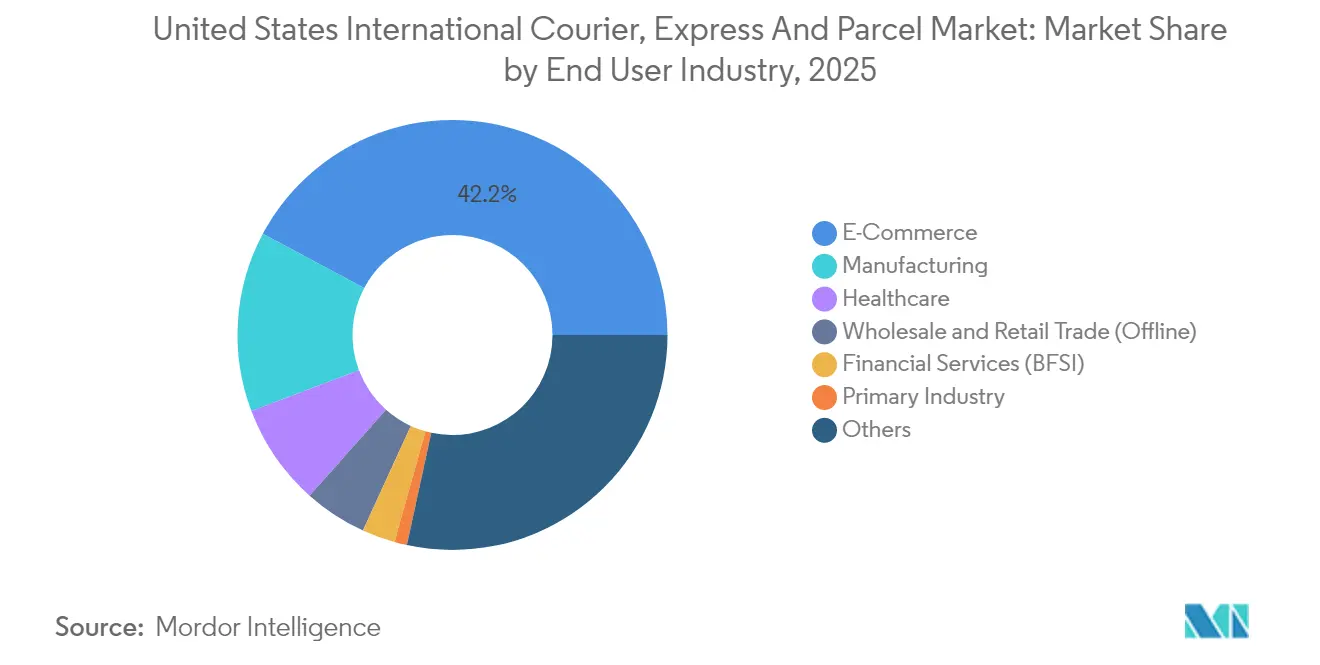
Offline Retailers Accelerate Digital SourcingE-commerce shipments captured 42.20% share in 2025, a figure that grows more modestly as penetration plateaus in affluent zip codes. Merchandise categories diversify beyond electronics into beauty, nutraceuticals, and hobby items, each with unique compliance documents that elevate the expertise premium for couriers. Manufacturing retains second position, benefiting from multi-regional component sourcing that underpins just-in-sequence assembly lines. Temperature-controlled pharmaceuticals spur investment in small active-container fleets fitted with IoT sensors that communicate directly with ACE portals.
Wholesale and retail trade (offline) posts the fastest 5.31% CAGR (2026-2031) as big-box store operators digitize supplier portals and run smaller, more frequent international restocks. Their pivot tightens delivery windows, incentivizing contract clauses that penalize late freight and elevate network reliability. BFSI reliance on physical documents declines in absolute terms, but courier spending per shipment rises as firms choose secure chain-of-custody services to protect sensitive records from cyber risk. Ancillary industries—ranging from aerospace to luxury goods—continue outsourcing critical-item logistics, extending the United States international courier market’s breadth across the real economy.

By Speed of Delivery:
Express Services Extend Market LeadExpress services generated 67.05% of the United States international courier market revenue in 2025 as cross-border merchants emphasized checkout promises that mirror domestic standards. Demand elasticity favors premium transit, enabling operators to introduce Saturday cut-offs and late-night pick-ups. The segment’s 5.88% CAGR between 2026-2031 outpaces historical growth, reflecting continued cross-border marketplace expansion and corporate inventory shifts toward near-real-time replenishment. Non-express offerings still carry substantial volume but confront customer migration toward ocean-plus-last-mile hybrids on heavier lanes. FedEx’s Network 2.0 co-locations illustrate how integrators blend express and deferred parcels within a single service envelope, optimizing sort window utilization. Capacity rationalization on medium-haul lanes allows providers to re-deploy aircraft toward Asia-US trunk routes where density rewards higher-priced time guarantees.
Competitive positioning inside the express bracket is moving away from pure speed toward data-rich experience. Carriers embed customs status notifications into merchant dashboards, simplifying customer service by cutting “where-is-my-parcel” queries. The end result is a sharper value proposition that protects yields even as fuel indices fluctuate. Non-express players experiment with value-added evening deliveries and carbon-offset bundles but face difficulty matching the network depth of top-tier integrators. As US-Mexico e-commerce matures, regional express specialists leverage cross-dock hubs at Laredo and El Paso to shorten line-haul and divert volume from coastal air gateways.
By Shipment Weight:
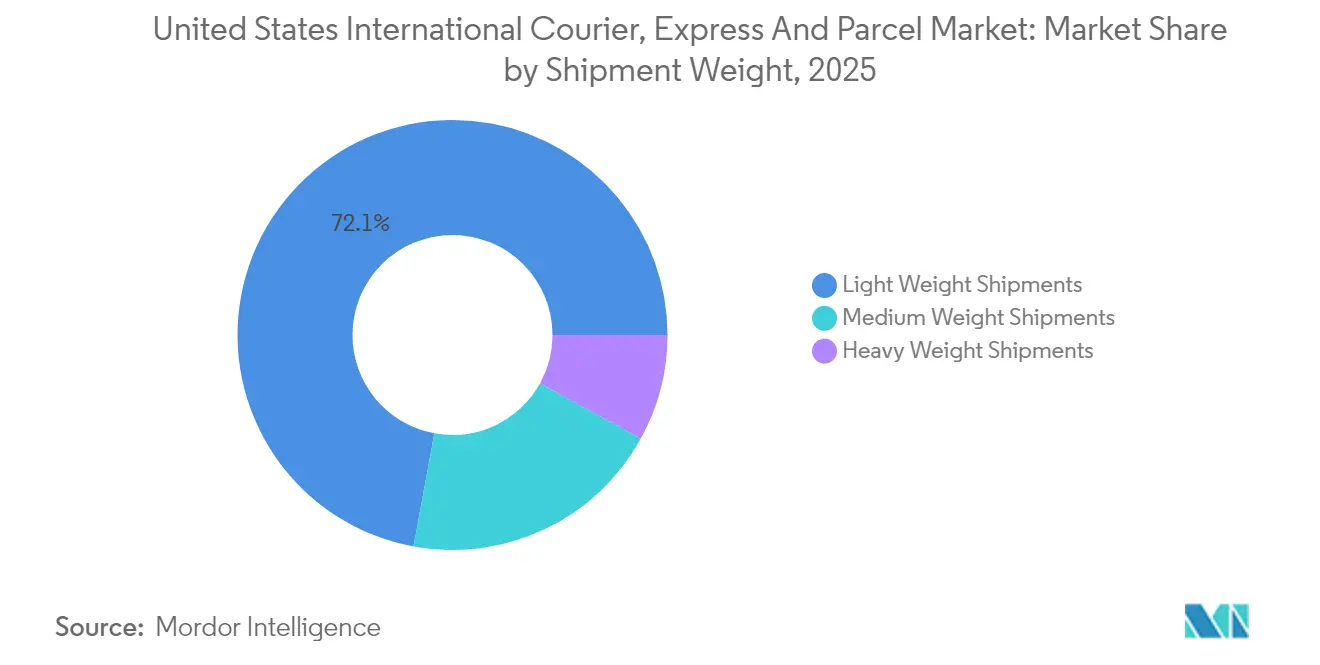
Medium Weight Shipments Gain MomentumLight weight shipments maintained 72.10% of the United States international courier market size in 2025, anchored by consumer gadgets and apparel. Yet the medium weight shipments show the strongest 5.74% CAGR (2026-2031), driven by consolidated consumer orders and inventory top-ups for omnichannel retailers. Sellers combine multiple SKUs into one box to mitigate potential de minimis reform risk, nudging average declared weight higher. Couriers respond with dynamic pricing ladders that reward incremental kilos and defend margins on lighter tiers. Ultra-fast fashion’s emphasis on micro-drops still keeps sub-2 kg density at unprecedented levels, prompting investment in small-package sorters and mobile unload crews at airport warehouses.
Heavy weight shipments remain niche but critical for spare parts and medical-device emergencies where speed trumps mode economics. Airlines reinstating pre-pandemic wide-body frequencies offer discounted freight rates that nibble at courier yield, pushing operators to develop bundling strategies such as timed retrieval, specialized crating, or in-field technician dispatch. The diversity in weight mix encourages network planners to re-engineer cut-off times by lane, giving medium-weight flows priority during afternoon uplifts when volumetric imbalance is lowest.
By Model:
Business-to-Consumer (B2C) Momentum Remains StrongBusiness-to-business (B2B) consignments still hold 50.30% of market revenue, yet the business-to-consumer (B2C) lane’s 4.87% CAGR (2026-2031) signals persistent rebalancing. Marketplaces integrate artificial-intelligence-driven duty calculators that remove buyer uncertainty, stimulating higher ticket values and heavier multicategory baskets. Couriers earn incremental margin through API-based landed-cost solutions that ensure up-front transparency. The healthcare-focused UPS–Andlauer deal illustrates a counter-trend play: expanding specialized B2B verticals where regulatory oversight and temperature assurance support premium yields.
Consumer-to-consumer (C2C) traffic stays comparatively small; however, social-commerce influencers occasionally trigger bursts that test network elasticity. Operators experiment with locker pickup at destination to lower residential delivery touches and mitigate failed-delivery costs endemic to C2C parcels. Over time, the integration of B2B and B2C flows onto unified aircraft networks promises higher asset utilization, but data-segmentation by model remains a must for customs governance and customer analytics.
Geography Analysis
North American corridors, buoyed by USMCA reforms, are the first to benefit from simplified documentation, driving an uptick in SME-driven two-day services between the Midwest and central Mexico. The region’s lane mix strengthens secondary airports such as Monterrey and Calgary, spreading volumes away from legacy hubs. On Asia-Pacific routes, notably China-US traffic, proposed de-minimis rule revisions create tariff uncertainty that motivates some sellers to pre-position inventory in bonded US warehousing. Gateways on the West Coast absorb this shift yet confront berth and intermodal constraints that compel carriers to revise cut-off times and move partial volumes through Dallas/Fort Worth or Phoenix for onward trucking to coastal distribution centers.
Transatlantic flows remain steady, supported by strong US consumer appetite for European luxury goods and EU demand for tech components. Slot caps at Newark Liberty, JFK, and London Heathrow, however, inject volatility into uplift planning. Express operators increasingly book belly space on evening passenger departures to hedge against morning slot shortages. Intra-Americas trade, particularly perishables and apparel moving from Central America, grows in relevance as brands near-shore production to diversify beyond East Asia. Regulatory realignment in Mexico, where a 19% tax now applies to low-value e-commerce imports from non-FTA nations, alters route selection; couriers reroute via Laredo ground crossings to leverage US pre-clearance processes before southbound final mile.
Within the United States, geographic dispersion of e-commerce demand favors multi-node sort-center footprints. Eastern seaboard congestion encourages integrators to beef up Cincinnati, Louisville, and Greensboro operations, granting faster turnarounds on Europe-origin parcels. Midwest air hub expansion caters to growing automotive and industrial component traffic linked to reshoring. Western gateways like Ontario, California, pick up Asia-origin e-commerce surges but must contend with environmental curfews that cap nighttime sorts. Together, these regional adaptations ensure the United States’ international courier market maintains resilience amid fluctuating global trade currents.
Regulatory Landscape
The United States international courier, express and parcel market operates under a customs- and aviation-led compliance stack anchored by U.S. Customs and Border Protection (CBP) and its digital filing infrastructure (ACE/ITDS). Trade facilitation and enforcement are moving in parallel: CBP expanded paperless processing by 2025, while advanced electronic data (AED) requirements and scrutiny around the USD 800 de minimis threshold raise data completeness expectations for inbound parcels, particularly in high-volume DTC and marketplace flows.
In 2026, domestic and cross-border parcel economics were also shaped by postal and transportation rulemaking and broader liability shifts. USPS announced a time-limited 8% price increase for competitive products effective April 26, 2026 through January 17, 2027, and implemented additional competitive product price and mailing standard changes effective July 12, 2026 under PRC docketing, affecting how shippers benchmark air and parcel alternatives. Separately, the U.S. Supreme Court decision in Montgomery v. Caribe Transport (2026) highlighted state-level litigation exposure for brokered transportation, reinforcing carrier vetting and contractual risk management across line-haul and last-mile procurement in the parcel ecosystem.
Value Chain Analysis
International CEP value creation typically starts with shipper onboarding (merchant platforms, postal consolidators, and freight forwarders), then moves through data capture and pre-advice for customs (including AED and harmonized classification), pickup and first-mile transport, export handling, and trunk transport (airline belly space, integrator air networks, or combined air-ground solutions). Destination processing covers import clearance through CBP systems, sortation at gateway and hub facilities, and last-mile delivery either through integrator networks or partner injection models that use USPS or regional carriers for residential density.
The chain is increasingly differentiated by data and risk controls rather than pure line-haul speed. CBP digitization via ACE/ITDS and full electronic manifesting through 2025 increased the importance of API connectivity between marketplaces, brokers, and carriers, while also raising the value of compliance-centric service layers such as SKU-level data quality, exception management, and returns governance. On the domestic interface that supports cross-border delivery, USPS competitive product changes in 2026 and the 2026 Supreme Court broker-liability ruling pushed shippers and logistics intermediaries to tighten carrier qualification, insurance coverage, and network redundancy across pickup, line-haul, and final-mile handoffs.
Competitive Landscape
Consolidation defines the strategic backdrop as DSV’s USD 15.78 billion purchase of DB Schenker vaults the Danish group to the top of global freight forwarder rankings[4]. Scale empowers the new entity to negotiate better interline rates and invest in unified visibility stacks that integrate courier, forwarding, and contract-logistics workflows. Incumbent integrators respond with targeted vertical plays; UPS’s pending Andlauer takeover reinforces its position in temperature-controlled healthcare, a segment less vulnerable to price commoditization. FedEx accelerates Network 2.0 site mergers to squeeze USD 2 billion in annual efficiencies, funneling savings into its FDX Commerce platform that promises merchants inventory, checkout, and last-mile orchestration in one subscription.
Digital entrants leverage platform economics rather than asset heft. Several e-commerce marketplaces negotiate bulk block-space agreements directly with airlines, then outsource last-mile to regional couriers, fragmenting the traditional integrator monopoly. Yet high regulatory thresholds, particularly for advanced electronic data (AED) compliance, limit how far asset-light models can penetrate without partnering established operators. Private-label retailers such as Amazon continue to expand cross-border air capacity but still rely on third-party customs brokers for statutory filings, preserving a role for legacy couriers.
Price volatility in jet fuel and the seasonal peak surcharge cycle intensify margin pressure on SMEs, nudging them toward multi-carrier shipping software that brokers real-time rates. Carriers counter by bundling returns management and carbon accounting to deepen account stickiness. Investment focus converges on artificial intelligence for demand forecasting, warehouse robotics for small-parcel sortation, and blockchain pilots that tie trade documents to immutable ledgers. The competitive field increasingly rewards integrated data-physical hybrids capable of meeting regulators’ appetite for granular shipment intelligence while sustaining speed and reliability.
United States International Courier, Express And Parcel Industry Leaders
-
FedEx
-
United Parcel Service of America, Inc. (UPS)
-
DHL Group
-
United States Postal Service (USPS)
-
SF Express (KEX-SF, KEX Express US LLC)
- *Disclaimer: Major Players sorted in no particular order
United States International Courier, Express And Parcel Market Companies Covered in this Report
- Aramex
- Averitt Express
- Canada Post Corporation (Including Purolator)
- DHL Group
- Easyship, Inc.
- FedEx
- Flexport, Inc.
- Japan Post Holdings Co., Ltd. (Including Toll Group)
- La Poste Group (Including Geopost/Asendia)
- Passport Shipping
- SF Express (KEX-SF, KEX Express US LLC)
- ShipBob, Inc.
- TFI International, Inc. (Including TForce Logistics)
- United Parcel Service of America, Inc. (UPS)
- United States Postal Service (USPS)
Read Analysis of United States International Courier, Express And Parcel Companies
Market Opportunities and Future Outlook
Compliance-as-a-service and data-led brokerage present a concrete whitespace as AED requirements and potential de minimis enforcement tightening raise the operating cost of cross-border parcel flows. Couriers, forwarders, and shipping platforms can monetize richer pre-clearance toolsets, including HS-code validation, denied-party screening, landed-cost calculators, and exception workflows, to reduce holds and rework. The broader backdrop includes CBP processing of more than 1 billion de minimis parcels in 2024 and expanding use of paperless trade via ACE/ITDS by 2025, which favors operators able to deliver clean, early data at scale.
Network design and last-mile access models are also shifting toward partnerships and multi-node routing that protect service levels under congestion and pricing pressure. Newark Liberty movement caps through 2025 and similar slot stewardship at major gateways increase the value of secondary hubs and hybrid air-ground routings, while USPS competitive product pricing actions in 2026 and large-scale negotiated delivery agreements influence shipper buy-versus-partner decisions for residential delivery. Together, these developments support opportunities for integrators and regional specialists that can provide flexible injection points, returns management, and contracted, carbon-accounted service options for enterprise accounts balancing speed with auditability.
Recent Industry Developments in United States International Courier, Express And Parcel Market
- July 2026: FedEx Corporation agreed to sell FedEx Supply Chain to CMA CGM Group for an enterprise value of USD 1.4 billion. The sale marks a strategic divestiture in contract-logistics. Refocus on core express and air networks expands CMA CGM footprint in U.S. logistics opportunities and may realign pricing in North American logistics.
- May 2026: DHL Group (DHL eCommerce) & United States Postal Service (USPS) entered a multi-year exclusive contract for last-mile parcel delivery in the U.S. valued at over USD 10 billion. The partnership consolidates last-mile capacity with DHL. It reduces dependence on a single carrier and strengthens cross-border e-commerce fulfilment efficiency.
- May 2026: FedEx Corporation invested EUR 46 million to expand the European road hub in Duiven, Netherlands. The investment expands cross-border road-transport capacity in Europe. It increases palletized freight handling capacity and dock doors, enhancing network robustness as a complement to air and express networks.
United States International Courier, Express And Parcel Market Report Scope and Research Methodology
Market Definition and Coverage
This market covers revenues earned from cross-border courier, express, and parcel shipments handled by operators serving the United States, including international inbound and outbound parcel movement where the origin or destination is outside the country.
Scope exclusions: This sizing does not count purely domestic parcel activity that stays within the United States from pickup to delivery.
Segments Covered in This Report
- Speed of Delivery
- Express
- By Route
- Inter-Region
- Intra-Region
- By Route
- Non-Express
- Express
- Shipment Weight
- Heavy Weight Shipments
- Light Weight Shipments
- Medium Weight Shipments
- End User Industry
- E-Commerce
- Financial Services (BFSI)
- Healthcare
- Manufacturing
- Primary Industry
- Wholesale and Retail Trade (Offline)
- Others
- Model
- Business-to-Business (B2B)
- Business-to-Consumer (B2C)
- Consumer-to-Consumer (C2C)
Data Sources, Market Sizing, and Validation
Desk Research
We start with desk research to set clear boundaries and build a clean demand picture for international parcels moving in and out of the United States. Public sources such as US Census Bureau trade series, the Bureau of Transportation Statistics, US International Trade Commission dashboards, and US Customs and Border Protection publications are used to anchor trade intensity, shipment patterns, and policy signals that can affect cross-border parcels.
The model is then supported with company filings, investor presentations, annual reports, and credible press coverage that explain network changes, surcharges, and service shifts. Where available, paid subscriptions for company financials and intelligence, shipment-level import and export records, and news and financials are used to cross-check revenue direction and pricing context, without relying on any single dataset. These desk sources are illustrative rather than exhaustive, and many other references were also used for data collection, validation, and research clarification.
Primary Interviews and Surveys
Primary work is used to test the desk assumptions that usually create the biggest spread, like international mix, surcharge pass-through, and the share of express versus deferred services. We spoke with carrier-side leaders, parcel intermediaries, and large shippers focused on key US sending and receiving corridors, and we used their input to confirm the final price and volume logic applied.
Distribution of primary research fieldwork respondents
| Company type | Respondent position |
|---|---|
| Top tier: 28% | CXOs: 12% |
| Mid tier: 54% | Functional/Unit leaders: 31% |
| Smaller Players: 18% | Managers: 57% |
Market-Sizing & Forecasting
Sizing is built mainly through a top-down demand pool reconstruction that starts from international shipping activity and trade-linked parcel movements, then converts that into market value using service mix and pricing logic. After the first-pass totals are created, we corroborate them with selective bottom-up checks, including sampled operator revenue splits tied to international services, channel checks with intermediaries, and observed price bands multiplied by shipment volumes.
Key inputs that shape the model include international parcel and document intensity by major trade corridors, express versus deferred share shifts, average billable weight and dimensional-weight trends, fuel and peak season surcharge behavior, and customs-related handling factors that affect yield. Because some operators do not disclose international parcel revenues cleanly, gaps are handled using consistent allocation rules that are tested through interviews and then checked against observed service patterns.
For forecasting, scenario analysis is used to reflect different outcomes for trade conditions, cross-border e-commerce demand, and carrier pricing discipline, and then the base case is selected after reconciling it with expert consensus. This keeps the forward view grounded, since the main drivers are observable, can be updated quickly, and connect back to repeatable inputs.
Data Validation & Update Cycle
Outputs are validated through triangulation across independent signals, and we investigate the largest variances before finalizing the numbers. Checks include year-over-year consistency, price and mix reasonableness, and comparisons against related indicators such as trade directionality and capacity or network announcements that can move cross-border parcel flows.
A multi-step internal review is followed, and re-contacts are triggered when a data point changes the implied price, volume, or international share beyond a sensible range. Reports are refreshed annually, with interim updates for material events that can shift market direction, and a final pre-delivery pass is completed so clients receive the latest updated view.
Mordor Intelligence's United States International Courier Express and Parcel Market Estimate Compared With Other Published Estimates
Published market sizes for US international CEP often differ because each publisher draws the line differently between cross-border parcels and domestic flows, and they also make different calls on whether adjacent shipping revenue gets counted in the same bucket. Differences also show up when pricing inputs are refreshed at different times, since surcharges and lane yield can change within a year.
Customs release patterns and trade-lane shipment signals are used as sanity checks that keep Mordor Intelligence tied to cross-border parcel revenue only, including standard and express parcels but excluding domestic-only parcels and heavier freight moves. Another gap driver is timing, since some estimates annualize a prior year revenue pool and then extend it forward without re-testing express mix, billable-weight shifts, and surcharge behavior for the current period.
Benchmark comparison
| Source | Market Size | Gaps in Research Methodology |
|---|---|---|
| Mordor Intelligence | USD 53.14 B (2025) | |
| Industry Database A | USD 3.26 B (2024) | Uses a narrow service interpretation that appears closer to a limited international express subset, which can exclude a large share of standard cross-border parcels and some shipper use cases. |
| Industry Statistics B | USD 197.90 B (2023) | Presents an all-parcel revenue style figure without isolating international-only flows, so domestic CEP revenue and broader shipping categories can be blended into a much larger total. |
The spread in published figures is mostly explained by scope boundaries and by how current-year pricing and mix are refreshed. By tying the market value back to repeatable demand signals and simple checks, the final number remains easier to reconcile and update when conditions change.
Key Questions Answered in the Report
What is the current size of the United States international courier market?
The market stands at USD 55.61 billion in 2026 and is projected to reach USD 69.78 billion by 2031.
Which segment is growing fastest by speed of delivery?
Express services are advancing at a 5.88% CAGR (2026-2031) as merchants pay premiums for time-definite cross-border delivery.
How does the USD 800 de-minimis rule affect couriers?
It fuels high parcel volumes but may raise compliance complexity and duty exposure if CBP’s proposed exclusions for Section 301 goods take effect.
Why are medium-weight parcels gaining traction?
Consolidated multi-item orders and just-in-time inventory strategies push more shipments into the >5 kg to ≤31.5 kg band, which is expanding at a 5.74% CAGR (2026-2031).
What impact do airport slot caps have on service reliability?
Restrictions at hubs like Newark Liberty force carriers to reroute flights and add ground legs, potentially lengthening transit times if alternative capacity is unavailable.
How are couriers responding to stricter electronic data mandates?
Leading integrators invest in advanced IT platforms to pre-file detailed shipment information, turning compliance into a competitive advantage while smaller firms may seek partnerships or exit the market.