
Market Overview
| Study Period | 2020 - 2031 |
|---|---|
| Forecast Data Period | 2026 - 2031 |
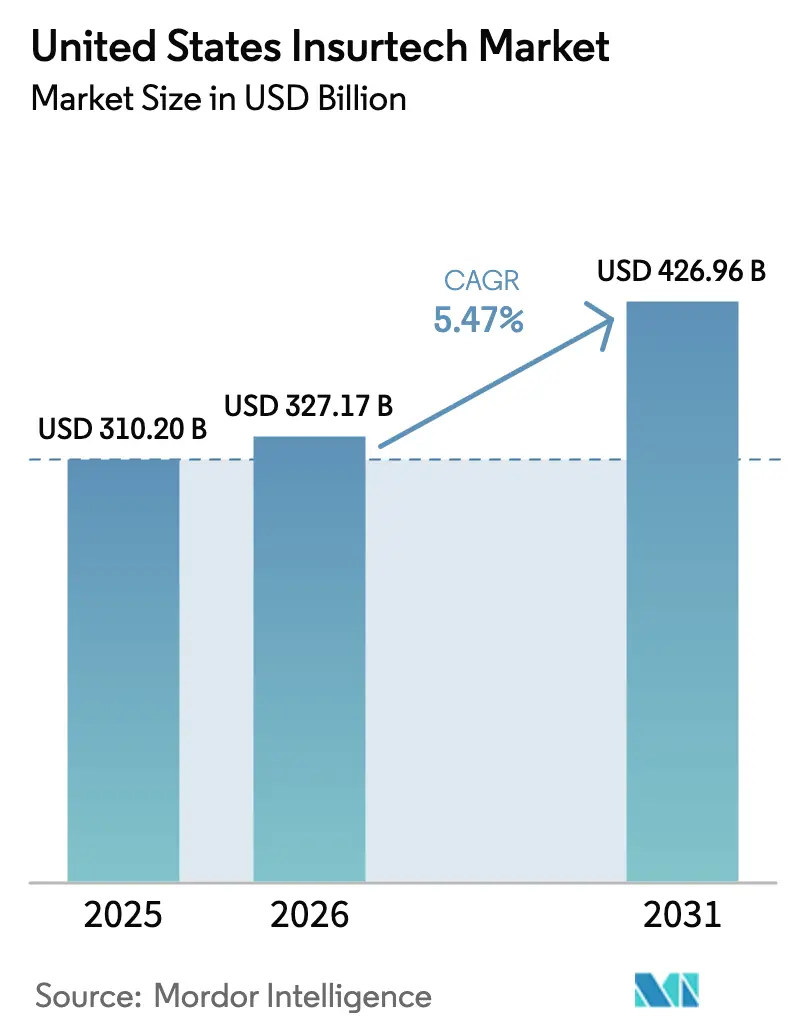
| Base Year Market Size (2025) | USD 310.2 Billion |
| Market Size (2026) | USD 327.17 Billion |
| Market Size (2031) | USD 426.96 Billion |
| Growth Rate (2026 - 2031) | 5.47% CAGR |
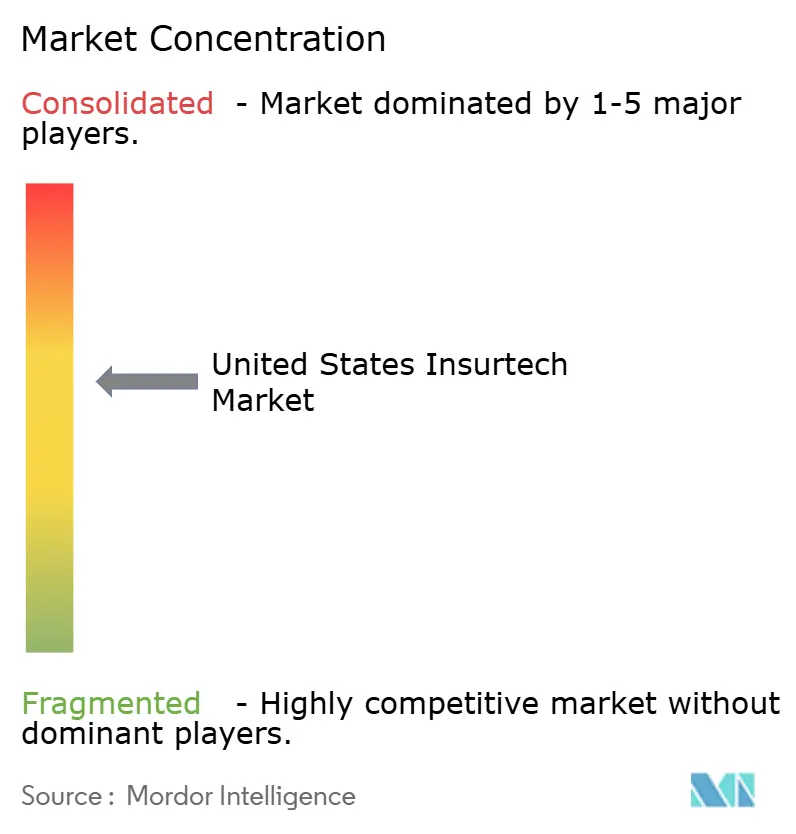
| Market Concentration | Medium |
Major Players *Disclaimer: Major Players sorted in no particular order Image © Mordor Intelligence. Reuse requires attribution under CC BY 4.0. | |
United States Insurtech Market Analysis by Mordor Intelligence
The United States insurtech market size was valued at USD 310.2 billion in 2025 and estimated to grow from USD 327.17 billion in 2026 to reach USD 426.96 billion by 2031, at a CAGR of 5.47% during the forecast period (2026-2031). Robust venture funding, a widening network of regulatory sandboxes across 12 states, and the National Association of Insurance Commissioners (NAIC) Model Bulletin on artificial intelligence (AI) governance underpin this steady expansion. Carrier modernization agendas, although hampered by legacy platforms, continue to accelerate as open-API mandates facilitate seamless data exchange with fintech partners. Meanwhile, embedded-insurance partnerships are reshaping distribution economics, enabling contextual cover to be offered inside everyday financial journeys. Consolidation among reinsurers and full-stack digital carriers is redefining competitive boundaries, while climate-risk parametric products and usage-based pricing fuel product innovation speaks to evolving customer risk profiles.
Key Report Takeaways
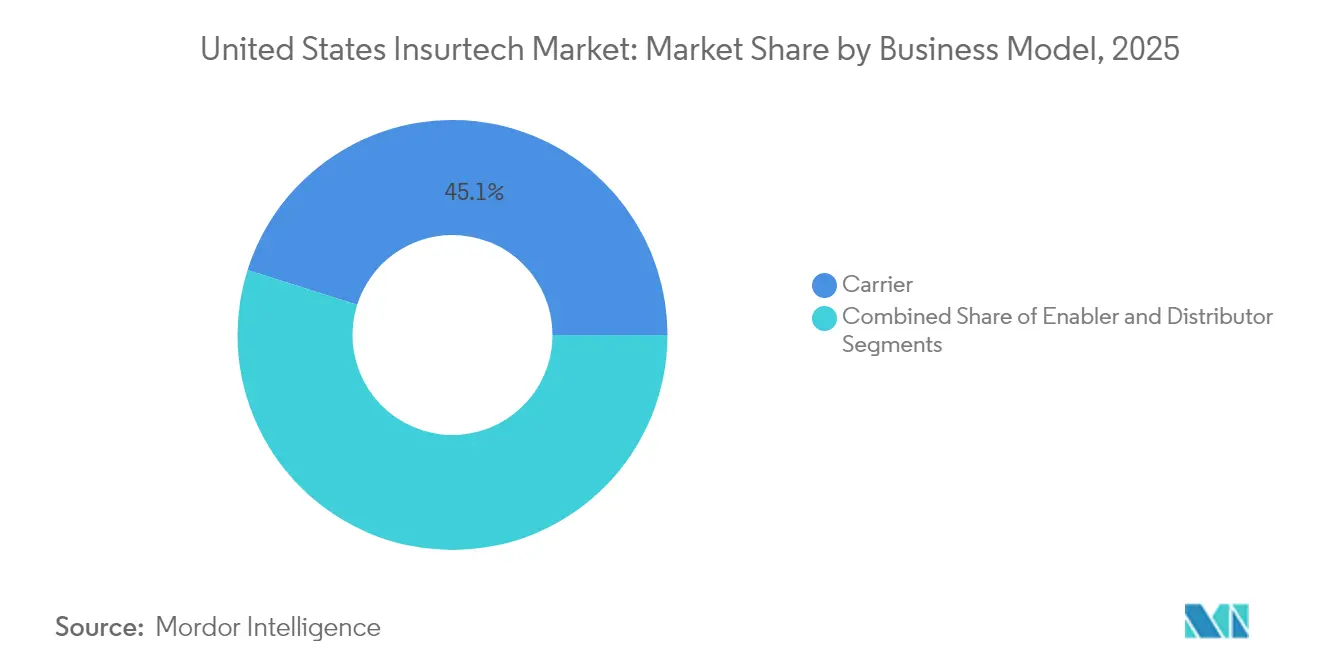
- By business model, carrier operations led with 45.12% of the United States insurtech market share in 2025; Enabler models record the highest projected CAGR at 5.74% through 2031.
- By insurance line, non-Life lines accounted for 71.65% of the United States insurtech market size in 2025 and are expanding at 6.34% CAGR through 2031.
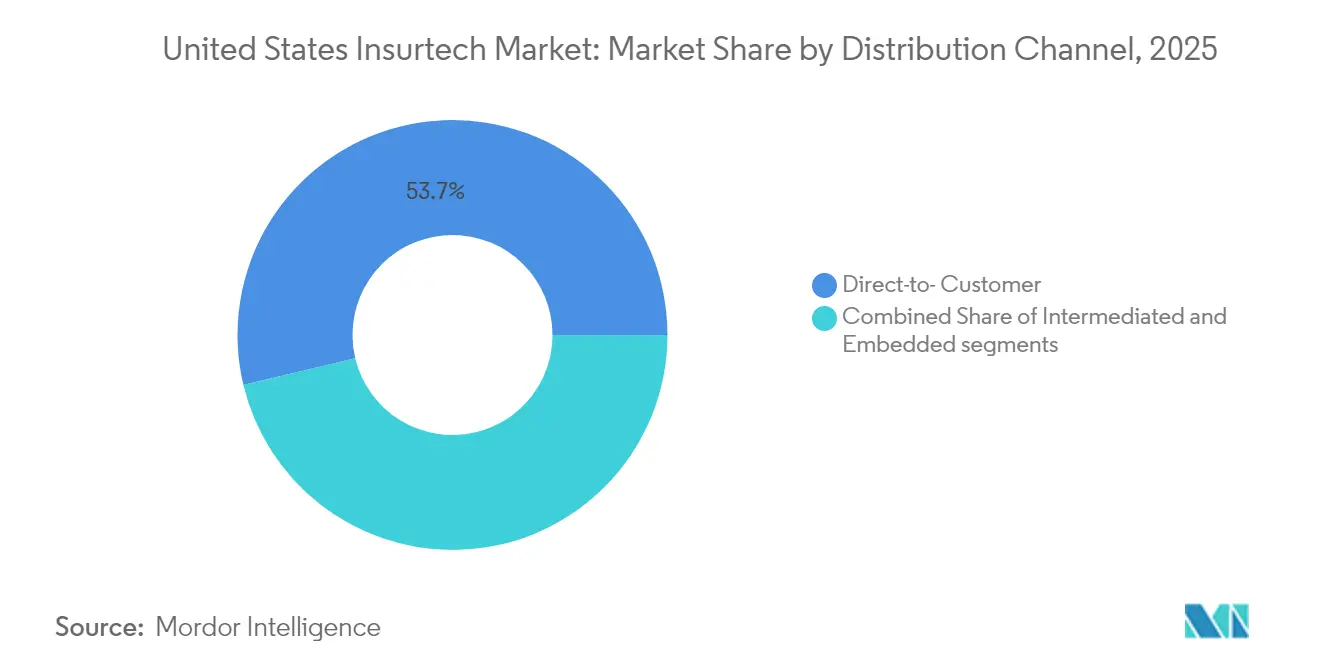
- By distribution channel, direct-to-consumer captured 53.74% revenue share in 2025, while embedded distribution is projected to grow at 5.52% CAGR to 2031.
- By geography, the Northeast region held 42.86% revenue share in 2025 and is advancing at a 6.61% CAGR through 2031.
Note: Market size and forecast figures in this report are generated using Mordor Intelligence’s proprietary estimation framework, updated with the latest available data and insights as of 2026.
United States Insurtech Market Trends and Insights
Drivers Impact Analysis*
| Driver | ( ~ ) % Impact on CAGR Forecast | Geographic Relevance | Impact Timeline |
|---|---|---|---|
| Demand for data analytics & AI | +1.8% | National, concentrated in Northeast & West Coast | Medium term (2–4 years) |
| Digital-first consumer purchasing | +1.2% | National, strongest in urban markets | Short term (≤ 2 years) |
| Regulatory sandbox & open-API mandates | +0.9% | State-specific, led by Kentucky, Vermont, West Virginia | Long term (≥ 4 years) |
| Embedded-insurance via open banking | +1.1% | National, early adoption in fintech hubs | Medium term (2–4 years) |
| Climate-risk parametric products | +0.7% | Regional, catastrophe-prone zones | Long term (≥ 4 years) |
| Usage-Based & Behavior-Based Pricing (UBI/BBI) | +0.8% | National, higher penetration in auto-centric regions | Short term (≤ 2 years) |
| Source: Mordor Intelligence | |||
Demand for Data Analytics & AI
88% of US auto insurers and 70% of home insurers already deploy or pilot AI tools for loss triage and fraud prevention, prompting the NAIC to form a Third-Party Data and Models Task Force in 2024[1]National Association of Insurance Commissioners, “Third-Party Data and Models Task Force,” naic.org. Real-time risk assessment compresses quote-to-bind cycles from weeks to minutes, sharpening underwriting precision. Commercial carriers seek “agentic” AI to cope with rising claim severity and talent shortages, targeting operational expense ratios below 25%. However, Colorado’s algorithmic-bias statute and similar bills increase compliance costs, favoring well-capitalized platforms able to audit model fairness. The United States insurtech market, therefore, rewards firms that can prove explainability while sustaining predictive accuracy.
Digital-First Consumer Purchasing
Mobile-optimised journeys now dictate insurer relevance: policyholders under 40 finalise 72% of new covers on smartphones. Telematics-driven auto policies price risk dynamically, making usage-based insurance attractive as vehicle premiums rise. Fleet operators integrate GPS diagnostics with carrier APIs to negotiate real-time premiums, pushing direct-to-consumer channels toward self-service experiences. Embedded checkout flows let retailers bundle parcel protection or travel cover in a single click, reducing acquisition costs by as much as 60%. These shifts elevate customer-experience metrics above price alone and reinforce direct digital strategies within the United States insurtech market.
Regulatory Sandbox & Open-API Mandates
Kentucky, Vermont, and West Virginia administer waivers that let innovators test products on up to 10,000 customers for limited periods. Simultaneously, the Centers for Medicare & Medicaid Services’ 2024 final rule compels Medicare Advantage and Medicaid carriers to publish Patient- and Provider-Access APIs, harmonizing data standards[2]Centers for Medicare & Medicaid Services, “CMS Interoperability and Prior Authorization Final Rule,” federalregister.gov. Such openness slashes integration timelines and broadens the addressable base for policy-as-code concepts. Yet a patchwork of state requirements forces multistate players to juggle disparate approval cycles, raising legal spend and slowing nationwide rollouts.
Embedded-Insurance via Open Banking
Open-banking integrations allow credit-card issuers and neobanks to embed micro-cover in checkout flows, elevating total addressable property-and-casualty premiums. One Inc’s partnership with U.S. Bank illustrates how payment gateways and real-time premium funding converge, improving claims disbursement speed. Chubb Studio’s more than 150 embedded alliances reach over 100 million users, showcasing the scale advantage of API-first architectures[3]Chubb, “Chubb Studio Embedded Insurance Platform,” chubb.com . Channel conflicts persist as agents resist disintermediation, but early adopters view embedded distribution as a means to broaden protection without layering additional sales friction.
Restraints Impact Analysis*
| Restraint | ( ~ ) % Impact on CAGR Forecast | Geographic Relevance | Impact Timeline |
|---|---|---|---|
| Data-privacy & cyber-breach risk | -1.4% | National, heightened scrutiny in California & New York | Short term (≤ 2 years) |
| Legacy-system integration costs | -1.1% | National, acute for established carriers | Medium term (2–4 years) |
| Actuarial data-science talent gap | -0.8% | National, centred in metro areas | Long term (≥ 4 years) |
| Scrutiny on algorithmic bias | -0.6% | State-specific, led by Colorado & California | Medium term (2–4 years) |
| Source: Mordor Intelligence | |||
Data-Privacy & Cyber-Breach Risk
The Change Healthcare intrusion compromising 100 million individuals underscores the vulnerability of interconnected claims workflows. Similar incidents at Globe Life’s customer portal prompted swift regulatory review under California’s Consumer Privacy Act, highlighting the possibility of multimillion-dollar fines. Heightened scrutiny obliges insurtechs to implement zero-trust architectures, multi-factor authentication, and annual penetration testing that can absorb up to 10% of operating expenditure. Investor sentiment remains positive toward cyber-resilience leaders, but valuation discounts emerge for platforms perceived as lagging on privacy assurance.
Legacy-System Integration Costs
Roughly three-quarters of large carriers still run policy and billing cores installed before 2010, complicating API orchestration. Modernization programs frequently exceed USD 200 million and stretch three-plus years, diluting near-term returns. Data migration obstacles and skills gaps prolong payback horizons; insurers unable to harmonize historical data see analytics benefits delayed. Consequently, enabler-model vendors flourish by delivering cloud microservices that interoperate with COBOL-based systems, providing a pragmatic bridge from legacy to digital.
*Our forecasts treat driver/restraint impacts as directional, not additive. The impact forecasts reflect baseline growth, mix effects, and variable interactions.
Segment Analysis
By Business Model: Carriers Drive Scale While Enablers Accelerate Innovation
Carrier platforms accounted for 45.12% of the United States insurtech market share in 2025, reflecting the enduring importance of capital strength and claims infrastructure. Enabler vendors, though smaller in absolute revenue, register the fastest progress with a 5.74% CAGR, suggesting that asset-light SaaS toolkits resonate with incumbents seeking rapid modernisation. The United States insurtech market size attributed to Enablers is projected to advance from roughly USD 14.4 billion today to more than USD 20.1 billion by 2031, as API orchestration, low-code product factories, and fraud analytics engines become plug-and-play essentials.
Strategic deals validate the trend: Munich Re entered full-stack operations by announcing a USD 2.6 billion purchase of Next Insurance in March 2025, while Travelers moved into cyber-specialty with its agreement to acquire Corvus. Such moves blur the carrier-enabler divide, shifting focus toward control of customer data and underwriting algorithms. Enablers leverage multi-tenant architecture to serve numerous carriers simultaneously, yielding superior marginal economics and positioning them as indispensable partners throughout the United States insurtech market.


By Insurance Line: Non-Life Dominance Reflects Digital Transformation Readiness
Non-Life products accounted for 71.65% of the U.S. insurtech market in 2025 and are projected to grow at a 6.34% CAGR through 2031, largely fueled by property-and-casualty offerings that leverage telematics, IoT-enabled devices, and parametric triggers for real-time claims automation. These technologies not only reduce fraud but also enable more precise risk pricing. As automation deepens, carriers are investing in API-driven distribution models that improve quote-to-bind times and enhance user experience. In contrast, life and annuity segments—though smaller in market share—are gaining traction through faster, tech-enabled underwriting and the rising appeal of instant-issue policies that resonate with digital-first consumers.
Product innovation is reshaping insurance architecture: parametric solutions for wildfires, hurricanes, and event cancellations now offer instant payouts once pre-agreed conditions are met, streamlining processes and easing pressure on claims teams. This model also supports faster capital recycling for insurers, enhancing overall operational agility. On the life side, insurers are piloting simplified underwriting for policies up to USD 3 million without requiring medical exams, lowering acquisition costs by double digits while meeting the preferences of younger, tech-savvy policyholders. Together, these trends are expanding insurability, broadening market access, and reinforcing long-term growth in the United States insurtech ecosystem.
By Distribution Channel: Direct Models Lead While Embedded Approaches Gain Momentum
Direct-to-Consumer sales maintained a 53.74% share of the United States insurtech market in 2025 as mobile quoting, instant payment, and digital claims continue to resonate with customers seeking convenience. API-driven funnels create frictionless onboarding and transparent pricing to differentiate carriers competing primarily on experience rather than solely on rate. Personalization tools, such as AI-powered recommendation engines, further enhance D2C channels by tailoring coverage to individual risk profiles. Additionally, digital self-service portals and chatbots have reduced service costs while increasing engagement, reinforcing customer preference for direct, tech-enabled interactions.
Embedded distribution, however, posts the fastest 5.52% CAGR, illustrating how insurance becomes an unobtrusive component of broader retail, travel, and lending journeys. Cross-selling potential is significant: grocery-delivery customers can activate parcel-protection cover, or ride-hail drivers can toggle on-demand auto policies from the same wallet application. Fintechs and e-commerce platforms are increasingly acting as insurance conduits, integrating products at natural decision points to improve conversion rates. As ecosystem partners prioritize seamless UX, the embedded route is poised to enlarge its imprint on the United States insurtech market by blending protection into everyday digital experiences.
Geography Analysis
The Northeast commands 42.86% of all United States insurtech market revenues, fuelled by dense fintech clusters in New York and Massachusetts and supportive regulatory frameworks such as New York’s Department of Financial Services cybersecurity rule. Venture-capital flows into Boston and New York doubled between 2022 and 2024, enabling early-stage proofs of concept that quickly migrate into production pilots with incumbent carriers. Rapid adoption of AI-enabled underwriting bolsters regional momentum, lifting forecast CAGR to an above-average 6.61%.
Although California garners more than one-quarter of the national deal count, its share of the United States insurtech market size remains lower than the Northeast due to a higher prevalence of early-stage firms with modest premium volumes. Nonetheless, Silicon Valley’s deep engineering talent and proximity to Big-Tech cloud providers sustain a pipeline of innovative risk-scoring, imagery-analysis, and blockchain pilots that often scale eastward. State privacy statutes such as the California Consumer Privacy Act shape product design and data-governance blueprints later adopted nationwide.
The South and Midwest collectively represent a growing opportunity pool. Kentucky’s innovation sandbox and Texas’ openness to managing-general-agency (MGA) formations encourage regional entrepreneurship. Clearcover’s launch of a non-standard auto MGA in Texas exemplifies the ability of digital challengers to address niche coverage gaps. Embedded insurance delivered through community banks and credit unions may further democratize access, enabling the United States insurtech market to penetrate rural segments historically underserved by traditional distribution.
Regulatory Landscape
United States insurtech regulation remains state-led, with the NAIC issuing model frameworks that many departments use to align expectations on cybersecurity, data governance, and AI oversight. NAIC Insurance Data Security Model Law (#668) continues to serve as a reference point for incident reporting and security programs, and in April 2026 the NAIC Innovation, Cybersecurity, and Technology (H) Committee advanced a secure centralized portal concept to streamline cybersecurity event notifications for states that have adopted the model law.
AI governance is moving from principles into examination practice. In January 2026, the NAIC initiated a multistate pilot of its AI Systems Evaluation Tool across 12 states to standardize how AI use is assessed during market conduct exams, while states such as Colorado increased prescriptiveness around automated decision-making with SB26-189 enacted in May 2026 (effective January 1, 2027). The change reinforces requirements for testing, documentation, and consumer-impact controls across underwriting and claims workflows.
Value Chain Analysis
The United States insurtech value chain typically begins with risk capacity and product manufacturing (carriers, MGAs, reinsurers), then processes data and decisioning inputs (first-party policy and claims data, telematics and IoT, third-party data and model vendors, plus fraud and identity tools). It is followed by core systems orchestration (policy administration, billing, claims, and API layers from enablers), and then distribution and servicing (D2C funnels, agents and brokers, affinity partners, and embedded platforms). Regulatory and compliance functions run across the chain, especially around cybersecurity notifications under NAIC model frameworks and AI governance tooling being piloted by NAIC across 12 states in 2026.
Operational bottlenecks tend to show up at distribution and underwriting handoffs, where quoting appetite, documentation, and integration with legacy cores can slow throughput. That shift has increased demand for API-first connectors, straight-through processing, and real-time eligibility indicators that reduce agent friction and speed quote-to-bind. At the same time, closer scrutiny of third-party data and model risk is tightening the vendor layer of the chain, raising the emphasis on auditability, model documentation, and security controls for insurtech enablers operating inside insurer workflows.
Competitive Landscape
Market structure balances fragmentation and consolidation: the five largest digital-first carriers account for slightly less than one-third of written premium, while hundreds of MGAs and software providers compete on specialised niches. Recent transactions underscore a scramble for scale and data ownership. Munich Re’s Next Insurance acquisition grants a reinsurer direct access to small-business underwriting pipelines, while Travelers’ bid for Corvus adds proprietary cyber-risk scoring tools to a mainstream carrier portfolio.
Profitability remains elusive for many direct-only brands, yet Root reported its first full-year net profit in 2024 by trimming marketing spend and refining telematics pricing. Lemonade narrowed quarterly losses as its customer count approached 2.5 million. Technology enablers such as Duck Creek and Guidewire continue to expand core platform footprints inside tier-1 insurers, bundling claims-AI, digital-billing, and low-code product-assembly modules. Competitive advantage is increasingly defined by explainable-AI documentation and Model Governance maturity, a requirement formalized by the NAIC bulletin adopted in 24 states.
White-space opportunities persist in cyber protection for small-and-medium enterprises, parametric agriculture coverage, and integrated health-payment ecosystems. Players able to combine actuarial depth with cloud-native microservices command premium valuations. Incumbents counter by forming venture-capital arms and sponsoring joint development agreements, positioning themselves to absorb or partner with innovators rather than cede ground within the United States insurtech market.
United States Insurtech Industry Leaders
Root Insurance
Lemonade
Hippo
Next Insurance
Oscar Health
- *Disclaimer: Major Players sorted in no particular order

Market Opportunities and Future Outlook
Opportunities center on areas where regulatory standardization and platform distribution reduce the friction involved in launching new products and operating models. The NAIC’s 2026 pilot of the AI Systems Evaluation Tool across 12 states lays out a more consistent compliance pathway for insurtechs providing model governance, testing, monitoring, and documentation capabilities for carriers facing intensified scrutiny on algorithmic decisions. Separately, the NAIC work on a centralized cybersecurity event notification portal, linked to Insurance Data Security Model Law (#668), supports vendors building incident-response workflows and reporting automation that can be deployed across multiple adopting states.
Distribution whitespace is most visible in embedded and partner-led channels that convert high-intent moments into bindable coverage at lower acquisition cost. Root’s embedded partnerships, including scaling through auto-commerce and app-based platforms, and Hippo’s carrier-to-platform relationships, point to a growing need for configurable quoting and policy issuance services. Consolidation and portfolio moves by distributors, including Matic’s June 2026 acquisition of Policygenius’ property and casualty portfolio alongside a new minority investment, also suggest sustained buyer interest in scaled books and technology-enabled servicing. This supports growth avenues for enablers focused on lead routing, quote orchestration, and post-bind customer servicing automation.
Recent Industry Developments
- July 2026: Root Insurance partnered with Jerry to embed an end-to-end car insurance experience into the Jerry platform. The integration expands Root’s distribution reach through an affinity-style digital channel and reinforces embedded flows as a key go-to-market route for D2C auto carriers.
- July 2025: Lemonade launched car insurance in Indiana as part of its United States product expansion. The move broadened Lemonade’s state footprint in auto and supported cross-sell potential inside its digital-first acquisition and servicing model.
- October 2024: Hippo expanded its New Homes Program to California, Florida, and Texas. Extending builder-linked distribution in three large housing markets strengthened Hippo’s position in tech-enabled homeowners insurance origination at the point of purchase.


Research Methodology Framework and Report Scope
Market Definition and Coverage
For this study, the market is defined as the value of insurance activity in the United States that is created, distributed, or administered using insurtech capabilities, including digital-first products and technology-enabled workflows used by carriers, distributors, and enabling platforms.
Scope exclusions: We exclude pure IT outsourcing and general consulting spend that is not directly tied to producing, selling, underwriting, servicing, or managing insurance products.
Segmentation Overview
- By Business Model
- Carrier
- Enabler
- Distributor
- By Insurance Line
- Life
- Non-Life
- By Distribution Channel
- Direct to Consumer
- Intermediate
- Embedded
- By Geography
- South
- West
- Midwest
- NorthEast
Data Sources, Market Sizing, and Validation
Desk Research
Desk work started by mapping how insurance premiums, underwriting activity, and distribution are reported in public data so the market definition stays consistent year to year. We referenced sources such as NAIC publications, U.S. Census Bureau datasets, Bureau of Labor Statistics series, Federal Reserve releases, and SEC filings for insurers and brokers, which helped anchor the scale of the underlying insurance pool.
After that, we used company annual reports, investor decks, earnings call transcripts, association websites, and reputed business press to understand where technology is changing purchase and servicing behaviors in the U.S. market. In a few steps, paid subscriptions for company financials and intelligence, patent databases, and news and financials were used to speed up cross-checks on funding cycles, product launches, and M&A timing. These examples are not exhaustive, and many other public sources were also used to collect data, validate assumptions, and clarify open questions.
Primary Interviews and Surveys
Primary work focused on interviews and structured surveys with insurance executives, distribution leaders, product owners, and operations managers across life and non-life lines in the United States. We used these discussions to confirm how much sales flow through direct-to-consumer, intermediated, and embedded paths, and then to pressure-test adoption assumptions around digital onboarding, underwriting automation, and claims servicing. When desk signals conflicted, we revisited respondents to align definitions and tighten the final inputs so the model reflects real buying and operating practices in insured markets.
Distribution of primary research fieldwork respondents
| Company type | Respondent position | Region |
|---|---|---|
| Top tier: 29% | CXOs: 13% | |
| Mid tier: 57% | Functional/Unit leaders: 33% | |
| Smaller Players: 14% | Managers: 54% |
Market-Sizing & Forecasting
Sizing was built using a top-down and bottom-up approach, where the top-down path reconstructs an insurtech-enabled insurance value pool from U.S. insurance activity and then applies measured adoption shares for digital creation, distribution, and administration. To keep the totals grounded, we corroborated results with selective bottom-up approximations such as sampled premium volumes by business model, channel-level checks on direct, intermediated, and embedded flows, and sanity checks using observed scaling patterns from public financial disclosures.
Key inputs used to shape the model include insurance premium growth trends, channel mix shifts (direct-to-consumer versus intermediate versus embedded), digital underwriting and straight-through processing penetration, claims automation and self-service adoption, and pricing movement tied to line-specific loss cost pressures. Because adoption and pricing do not move in a straight line, scenario analysis was applied for forecasts, with inputs adjusted based on expert views on regulation, data-sharing via APIs, and the pace of carrier modernization. Where bottom-up coverage was thin for smaller entities, gaps were handled through ratio-based extrapolation from comparable cohorts and then rechecked against the total demand pool.
Data Validation & Update Cycle
Validation was handled through multiple checks, including comparing model outputs against independent signals like premium growth, channel shares, and disclosed digital program performance, followed by variance reviews when results looked out of line with observed market behavior. If an outlier was found, the underlying driver was traced back to the assumption level and, when needed, respondents were re-contacted to confirm whether the shift was real or definition related.
Before sign-off, the model and narrative go through stepwise analyst reviews so calculation logic, units, and year mapping stay consistent. Reports are refreshed annually, and interim updates are triggered when material events occur such as regulation changes, major product rollouts, or high-impact M&A. Before delivery, a fresh pass is completed so clients receive the latest updated view in the U.S. context.
Mordor Intelligence's United States Insurtech Market Size Compared With Other Published Estimates
Published market sizes for United States insurtech can vary widely because groups often define the market differently and then apply different adoption and pricing assumptions to convert activity into dollars. Differences in what is counted as insurtech-enabled insurance, the years used, and the speed of assumed growth typically explain most of the spread.
One common gap driver is whether the estimate is tied to insurance value pools and channel flows, or whether it is closer to vendor and platform revenues, which can be much smaller. Another driver is how embedded distribution and intermediary channels are treated, plus whether aggressive growth scenarios are assumed without rechecking against premium trends and operational adoption signals, which can inflate forward values.
Benchmark comparison
| Source | Market Size | Gaps in Research Methodology |
|---|---|---|
| Mordor Intelligence | USD 310.2 B (2025) | |
| Industry Research Publisher A | USD 51.27 B (2025) | This figure appears closer to insurtech company and platform revenue pools, which can exclude the larger insurance value affected by tech-enabled distribution, underwriting, and servicing, thereby producing a smaller total. |
| Global Publisher B | USD 343.52 B (2026) | The estimate uses a different base year and can reflect a broader treatment of insurtech activity across the insurance value chain, where timing of currency conversion and faster assumed ramp in embedded insurance lift the near-term total. |
The table shows that most variance comes from what the dollars represent and the year the value is anchored to, not from simple math differences. By tying the sizing to U.S. insurance activity and then filtering it through channel mix and adoption checks, a stable definition is maintained, a modeling choice applied by Mordor Intelligence.


Key Questions Answered in the Report
How large is the United States insurtech market in 2026?
The United States insurtech market is valued at USD 327.17 billion in 2026 and is on track to reach USD 426.96 billion by 2031.
Which business model is growing fastest in the United States insurtech industry
Enabler-model vendors, which sell API-driven technology to incumbent carriers, are expanding at a 5.74% CAGR, outpacing both full-stack carriers and distribution-only models.
Why is the Northeast region so dominant?
The Northeast commands 42.86% revenue share because of dense fintech clusters, strong venture funding, and progressive regulatory frameworks that accelerate product pilots.
What are the top restraints on United States insurtech market growth?
Heightened cybersecurity risks and high legacy-system integration costs together subtract roughly 2.5 percentage points from potential CAGR.
Page last updated on:






