Market Overview
| Study Period | 2021 - 2031 |
|---|---|
| Base Year For Estimation | 2025 |
| Forecast Data Period | 2026 - 2031 |
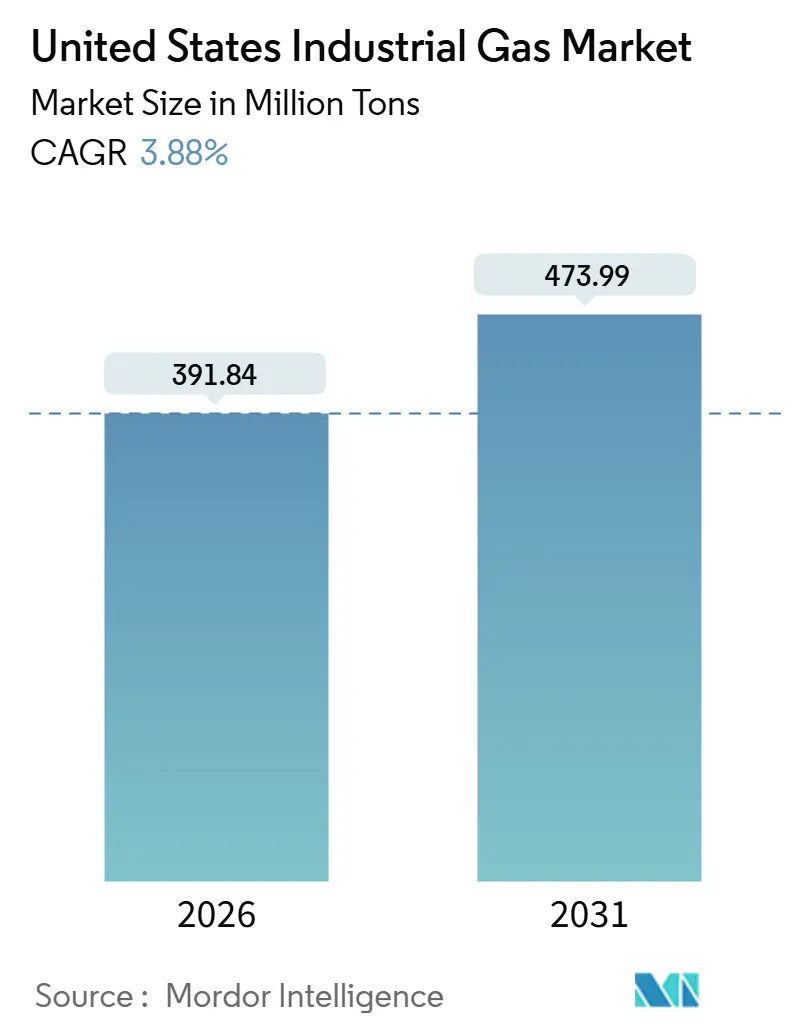
| Market Volume (2026) | 391.84 Million tons |
| Market Volume (2031) | 473.99 Million tons |
| Growth Rate (2026 - 2031) | 3.88% CAGR |
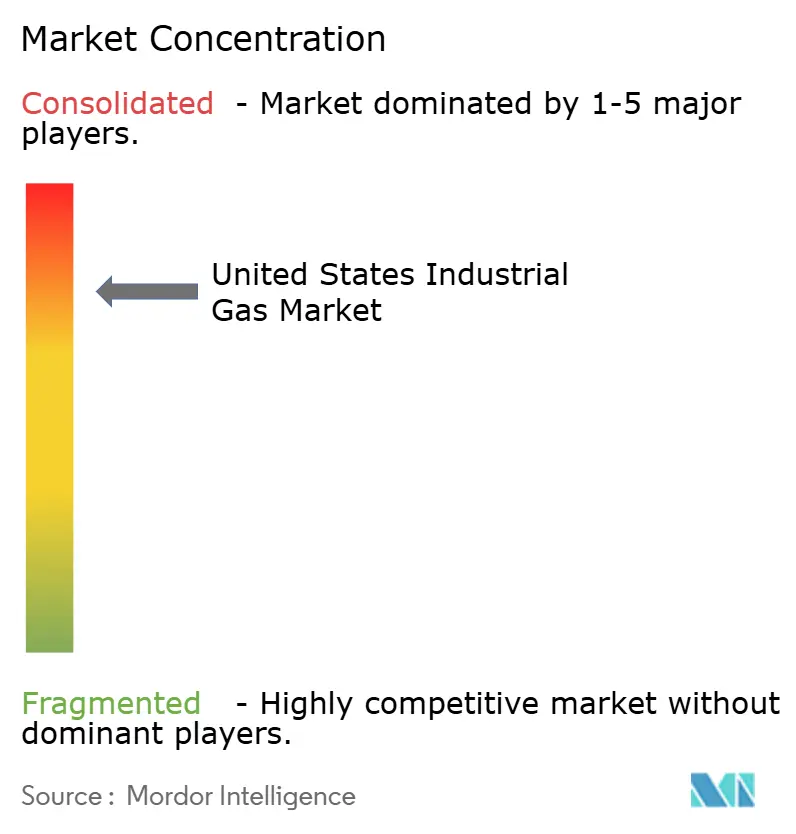
| Market Concentration | High |
Major Players *Disclaimer: Major Players sorted in no particular order Image © Mordor Intelligence. Reuse requires attribution under CC BY 4.0. | |
United States Industrial Gas Market Analysis by Mordor Intelligence
The United States Industrial Gas Market size is estimated at 391.84 million tons in 2026, and is expected to reach 473.99 million tons by 2031, at a CAGR of 3.88% during the forecast period (2026-2031). Anchored by long-term, on-site supply contracts for semiconductor fabs and refineries, the United States industrial gas market is shifting toward high-purity nitrogen, oxygen, and hydrogen streams that command premium pricing. Clean-energy policies, notably the Inflation Reduction Act’s 45V incentive, are accelerating electrolysis projects even though their levelized costs remain two to three times above conventional production. Meanwhile, regional power-price inflation since 2024 is encouraging refiners and chemical plants to secure cost-plus agreements that hedge electricity risk. Consolidation among large suppliers continues, but nimble regional distributors are gaining ground by tailoring cylinder-rental and just-in-time delivery models to specialty-chemical and pharmaceutical customers.
Key Report Takeaways
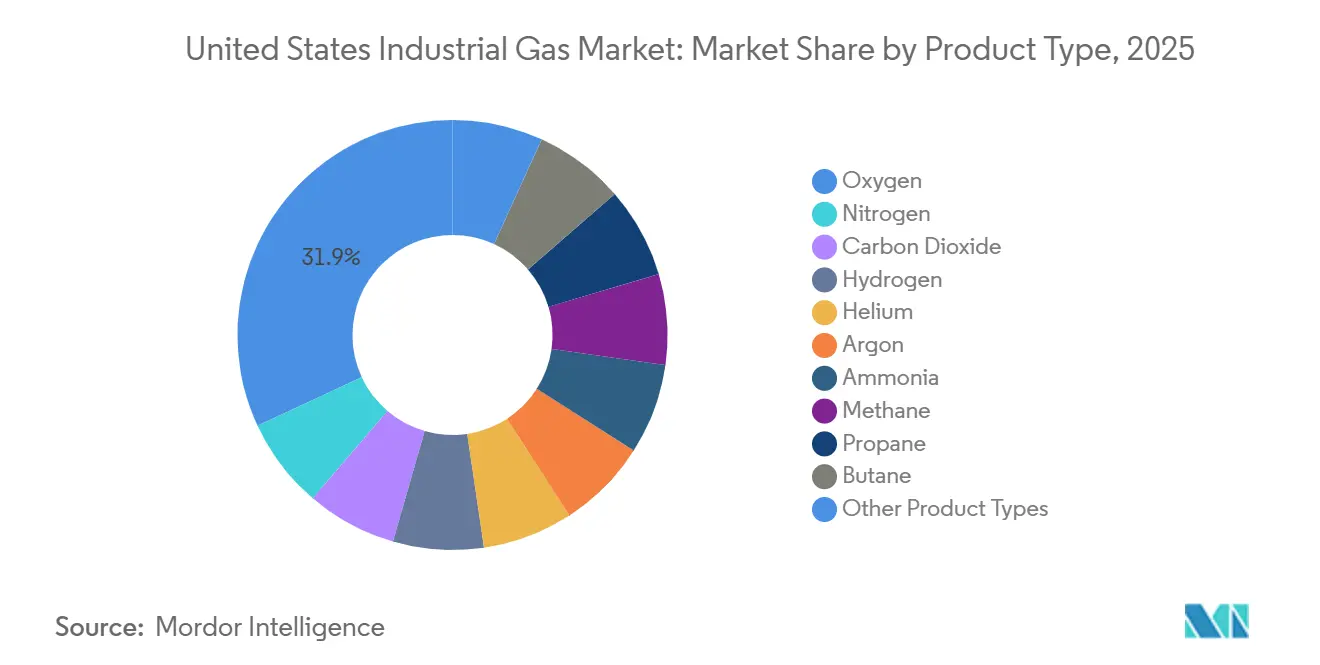
- By product type, oxygen captured 31.94% of the United States industrial gas market share in 2025, while nitrogen is forecast to expand at a 4.68% CAGR through 2031.
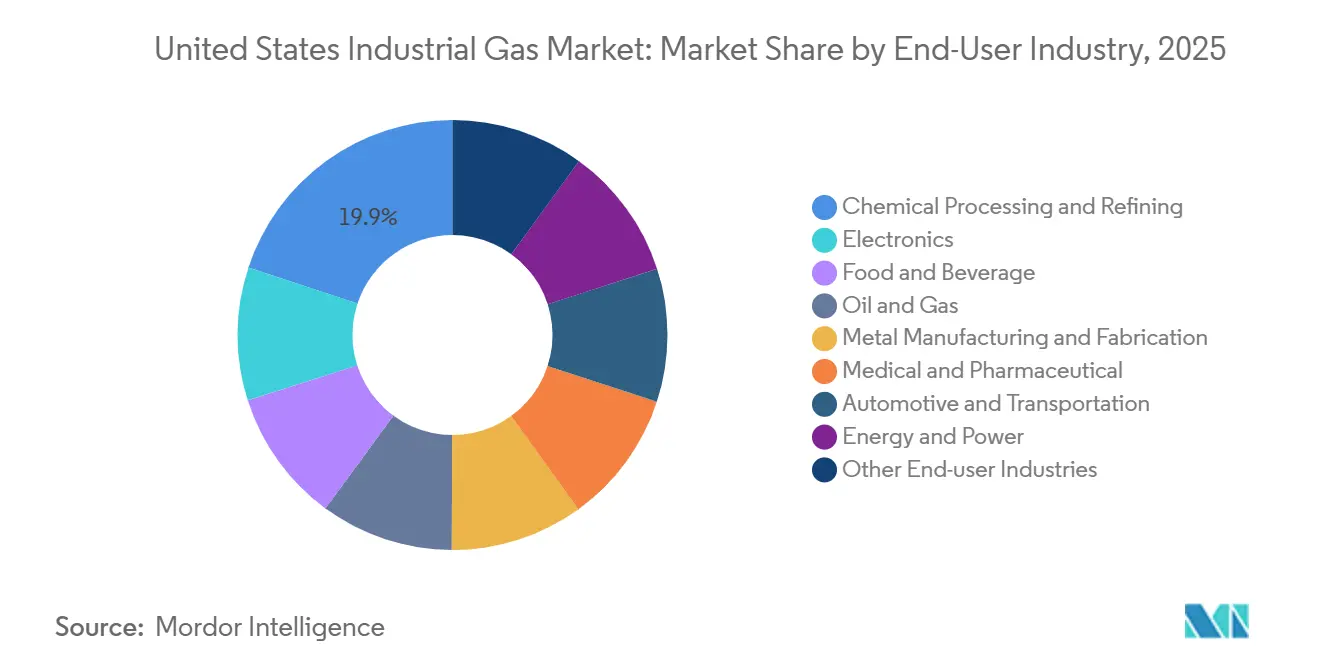
- By end-user industry, chemical processing and refining accounted for 19.91% of the United States industrial gas market size in 2025, whereas food and beverage is projected to post the highest growth at a 5.24% CAGR to 2031.
Note: Market size and forecast figures in this report are generated using Mordor Intelligence’s proprietary estimation framework, updated with the latest available data and insights as of January 2026.
United States Industrial Gas Market Trends and Insights
Drivers Impact Analysis
| Drivers | (~) % Impact on CAGR Forecast | Geographic Relevance | Impact Timeline |
|---|---|---|---|
| Increasing demand from the healthcare sector | +0.6% | National, with concentrations in metropolitan hospital networks and rural telehealth hubs | Short term (≤ 2 years) |
| Rising demand for frozen and packaged food applications | +0.9% | National, strongest in Midwest processing clusters and West Coast cold-storage distribution centers | Medium term (2-4 years) |
| Growing need for low-carbon hydrogen in energy transition | +1.2% | Gulf Coast refining corridor, Midwest ammonia belt, California zero-emission-vehicle mandates | Long term (≥ 4 years) |
| Expansion of semiconductor fabs requiring ultra-high-purity specialty gases | +0.8% | Arizona, Texas, Ohio, New York—states receiving CHIPS Act funding | Medium term (2-4 years) |
| Growth in low-carbon ammonia and sustainable aviation-fuel production | +0.5% | Gulf Coast (Texas, Louisiana), California SAF mandates, Midwest ammonia production hubs | Long term (≥ 4 years) |
| Source: Mordor Intelligence | |||
Increasing Demand from the Healthcare Sector
Medical oxygen volumes surged during the pandemic and have remained structurally higher as hospitals sustained expanded intensive-care capacity and home-oxygen programs. The FDA's current good manufacturing practice rules under 21 CFR Part 211 impose batch-record documentation, purity testing, and validated filling procedures, adding to production cost compared with industrial-grade oxygen[1]U.S. Food and Drug Administration, “Current Good Manufacturing Practice Regulations,” fda.gov. Pharmaceutical manufacturers are boosting ultra-high-purity nitrogen use for biologics cleanrooms, where oxygen levels must stay below 1 ppm to prevent oxidative degradation. Telehealth expansion in rural regions is lifting demand for portable concentrators, a niche that regional distributors such as Holston Gases and nexAir serve through subscription models. These dynamics combine to keep the United States industrial gas market firmly oriented toward medical-grade reliability and traceability.
Rising Demand for Frozen and Packaged Food Applications
Liquid-nitrogen tunnels reaching –196 °C are displacing mechanical blast freezers because they lock in product moisture within seconds, cutting drip loss and preserving texture. Modified-atmosphere packaging that replaces oxygen with nitrogen or carbon dioxide slows microbial growth, enabling fresh-cut produce to travel up to 10 days without preservatives. USDA cold-chain modernization grants issued in 2024 subsidized nitrogen-injection systems for regional meat-packing and dairy plants, accelerating adoption by mid-size processors[2]U.S. Department of Agriculture, “Cold Chain Modernization Grants,” usda.gov. Carbon-dioxide demand is climbing in parallel for beverage carbonation and dry-ice logistics; Air Liquide’s 2024 Tennessee air-separation investment pairs a CO₂ liquefaction train with regional food processing supply. These factors underpin the fast-growing food segment within the United States industrial gas market.
Growing Need for Low-Carbon Hydrogen in Energy Transition
By 2030, the DOE's Hydrogen Shot aims to produce clean hydrogen annually, targeting decarbonization in refining, ammonia production, and steel manufacturing. Electrolytic hydrogen costs are reduced for projects with lifecycle emissions below a specific threshold due to 45V tax credits. Linde's blue-hydrogen plant in Texas, commissioned in 2025, captures a significant portion of its CO₂ emissions and has secured a long-term supply contract with OCI's ammonia facility. In a significant move, Air Products and AES are collaborating on a green-hydrogen hub powered by renewable energy, set to eliminate Scope 1 and 2 emissions. These initiatives underscore a bullish trajectory for hydrogen's role in the United States industrial gas market.
Expansion of Semiconductor Fabs Requiring Ultra-High-Purity Specialty Gases
CHIPS Act incentives have triggered a wave of United States industrial gas market demand from fabs in Arizona, Texas, Ohio, and New York. TSMC’s Phoenix complex needs nitrogen with less than 1 ppb oxygen and moisture; volumes secured by an Air Liquide on-site system guaranteeing 99.9999% purity. SEMI estimates each advanced fab uses nitrogen, plus argon and hydrogen for plasma etching and annealing. Long-term supply contracts reduce merchant spot exposure and deepen capital requirements, reinforcing consolidation trends.
Restraints Impact Analysis
| Restraints | (~) % Impact on CAGR Forecast | Geographic Relevance | Impact Timeline |
|---|---|---|---|
| Stringent environmental and safety regulations raising compliance costs | -0.3% | National, with stricter enforcement in California, New York, and states adopting CARB-equivalent standards | Long term (≥ 4 years) |
| Persistent helium supply volatility and price spikes | -0.4% | National, with acute impact on MRI-equipped hospitals, aerospace testing labs, and fiber-optic manufacturing | Medium term (2-4 years) |
| Energy-intensive ASUs exposed to electricity price inflation | -0.5% | Gulf Coast (Texas, Louisiana), Midwest industrial corridors, regions with volatile energy markets | Medium term (2-4 years) |
| Source: Mordor Intelligence | |||
Persistent Helium Supply Volatility and Price Spikes
In 2024, the closure of the Cliffside Field reserve removed a crucial buffer that had ensured the stability of the domestic helium supply for half a century. While Messer's acquisition of the Federal Helium System introduced a layer of private oversight, helium spot prices experienced notable fluctuations compared to the previous year. To mitigate helium consumption, hospitals operating MRI scanners are investing in closed-loop helium recovery systems. Meanwhile, while aerospace and fiber-optic manufacturers have explored hydrogen and neon as potential substitutes, technical trade-offs have hindered widespread adoption. This price volatility is dampening the growth momentum of the United States industrial gas market.
Stringent Environmental and Safety Regulations Raising Compliance Costs
Producers face annual costs due to EPA greenhouse-gas reporting mandates under 40 CFR Part 98. These regulations require the installation of emissions instrumentation and third-party verification. Distributors incur yearly compliance costs as mandated by DOT cylinder testing under 49 CFR Part 180. This requires hydrostatic or ultrasonic inspections every five to ten years. In California, a proposed extension of cap-and-trade to Scope 3 emissions could push oxygen users to purchase allowances. This move may steer buyers towards carbon-neutral products. Such regulatory burdens disproportionately impact smaller distributors, fueling consolidation in the United States industrial gas market.
Segment Analysis
By Product Type: Nitrogen Outpaces Oxygen in Growth Velocity
Nitrogen is forecast to grow at 4.68% annually, the quickest pace among product types, while oxygen retained 31.94% of the United States industrial gas market share in 2025. Rising semiconductor demand for nitrogen per fab and food processors’ adoption of cryogenic freezing underpin nitrogen’s trajectory.
The United States industrial gas market size for carbon dioxide is expanding as beverage carbonation and CCUS projects scale, illustrated by Messer’s 2025 investment with LSB Industries in Alabama. Hydrogen volumes are climbing as Gulf Coast refiners pivot to low-carbon pathways qualified for 45V and 45Q incentives. Helium remains constrained, supporting premium pricing. Argon’s outlook is tied to welding demand in lightweight-vehicle manufacturing, while ammonia, methane, propane, and butane retain specialized roles in refrigeration, feedstocks, and metal-fabrication heating.
Note: Segment shares of all individual segments available upon report purchase
Get Detailed Market Forecasts at the Most Granular Levels
Download PDF
By End-User Industry: Food and Beverage Leads Growth Trajectory
Chemical processing and refining held 19.91% volume share in 2025, anchored by hydrogen and oxygen integration, yet food and beverage is projected to record a 5.24% CAGR—the fastest among industries—through expanded cryogenic nitrogen tunnels and modified-atmosphere packaging supported by USDA grants.
Electronics consumption is surging as fabs in Arizona, Ohio, and Texas sign multi-decade, ultra-high-purity contracts, underscoring a structural shift in the United States industrial gas market size toward specialty gases. Medical and pharmaceutical users maintain elevated oxygen inventories and draw more high-purity nitrogen for biologics storage, while metal fabrication, oil and gas, automotive, and power applications round out diversified demand. Compliance costs and sustainability targets are nudging buyers toward suppliers offering certified low-carbon or carbon-negative gases, sharpening competitive differentiation.
Note: Segment shares of all individual segments available upon report purchase
Get Detailed Market Forecasts at the Most Granular Levels
Download PDF
Geography Analysis
The Gulf Coast holds the largest share of the United States industrial gas market, driven by refinery hydrogen demand and on-site oxygen supply, exemplified by Air Liquide’s Baytown project and Linde’s blue-hydrogen plant. Favorable tax abatements and streamlined permits in Texas and Louisiana continue to attract capital.
Arizona and Texas are emerging semiconductor hubs under the CHIPS Act, each anchoring dedicated ultra-high-purity supply chains, while the Midwest manufacturing belt is revitalizing through battery and chip investments that embed new air-separation capacity. California’s cap-and-trade expansion and zero-emission regulations stimulate hydrogen infrastructure but also highlight subsidy risk, demonstrated by Air Products’ 2025 project exit.
The Northeast blends pharmaceutical, specialty chemical, and hospital demand, reinforcing diversity across oxygen, nitrogen, and calibration gases. The Southeast benefits from EV-battery investments such as LG Chem’s Tennessee cathode plant, supplied by Air Liquide’s 2024 air-separation unit. Mountain West and Pacific Northwest markets, though smaller, are growing through food processing, data centers, and renewable-energy storage, extending the geographic footprint of the United States industrial gas market.
Competitive Landscape
The United States industrial gas market is moderately consolidated in nature. Regional independents are winning share with flexible cylinder programs, digital inventory sensors, and rapid delivery tailored to specialty-chemical and biotech users. Messer’s acquisition of the Federal Helium System consolidates helium logistics and positions the firm to offer longer-term price stability. Technology adoption is accelerating in on-site nitrogen systems, cutting customer costs and nudging distributors toward higher-margin specialty blends and purity certifications, further shaping competitive dynamics in the United States industrial gas market.
United States Industrial Gas Industry Leaders
Linde PLC
Air Products and Chemicals Inc.
Air Liquide
Messer North America, Inc.
Matheson Tri-Gas Inc.
- *Disclaimer: Major Players sorted in no particular order
Need More Details on Market Players and Competitors?
Download PDF
Recent Industry Developments
- October 2025: Air Liquide announced a USD 50 million expansion of Gulf Coast hydrogen compression and storage capacity, targeting refiners switching to low-carbon feedstocks.
- February 2025: Air Products recorded a USD 3.1 billion write-down on three United States projects lacking firm offtake, while commissioning a contracted air-separation unit in Ohio.
United States Industrial Gas Market Report Scope
Industrial gases are gases produced in relatively large quantities by gas manufacturing companies for use in a variety of industrial manufacturing processes. These gases are sold to other enterprises and industries, including oil and gas, petrochemicals, chemicals, power, mining, steelmaking, metals, environmental protection, medicine, pharmaceuticals, biotechnology, food, water, fertilizers, nuclear power, electronics, etc.
The United States industrial gas market is segmented by product type and end-user industry. By product type, the market is segmented into nitrogen, oxygen, carbon dioxide, hydrogen, helium, argon, ammonia, methane, propane, butane, and other types. The end-user industry segments the market into chemical processing and refining, electronics, food and beverage, oil and gas, metal manufacturing and fabrication, medical and pharmaceutical, automotive and transportation, energy and power, and other end-user industries. For each segment, the market sizing and forecasts have been done on the basis of volume (Tons).
By Product Type
| Nitrogen |
| Oxygen |
| Carbon Dioxide |
| Hydrogen |
| Helium |
| Argon |
| Ammonia |
| Methane |
| Propane |
| Butane |
| Other Product Types |
By End-User Industry
| Chemical Processing and Refining |
| Electronics |
| Food and Beverage |
| Oil and Gas |
| Metal Manufacturing and Fabrication |
| Medical and Pharmaceutical |
| Automotive and Transportation |
| Energy and Power |
| Other End-user Industries |
| By Product Type | Nitrogen |
| Oxygen | |
| Carbon Dioxide | |
| Hydrogen | |
| Helium | |
| Argon | |
| Ammonia | |
| Methane | |
| Propane | |
| Butane | |
| Other Product Types | |
| By End-User Industry | Chemical Processing and Refining |
| Electronics | |
| Food and Beverage | |
| Oil and Gas | |
| Metal Manufacturing and Fabrication | |
| Medical and Pharmaceutical | |
| Automotive and Transportation | |
| Energy and Power | |
| Other End-user Industries |
Need A Different Region or Segment?
Customize Now
Key Questions Answered in the Report
What is the projected volume of the United States industrial gas market by 2031?
The market is expected to reach 473.99 million tons by 2031, growing at a 3.88% CAGR from 391.84 million tons in 2026.
Which product type is forecast to grow fastest in the United States industrial gas market?
Nitrogen is projected to post the highest growth, advancing at a 4.68% CAGR through 2031 due to semiconductor and food-processing demand.
Why are food processors adopting cryogenic nitrogen systems?
Liquid-nitrogen tunnels freeze products almost instantly, preserving moisture and texture while allowing longer shelf life without preservatives.
How are smaller distributors competing with large gas majors?
Regional firms leverage flexible cylinder-rental terms, digital inventory monitoring, and rapid delivery to serve specialty-chemical and biotech customers.


