
Market Overview
| Study Period | 2021 - 2031 |
|---|---|
| Base Year Market Size (2025) | USD 1.50 Trillion |
| Market Size (2026) | USD 1.61 Trillion |
| Market Size (2031) | USD 2.29 Trillion |
| Growth Rate (2026 - 2031) | 7.31% CAGR |
| Fastest Growing Market | Asia Pacific |
| Largest Market | North America |
Major Players *Disclaimer: Major Players sorted in no particular order Image © Mordor Intelligence. Reuse requires attribution under CC BY 4.0. | |
United States ICT Market Analysis by Mordor Intelligence
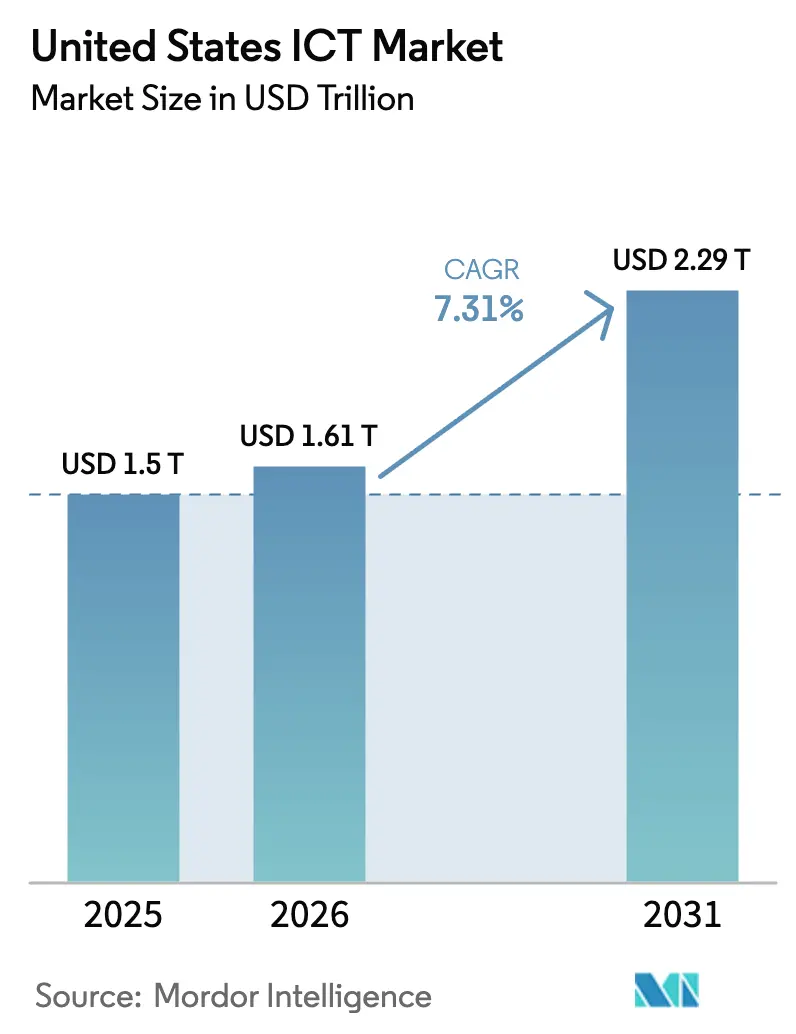
United States ICT market size in 2026 is estimated at USD 1.61 trillion, growing from 2025 value of USD 1.50 trillion with 2031 projections showing USD 2.29 trillion, growing at 7.31% CAGR over 2026-2031. Robust federal spending on broadband, accelerating investments in hyperscale data centers, and steady enterprise migration toward hybrid multi-cloud models collectively underpin this upward trajectory. Spending momentum is reinforced by the USD 42.45 billion Broadband Equity Access and Deployment (BEAD) program, which is widening high-speed connectivity in rural regions and stimulating follow-on demand for network equipment and managed services [1]National Telecommunications and Information Administration, “With All Funds Obligated, NTIA Takes Additional Steps to Accelerate BEAD Construction,” ntia.gov. Simultaneously, hyperscale operators are channeling more than USD 158 billion annually into secondary metros to overcome power constraints in coastal corridors, reshaping regional technology footprints. Rapid fixed-wireless adoption—now responsible for 40% of new home broadband additions has also altered last-mile economics, allowing cloud vendors to extend reach into previously underserved communities. Together, these structural shifts have begun to transition market growth from an infrastructure-led phase toward application-driven expansion focused on AI workload enablement and energy-efficient capacity planning.
Key Report Takeaways
- By type, IT Services led with 37.65% of the United States ICT market share in 2025, while IT Security is projected to expand at an 10.85% CAGR through 2031.
- By enterprise size, Large Enterprises commanded 62.45% revenue share in 2025, whereas Small and Medium Enterprises are forecast to grow at a 9.62% CAGR over 2026-2031.
- By industry vertical, BFSI retained 21.78% share of the United States ICT market size in 2025; Manufacturing is advancing at an 11.12% CAGR through 2031.
- By deployment model, Cloud captured 53.85% of spending in 2025, yet Hybrid architectures are the fastest-growing, posting a 13.02% CAGR for 2026-2031.
- By geography, secondary metros in Texas, Virginia, North Carolina, and Arizona attracted USD 158 billion of hyperscale data-center capital in 2024, signaling a pronounced shift away from traditional coastal hubs.
Note: Market size and forecast figures in this report are generated using Mordor Intelligence’s proprietary estimation framework, updated with the latest available data and insights as of 2026.
United States ICT Market Trends and Insights
Drivers Impact Analysis*
| Driver | % Impact on CAGR Forecast | Geographic Relevance | Impact Timeline |
|---|---|---|---|
| Accelerated federal & state broadband funding | +1.2% | National, with concentrated gains in rural and underserved areas | Medium term (2-4 years) |
| Rapid 5G network roll-out | +0.9% | National, with early leadership in metropolitan areas | Short term (≤ 2 years) |
| Enterprise migration to hybrid multi-cloud | +1.1% | National, with higher adoption in financial and technology sectors | Medium term (2-4 years) |
| Edge-computing demand from Industry 4.0 | +0.8% | Manufacturing corridors in Midwest and Southeast regions | Long term (≥ 4 years) |
| Hyperscale data-center expansion in secondary U.S. metros | +1.3% | Secondary markets in Texas, Virginia, North Carolina, and Arizona | Medium term (2-4 years) |
| Surge in AI/ML GPU server spending | +1.5% | Technology hubs with concentrated cloud provider presence | Short term (≤ 2 years) |
| Source: Mordor Intelligence | |||
Accelerated Federal and State Broadband Funding
The USD 42.45 billion BEAD program marks the largest broadband investment in U.S. history, with all 56 states and territories now approved for allocations [2]National Telecommunications and Information Administration, “BEAD Progress Dashboard,” ntia.gov. Funding prioritizes fiber builds that guarantee minimum 100/20 Mbps service, immediately expanding the addressable base for SaaS vendors and managed service providers. States such as California and Texas have layered additional USD 13 billion and USD 5.4 billion, respectively, onto federal grants, catalyzing regional technology corridors [GOVTECH.COM]. Private ISPs and hyperscalers are leveraging these public funds to extend backbone routes and edge nodes, creating multiplier effects across professional services, maintenance contracts, and cloud on-ramps. The program’s affordability provisions for low-income households secure long-run utilization of newly built networks, translating connectivity gains into sustainable revenue streams.
Rapid 5G Network Roll-Out
Enterprise 5G connections climbed to 176 million in Q3 2024, representing 47% population coverage as fixed-wireless access (FWA) accounted for 40% of new home broadband additions. Beyond speed improvements, private 5G enables manufacturing automation, remote healthcare monitoring, and smart-logistics applications that generate recurring integrator revenue. CBRS spectrum rules have seeded diverse deployments from automotive plants to NFL stadiums highlighting 5G versatility. Economic modeling suggests the technology could unlock USD 251.2 billion in GDP for the ICT domain by 2025. As AI workloads migrate closer to users, 5G’s low-latency pathways form the backbone for edge-computing rollouts, ensuring that latency-sensitive inference tasks operate at near-real-time speeds.
Enterprise Migration to Hybrid Multi-Cloud
Federal agencies reduced on-premises reliance from 27% to 5% within three years, epitomizing broader shifts toward diversified cloud portfolios to mitigate ransomware risk and regulatory exposure [3]Nutanix, “The U.S. Federal Government's Great Migration to a Diverse Hybrid Multicloud IT Landscape,” nutanix.com . Similar patterns across Fortune 1000 firms fueled Microsoft Cloud revenue to USD 137.7 billion in fiscal 2024, with AWS reaching USD 107.6 billion. Hybrid adoption rests on balancing cost, data sovereignty, and performance through workload placement flexibility. Integration specialists and cloud-management platforms benefit as enterprises demand unified monitoring, governance, and security across disperse estates. The trend also intensifies demand for colocation edge nodes that pair cloud agility with on-premises control, particularly for regulated industries.
Edge-Computing Demand from Industry 4.0
Manufacturers are layering IoT sensors, vision analytics, and autonomous vehicles onto production lines, driving compute closer to machines to achieve millisecond-scale decision loops. Private 5G deployments at facilities such as BMW’s Spartanburg plant showcase secure, high-bandwidth connectivity for mission-critical operations. Edge devices now integrate on-device AI inference, heightening demand for GPU-rich micro-data centers optimized for energy efficiency. Cybersecurity requirements escalate as perimeter-based defenses prove insufficient against distributed assets, amplifying spend on zero-trust and OT-specific security frameworks. Over the long term, converged edge-plus-cloud strategies are expected to underpin predictive maintenance and digital-twin rollouts across U.S. industrial corridors.
Restraints Impact Analysis*
| Restraint | % Impact on CAGR Forecast | Geographic Relevance | Impact Timeline |
|---|---|---|---|
| Cyber-security talent shortage | -0.7% | National, with acute shortages in technology and financial centers | Long term (≥ 4 years) |
| Advanced-node semiconductor supply constraints | -0.5% | National, with particular impact on AI and high-performance computing sectors | Medium term (2-4 years) |
| Patchwork state-level data-privacy legislation | -0.3% | State-specific, with California, Virginia, and Texas leading regulatory complexity | Medium term (2-4 years) |
| Rising energy costs & sustainability pressure on data centers | -0.6% | Regional, with highest impact in PJM and California markets | Long term (≥ 4 years) |
| Source: Mordor Intelligence | |||
Cyber-Security Talent Shortage
Roughly 448,000 cybersecurity vacancies persist, curbing the pace of digital projects as enterprises struggle to secure expanded attack surfaces [4]World Economic Forum, “Strategic Cybersecurity Talent Framework 2024,” weforum.org. Shortfalls in cloud-security architecture, AI/ML defense, and OT protection delay cloud migrations and IoT scale-outs. While degree completions in cyber fields grew 271% over the past decade, supply still trails demand. Wage inflation favors large enterprises and public agencies, leaving SMEs exposed to skilled-labor bidding wars. Diversity gaps—Hispanic and Latino professionals remain underrepresented—further shrink the available pool, compelling firms to invest in reskilling, automation, and managed-security partnerships that offset human-capital constraints.
Rising Energy Costs and Sustainability Pressure on Data Centers
Data-center power draw is projected to climb from 4.4% of U.S. electricity in 2023 to as high as 12% by 2030. Average retail electricity prices rose from 16.41 cents to 17.47 cents per kWh between May 2024 and May 2025, with data centers identified as a major driver. PJM capacity prices jumped nearly tenfold, adding USD 9.3 billion in consumer costs, as hyperscale build-outs strained grid reserves. Utilities in Virginia forecast rate increases of USD 14-37 per month for households by 2040, intensifying public scrutiny. To blunt cost and emission headwinds, hyperscalers ink gigawatt-scale renewable PPAs and experiment with immersion cooling and on-site small-modular reactors, but near-term margin compression remains a sector-wide challenge.
*Our forecasts treat driver/restraint impacts as directional, not additive. The impact forecasts reflect baseline growth, mix effects, and variable interactions.
Segment Analysis
By Type: Services Sustain Leadership Amid Security Upsurge
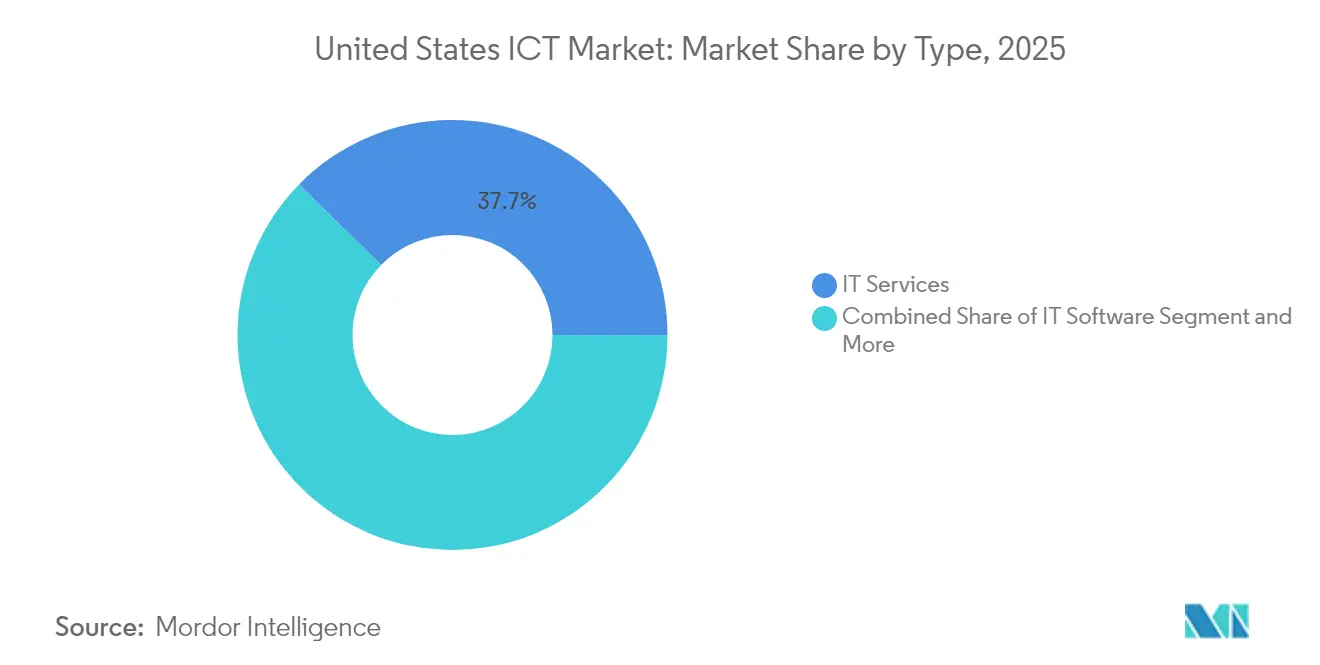
IT Services retained 37.65% of the United States ICT market in 2025, underscoring client reliance on managed migrations, cybersecurity hardening, and AI integration. The segment’s scale reflects demand for turnkey expertise, especially among firms racing to modernize but battling internal skills gaps. In contrast, IT Security, bolstered by the national talent deficit, is set to post an 10.85% CAGR, the fastest across categories, as organizations pursue zero-trust frameworks and continuous threat-monitoring subscriptions.
Spending on IT Hardware remains tempered by cloud consolidation, while IT Software benefits from subscription transitions and generative-AI add-ons. Communication Services lift on sustained 5G FWA uptake that multiplies recurring-connectivity revenue. Providers blending consulting, implementation, and managed-service contracts will outperform, mirroring Microsoft’s tri-partite partnership with Accenture and Avanade to deliver AI-enabled Copilot solutions. The convergence of hardware, software, and connectivity around integrated use-cases signals that future gains will accrue to platforms offering end-to-end value chains rather than single-point products. Edge hardware specialists that embed security and AI accelerators into compact form factors are also positioned for outsized upside as Industry 4.0 workloads proliferate.


By Enterprise Size: SME Momentum Narrows the Gap
Large Enterprises controlled 62.45% of 2025 spend, leveraging multi-year budgets to contract complex hybrid-cloud and cybersecurity programs that lock in sizable vendor obligations. Yet Small & Medium Enterprises are advancing at a 9.62% CAGR, shrinking historical disparities as cloud democratization and low-code platforms lower entry barriers. SMEs leapfrog legacy constraints, adopting cloud-native ERP, AI-driven CRM, and subscription-based cybersecurity without heavy capital outlays. The United States ICT market size for SMEs is therefore projected to widen meaningfully by 2031, supported by FWA and rural fiber builds that extend high-bandwidth reach.
Large-enterprise buyers increasingly emphasize multi-cloud governance, workload portability, and AI ethics, generating opportunities for orchestration platforms and compliance-as-a-service offerings. Meanwhile, vendors courting the SME cohort must balance ease-of-use with affordability—tiered packages and pay-as-you-go consumption models have proven most effective. Policy incentives such as the SBA’s Cybersecurity Resilience Program may further catalyze SME security spend, narrowing risk exposure differentials with corporate peers.
By Industry Vertical: Manufacturing Accelerates into Double-Digit Growth
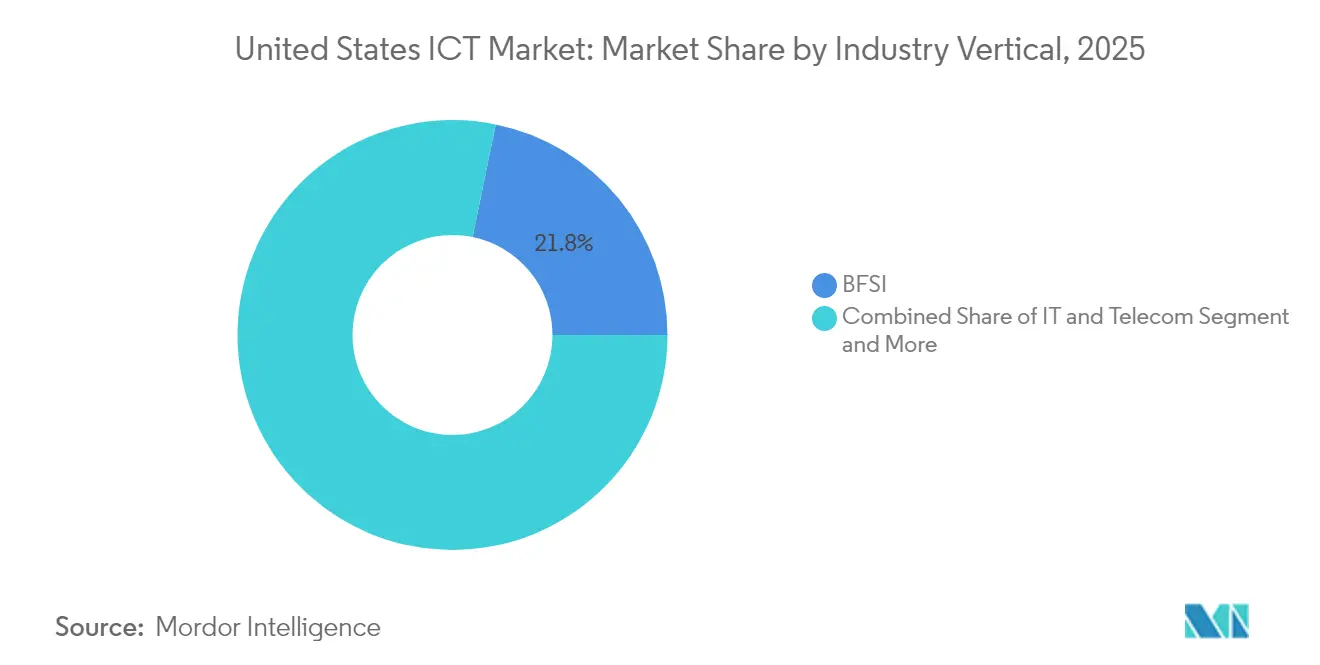
BFSI accounted for 21.78% of the United States ICT market share in 2025, reflecting heavy outlays on regulatory compliance, digital banking, and fraud analytics. Cloud-native core banking and AI-assisted customer service remain primary capital sinks as institutions pursue omni-channel differentiation. Manufacturing, however, is forecast to register an 11.12% CAGR, propelled by scaled Industry 4.0 pilots transitioning into plant-wide rollouts. Predictive-maintenance analytics, computer-vision quality checks, and autonomous material-handling now justify edge-compute nodes and private-5G slices within factory precincts.
Government IT budgets reached USD 138.9 billion in 2024, with more than half the states carrying cybersecurity insurance to offset rising ransomware liabilities. Retail & E-commerce tap AI-driven personalization and AR shopping aids, while Energy & Utilities invest in smart-grid digitization that dovetails with data-center decarbonization agendas. Cross-industry synergies—such as financial institutions adopting zero-trust frameworks pioneered in OT environments—illustrate how solutions increasingly transcend sector silos, broadening vendor total addressable markets.
By Deployment Model: Hybrid Clouds Outpace Pure-Play Alternatives
Cloud deployments captured 53.85% of 2025 spending, locking in the largest share of the United States ICT market size for infrastructure. Enterprises cite scalability, rapid provisioning, and global reach as key triggers, while hyperscalers aggressively bundle AI accelerators into flagship instances. Yet Hybrid configurations are accelerating at 13.02% CAGR through 2031 as data-sovereignty mandates, cost-optimization strategies, and latency requirements demand nuanced workload placement . On-premises footprints persist for classified or low-latency applications, but their proportion is shrinking amid power-price inflation and evergreen hardware models.
Microsoft’s Azure Arc and AWS Outposts illustrate how hyperscalers now extend control planes into customer sites, effectively blurring public versus private delineations. Edge-native stacks—complete with container orchestration, GPU acceleration, and integrated OTA patching—further complicate deployment taxonomies. Vendors capable of delivering seamless policy enforcement, identity management, and observability across heterogenous estates will capture disproportionate wallet share as enterprises converge toward “cloud-right” architectures.
Regulatory Landscape
The United States ICT market is governed by a multi-agency framework led by the Federal Communications Commission (FCC) for communications networks, spectrum policy, equipment authorization, and public safety systems. In July 2026, the FCC advanced a set of actions focused on speed, security, and spectrum abundance, including a Third Report and Order in ET Docket No. 21-232 that restricts authorization of devices incorporating logic-bearing hardware components from entities on the FCC Covered List, tightening compliance requirements across telecom hardware and connected-device supply chains.
Alongside device security, the FCC moved to modernize the Emergency Alert System (EAS) and Wireless Emergency Alerts (WEA) with targeted cybersecurity improvements, reinforcing minimum-security expectations for operators and vendors that support alert origination and delivery. On spectrum, the FCC continued steps related to reallocation of the 3.98-4.2 GHz band (Upper C-band), with auction-related rules that set mandatory clearing deadlines for incumbent Fixed Satellite Service operations and enable terrestrial wireless operations in specific PEAs by December 2030 and July 2031, supporting long-cycle planning for carriers, OEMs, and network integrators.
Value Chain Analysis
The United States ICT value chain covers upstream semiconductor and component supply, networking and compute hardware manufacturing, software platforms, systems integration and managed services, and downstream delivery through cloud providers, carriers, and channel partners to enterprise and public-sector buyers. Semiconductor availability and advanced packaging remain structural chokepoints for AI infrastructure, which shifts resilience efforts into supplier selection and long-term procurement; for example, Apple and Broadcom finalized a multi-year USD 30 billion agreement in July 2026 tied to RF components manufactured in Colorado, underscoring domestic sourcing and assured capacity as competitive levers.
In the midstream, hyperscalers and telecom operators increasingly co-design architectures that link network and cloud operational layers, moving value toward integrated connectivity-plus-compute offerings. AT&T has been integrating network operations and enterprise connectivity more directly with hyperscale environments, including AWS data-center and edge constructs, while Verizon emphasizes targeted densification and fiber build programs to improve last-mile performance and enable edge deployment models. Downstream, enterprises consume ICT through hybrid multi-cloud estates, with demand clustering around secure connectivity, identity and access management, and managed services that can absorb skills gaps and operational complexity.
Competitive Landscape
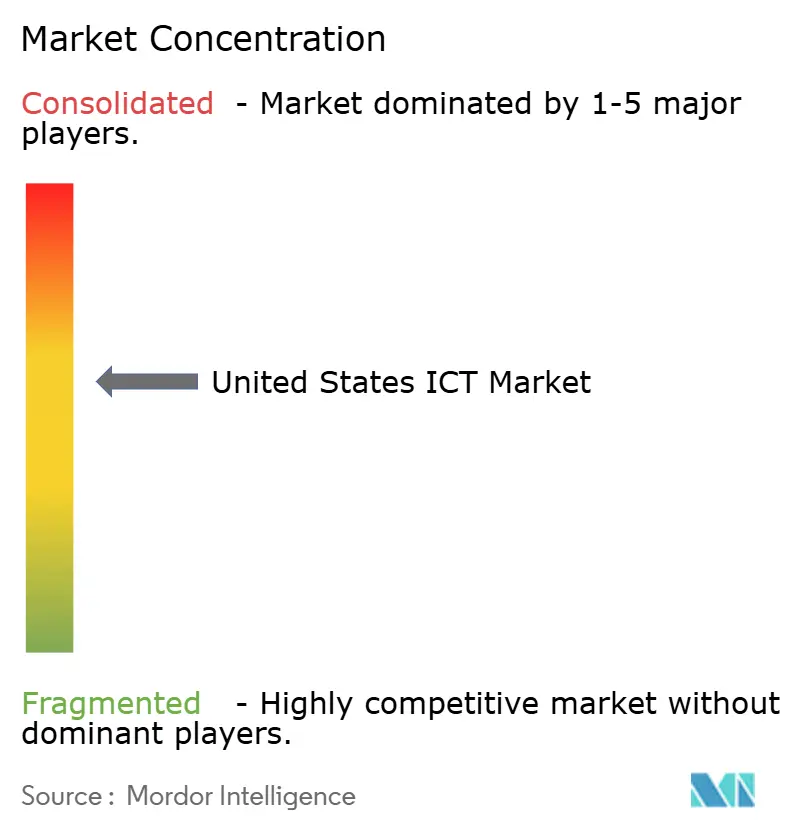
Competition across the United States ICT market remains intense but moderately consolidated, with hyperscale clouds, legacy tech stalwarts, and telecom carriers each controlling influential yet non-dominant slices. Amazon, Microsoft, and Google collectively exceed 65% of public-cloud spend, yet none singularly crosses dominant-firm thresholds in total ICT value. Traditional vendors like IBM, Oracle, and Cisco pivot toward subscription-based software and AI-embedded networking to preserve relevance, while carriers such as Verizon and AT&T leverage 5G spectrum ownership to capture edge-compute adjacency.
Strategic alliances have become the primary weapon for differentiation. Microsoft’s tie-ups with Accenture, Avanade, Lumen, and Palantir showcase orchestrated ecosystems that marry hyperscale capacity with vertical domain expertise. Semiconductor supply-chain resilience, fueled by USD 53 billion CHIPS Act incentives, is drawing Intel and Samsung into domestic fabrication, tightening linkages between compute infrastructure and broader national-security imperatives. Start-ups specializing in AI-optimized servers, quantum-proof encryption, and immersion cooling are injecting competitive tension, often partnering with incumbents rather than pursuing stand-alone displacement.
The cybersecurity talent deficit confers advantage to firms capable of bundling managed-security services at scale. MSSPs integrating zero-trust architectures and AI-assisted SOCs have carved defensible beachheads, while product-centric suppliers scramble to embed autonomous remediation to offset human shortfalls. Sustainability credentials are now table stakes: hyperscalers publicly commit to water-positive and carbon-negative milestones by 2030, pressuring laggards to adopt similar roadmaps or risk procurement exclusion by ESG-minded customers.
United States ICT Industry Leaders
AT&T Inc.
Microsoft Corporation
Verizon Communications Inc.
Amazon Web Services, Inc.
Alphabet Inc. (Google Cloud & Services)
- *Disclaimer: Major Players sorted in no particular order

Market Opportunities and Future Outlook
Broadband expansion programs and carrier capex roadmaps create whitespace for vendors that bundle connectivity, cloud on-ramps, security, and managed operations for distributed enterprises and underserved locations. The BEAD program (USD 42.45 billion) continues to widen high-speed availability, and carrier initiatives are adding scale: AT&T has framed over USD 250 billion of investment through 2030 in fiber and wireless infrastructure, while partnerships with hyperscalers are translating these builds into more productized enterprise connectivity options for AI and hybrid-cloud workloads.
A second opportunity pool is emerging at the intersection of security, supply-chain assurance, and regulated device authorization, where compliance requirements are increasingly shaping purchasing and architecture choices. The FCCs July 2026 equipment-authorization security action in ET Docket No. 21-232 raises expectations for hardware provenance and component screening, supporting demand for secure-by-design network equipment, verification services, and lifecycle management tooling. In parallel, spectrum actions tied to the Upper C-band reallocation extend the planning horizon for wireless densification and fixed-wireless economics, supporting integrators and software providers that build repeatable private-network, edge, and observability stacks for manufacturing, logistics, and public-sector deployments.
Recent Industry Developments
- June 2026: AWS Interconnect-last mile gated preview in the U.S. with AT&T fiber and fixed wireless for connecting branches/data centers to AWS. Direct cloud-connectivity enhancement for enterprise workloads. The initiative strengthens hyperscale-to-enterprise integration and reduces latency for AI workloads.
- June 2026: AT&T Expansion of Build-A-Plan service to bundle unlimited wireless with AT&T Fiber, effective July 7, 2026. The expansion bundles unlimited wireless with fiber and enables more seamless hybrid connectivity for customers. Enhances competitive differentiator in fixed and wireless connectivity to support cloud-enabled services.
- May 2026: AT&T commits $19 billion to expand high-speed connectivity in California. Massive network-expansion investment in a key market. Broadens nationwide connectivity capacity and enables enterprise-grade cloud workloads.


Research Methodology Framework and Report Scope
Market Definition and Coverage
For this study, the United States ICT market is defined as the value of spending on core information technology and communications offerings used by enterprises and public sector users, including hardware, software, services, infrastructure, and communication services.
Scope exclusions: We exclude informal or non-commercial activity and any double counting between telecom service revenues and IT service pass-through charges when they represent the same end spend.
Segmentation Overview
- By Type
- IT Hardware
- Computer Hardware
- Networking Equipment
- Peripherals
- IT Software
- IT Services
- Managed Services
- Business Process Services
- Business Consulting Services
- Cloud Services
- IT Infrastructure / Data Centers
- Colocation Data Centers
- Storage
- Servers
- Compute
- IT Security / Cyber-security
- Application Security
- Cloud Security
- Data Security
- Identity and Access Management
- Infrastructure Protection
- Integrated Risk Management
- Network Security Equipment
- Endpoint Security
- Communication Services
- IT Hardware
- By Enterprise Size
- Small and Medium Enterprises
- Large Enterprises
- By Industry Vertical
- BFSI
- IT and Telecom
- Government
- Retail and E-commerce
- Manufacturing
- Energy and Utilities
- Others
- By Deployment Model
- On-premises
- Cloud-only
- Hybrid
Data Sources, Market Sizing, and Validation
Desk Research
Desk work starts with building a clean view of demand and supply signals that can be tracked consistently each year in the United States. We use public sources such as the U.S. Bureau of Economic Analysis for macro indicators, the U.S. Census Bureau for business and trade context, the FCC for communications and broadband indicators, and the Bureau of Labor Statistics for tech employment and wage signals that often move with services demand.
To anchor the ICT mix, filings and investor presentations help us understand how major listed companies describe revenue splits, price changes, and customer cohorts. We also review reputable press, standards bodies, and selected peer reviewed papers to check how cloud adoption, security requirements, and network upgrades are evolving. Where needed, a paid subscription for company financials and a patent database are used to fill gaps on product cycles and innovation intensity. The examples above are not exhaustive, and many other public sources are also referenced for data collection, validation, and clarification checks.
Primary Interviews and Surveys
Primary inputs are taken through expert interviews and structured surveys with ICT buyers, channel participants, and solution delivery leaders who see budgets and refresh decisions in real time. We cover a mix of large enterprises, SMEs, and public sector stakeholders across the United States so that assumptions on cloud mix, contract duration, and pricing progression can be tested and then adjusted before finalizing the model.
Distribution of primary research fieldwork respondents
| Company type | Respondent position | Region |
|---|---|---|
| Top tier: 37% | CXOs: 13% | |
| Mid tier: 49% | Functional/Unit leaders: 31% | |
| Smaller Players: 14% | Managers: 56% |
Market-Sizing & Forecasting
Sizing is built with a top-down model where national spending pools are reconstructed using macro and sector signals, and then distributed across the main ICT buckets based on observed mix shifts and adoption rates. In practice, we start from indicators such as enterprise IT budget direction, cloud adoption mix, telecom and broadband usage trends, data center and network upgrade cycles, and services intensity signals like tech hiring and wage inflation, which tends to show up when delivery capacity is tight.
Those totals are then checked with selective bottom-up approximations, including sampled average contract values for IT services, typical license and subscription price ranges, and channel checks on hardware replacement volumes. When a direct roll-up is not feasible for a sub-area, gaps are handled using proxy ratios from comparable buyer groups, which are then validated in follow-up calls.
For forecasting, we use scenario analysis supported by expert consensus. The market is influenced by policy, enterprise investment cycles, and technology refresh timing. Variables that are explicitly stress tested include cloud versus on-premises mix, cybersecurity and compliance-driven spending, communications service ARPU direction, and the pace of AI-related infrastructure upgrades, and then the growth path is selected by comparing which scenario matches the most consistent signals.
Data Validation & Update Cycle
Validation is done through multiple checks so that the final values are not driven by a single data series or one interview. We compare the outputs against independent metrics such as macro spending indicators, employment trends tied to ICT services delivery, and communications usage measures, and then investigate any large variance before sign-off.
Anomaly checks are performed at the bucket level and at the total market level, followed by an internal analyst review that re-tests key assumptions and math logic. If a mismatch remains after review, respondents are re-contacted to confirm whether the shift is real (for example, pricing changes, contract re-baselining, or a one-time infrastructure cycle). Reports are refreshed annually, with interim updates when material events occur, and a final pre-delivery pass is completed so clients receive the latest updated view.
Mordor Intelligence's United States Ict Market Size Compared Against Other Published Estimates
Published numbers for the United States ICT market often do not line up because sources use different ICT definitions, apply different year timing, and treat cloud and communications revenues differently. Variances also come from whether an estimate is closer to spend (demand side) or closer to revenue (supply side), which can change totals when pass-through services are counted twice.
The main gap comes from whether communications services and cloud related revenues are counted as full market value even when they overlap with bundled contracts. Mordor Intelligence controls the total by separating end-user spend into IT hardware, IT software, IT services, IT infrastructure, and communication services, then finalizing currency timing and refresh assumptions.
Benchmark comparison
| Source | Market Size | Gaps in Research Methodology |
|---|---|---|
| Mordor Intelligence | USD 1.50 T (2025) | |
| Industry Association A | USD 1.45 T (2015) | Uses an older spend-based ICT framing and period assumptions that reflect 2015 technology mix, so cloud delivery models and newer infrastructure cycles are not represented in the same way. |
| Trade Association B | USD 2.30 T (2026) | Represents direct economic value of the tech industry rather than ICT market spend, which can pull in adjacent categories and broader value-added effects beyond core ICT products and services. |
The table shows that the spread is largely explained by scope and measurement style, which is why year alignment and what is being measured (spend, revenue, or economic value) matter as much as the math. By keeping inputs tied to observable demand signals and checking them against practical bottom-up references, we can provide a market value that is easier to trace and repeat when assumptions change.


Key Questions Answered in the Report
How large is the United States ICT market in 2026 and how fast is it growing?
The market is valued at USD 1,609,650 million in 2026 and is projected to reach USD 2,288,900 million by 2031, exhibiting a 7.31% CAGR.
Which segment currently leads ICT spending by type?
IT Services leads with 37.65% share, driven by demand for managed cloud migrations, cybersecurity integration, and AI consulting.
Which segment currently leads ICT spending by type?
Which segment currently leads ICT spending by type?
Why are secondary U.S. metros attracting hyperscale data-center investments?
Operators seek affordable power, open land, and supportive regulation, resulting in USD 158 billion of annual capital routed to markets such as Texas, Virginia, and North Carolina.
Page last updated on:






