
United States HVAC Equipment And Services Market Size and Share
Market Overview
| Study Period | 2020 - 2031 |
|---|---|
| Forecast Data Period | 2026 - 2031 |
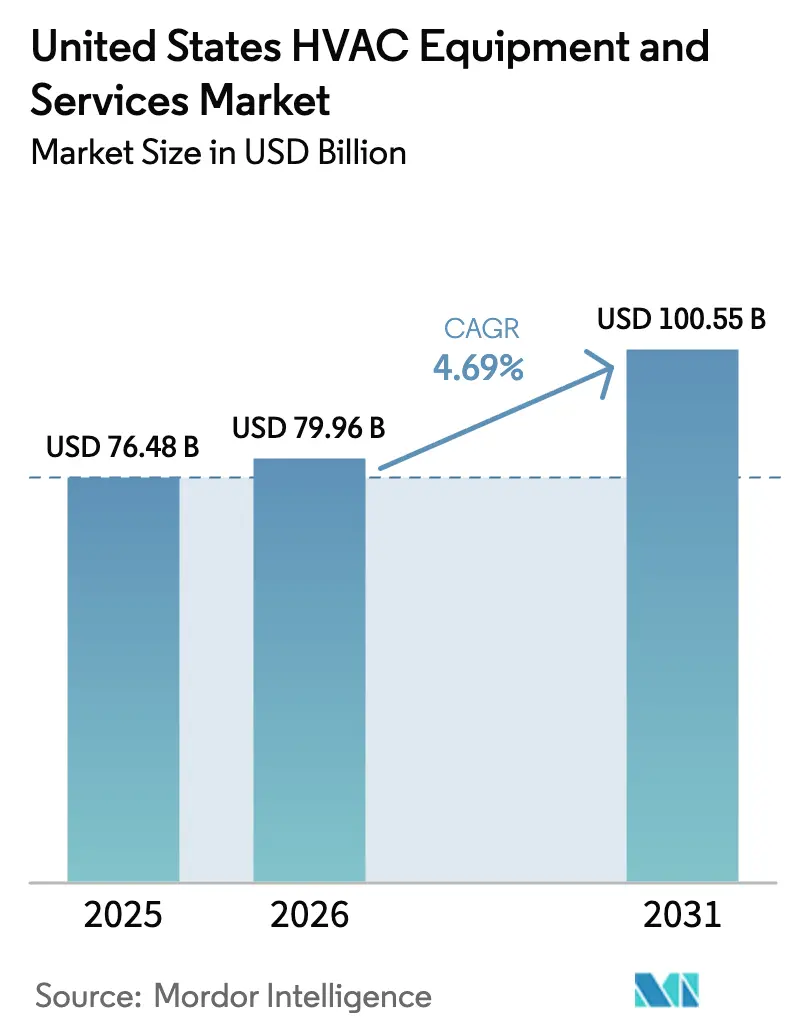
| Base Year Market Size (2025) | USD 76.48 Billion |
| Market Size (2026) | USD 79.96 Billion |
| Market Size (2031) | USD 100.55 Billion |
| Growth Rate (2026 - 2031) | 4.69% CAGR |
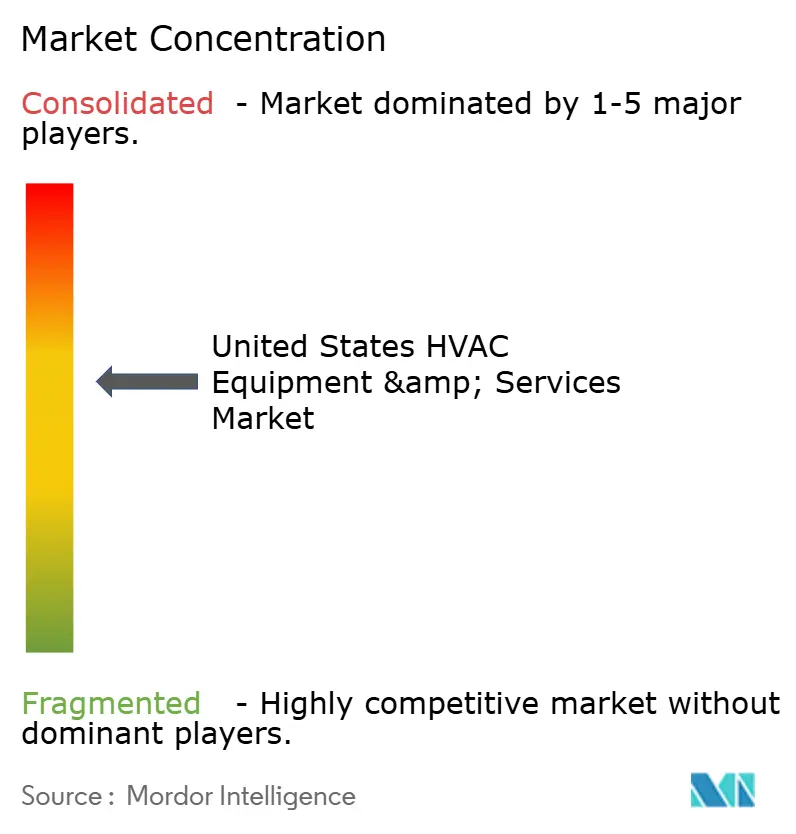
| Market Concentration | Medium |
Major Players.webp) *Disclaimer: Major Players sorted in no particular order Image © Mordor Intelligence. Reuse requires attribution under CC BY 4.0. | |
United States HVAC Equipment And Services Market Analysis by Mordor Intelligence
The United States HVAC Equipment and Services Market size is projected to be USD 76.48 billion in 2025, USD 79.96 billion in 2026, and reach USD 100.55 billion by 2031, growing at a CAGR of 4.69% from 2026 to 2031. This growth profile signals a mature industry in which regulatory compliance, federal incentives, and replacement cycles outrank new‐build demand as primary volume drivers. Tax credits of up to USD 2,000 for qualifying heat pumps, combined with sizable state rebate programs, sharply reduce payback periods and tip customer choice toward high-efficiency equipment.[1]Internal Revenue Service, “Air Source Heat Pumps Tax Credit,” energystar.gov Mandatory hydrofluorocarbon phase-downs reshape product roadmaps as manufacturers move to A2L refrigerants and accelerate R-410A system retirements.[2]Environmental Protection Agency, “Phasedown of Hydrofluorocarbons,” federalregister.gov Simultaneously, extreme heat events in southern states lengthen cooling seasons and lift service runtimes, partly offsetting tempered heater turnover in milder regions. Intensifying grid modernization efforts create adjacent opportunities for smart thermostats and connected HVAC platforms that enable demand-response value pools.
Key Report Takeaways
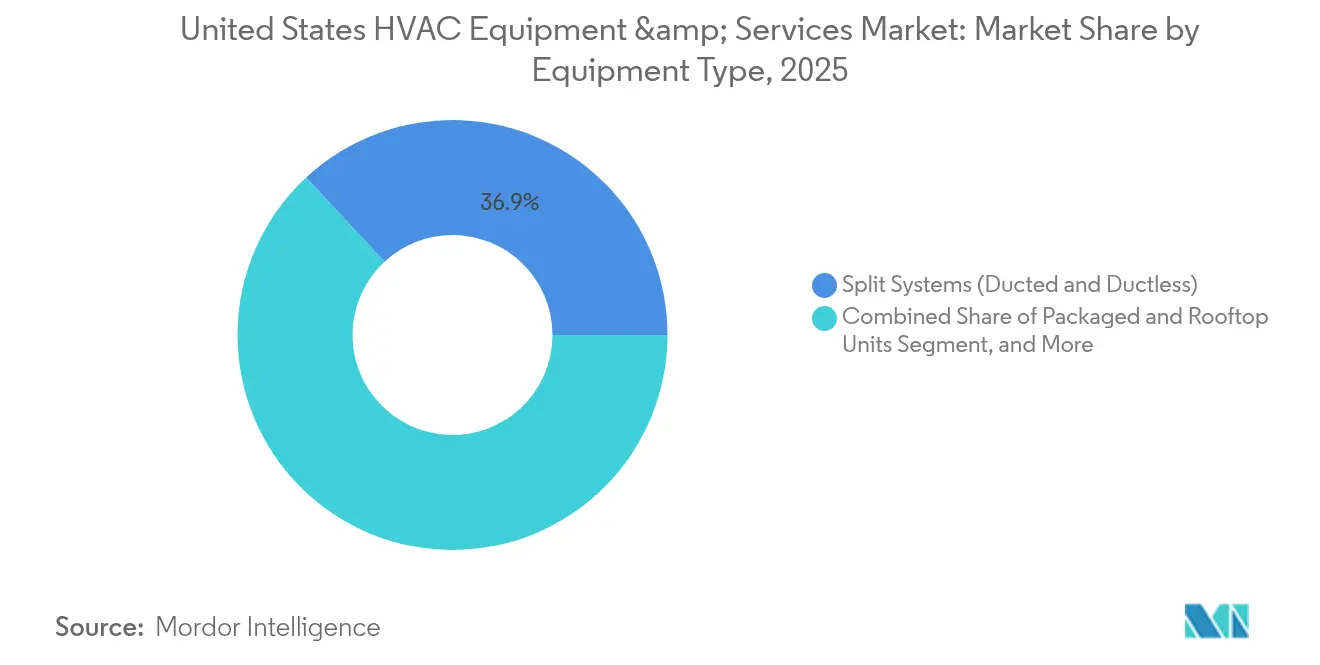
- By equipment type, split systems led with 36.92% revenue share in 2025, while heat pumps recorded the fastest 5.89% CAGR through 2031.
- By service type, new installations contributed 43.62% of revenue in 2025; retrofits and replacements are projected to expand at a 5.74% CAGR to 2031.
- By distribution channel, wholesalers held 49.02% share in 2025, whereas online platforms post the highest 9.08% CAGR over the forecast window.
- By end user, residential customers accounted for 55.21% revenue share in 2025; data centers exhibit the fastest 6.91% CAGR through 2031.
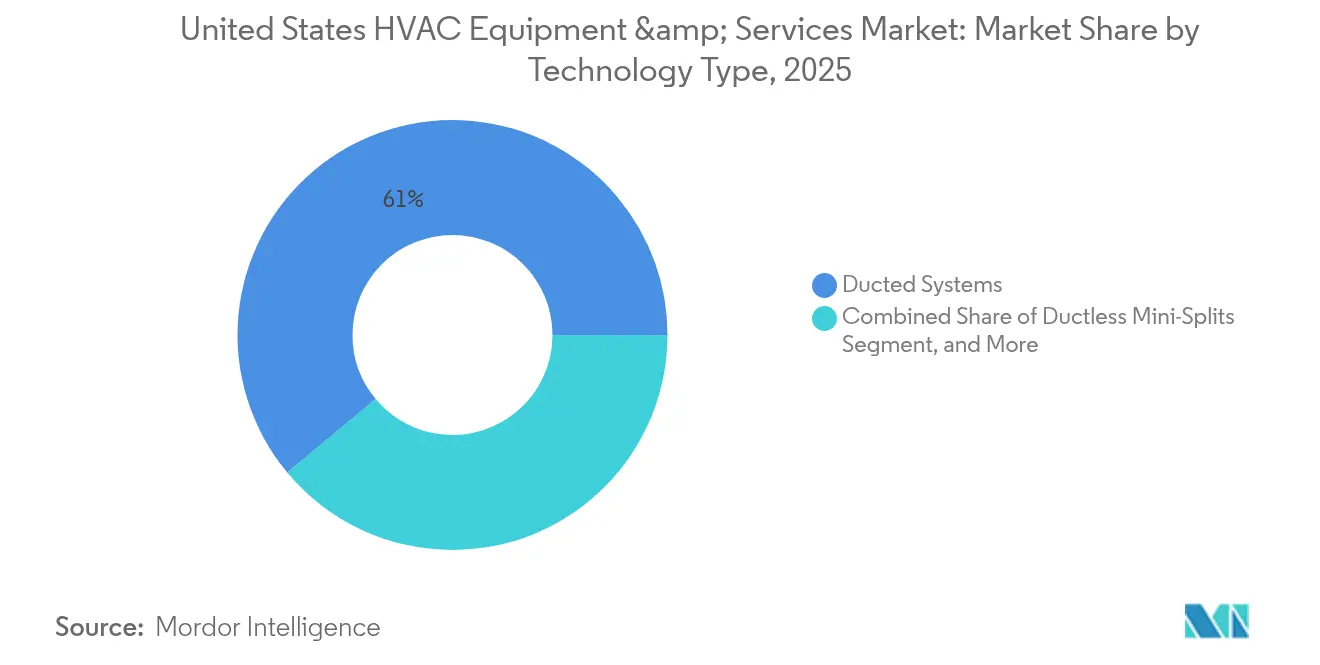
- By technology, ducted systems maintained 61.05% share in 2025; smart and connected HVAC solutions are advancing at an 8.37% CAGR through 2031.
Note: Market size and forecast figures in this report are generated using Mordor Intelligence’s proprietary estimation framework, updated with the latest available data and insights as of 2026.
United States HVAC Equipment And Services Market Trends and Insights
Drivers Impact Analysis*
| Driver | (~) % Impact on CAGR Forecast | Geographic Relevance | Impact Timeline |
|---|---|---|---|
| Federal incentives for high-efficiency HVAC upgrades | +0.8% | National, with higher adoption in California, New York, Washington | Medium term (2-4 years) |
| Mandatory refrigerant phase-downs accelerating equipment replacement | +0.6% | National, with commercial sector leading adoption | Short term (≤ 2 years) |
| Southern heat-wave frequency boosting cooling demand | +0.4% | Southern states, particularly Texas, Florida, Arizona | Long term (≥ 4 years) |
| Building-electrification mandates in key states | +0.3% | California, New York, Washington, Massachusetts | Medium term (2-4 years) |
| IoT-enabled predictive-maintenance cost savings | +0.2% | Commercial and industrial segments nationwide | Medium term (2-4 years) |
| Growth of data-center cooling load | +0.1% | Technology hubs in Virginia, Texas, California, Oregon | Long term (≥ 4 years) |
| Source: Mordor Intelligence | |||
Federal Incentives for High-Efficiency HVAC Upgrades
Federal tax credits covering up to USD 2,000 for qualified heat pump systems, extended through 2032 under the Inflation Reduction Act, are changing total-cost-of-ownership calculations for homeowners and small businesses. The USD 4.5 billion High-Efficiency Electric Home Rebate Program targets low- and moderate-income households, offering rebates up to USD 8,000 and stacking with state programs to offset as much as 70% of installed cost. Nine states have pledged to secure 65% heat-pump penetration by 2030, signaling a coordinated policy push that compresses decision cycles.[3]NESCAUM, “Nine States Pledge Joint Action to Accelerate Transition to Clean Buildings,” nescaum.org California’s TECH Clean California program augments the federal incentives with contractor training and technical assistance, reducing soft costs that often derail projects. Collectively, these measures shorten payback periods to fewer than five years for average households, propelling heat pump adoption in the United States HVAC Equipment and Services market.
Mandatory Refrigerant Phase-Downs Accelerating Equipment Replacement
The American Innovation and Manufacturing Act restricts new HVAC systems to refrigerants under 700 GWP starting January 2025, prompting an abrupt shift away from R-410A. Manufacturers have converted assembly lines to A2L refrigerants such as R-454B and R-32 while deploying technician safety programs to address mild flammability characteristics. Rapid switchover drives a pronounced replacement spike and channels capital toward compliant solutions despite material cost inflation. Early adopters benefit from reduced lifecycle emissions, aiding ESG compliance for corporate buyers. With A2L systems already representing more than 60% of new residential shipments, the United States HVAC Equipment and Services market is realigning its product mix toward low-GWP offerings well ahead of the statutory deadline.
Southern Heat-Wave Frequency Boosting Cooling Demand
Record heat waves drove peak demand surges of 15-20% across southern grids in 2024, and meteorological forecasts indicate above-normal temperatures again in 2025. Extended cooling seasons increase compressor runtimes, hastening system wear and promoting early replacements. Utilities such as TXU Energy are enlarging demand-response programs, paying up to USD 150 for smart thermostat enrollment that curbs peak loads. Elevated runtime hours also improve the value proposition for variable-speed compressors and advanced controls that trim operating costs, stimulating technology-rich retrofits in the United States HVAC Equipment and Services market.
Building-Electrification Mandates in Key States
California’s building codes will require electric heat pumps in all new construction from January 2026, charting deployment of 500,000 units within three years. New York and Washington have adopted parallel measures, and combined policies now affect nearly one quarter of the national population. These mandates create captive demand streams for high-efficiency electric systems, widening the service addressable market for contractors and OEMs. Ancillary rebate programs targeting existing stock further accelerate heat-pump uptake in retrofit applications, lifting the mid-term outlook for the United States HVAC Equipment and Services market.
Restraints Impact Analysis*
| Restraint | (~) % Impact on CAGR Forecast | Geographic Relevance | Impact Timeline |
|---|---|---|---|
| Surging HFC-alternative refrigerant prices | -0.4% | National, with commercial sector most affected | Short term (≤ 2 years) |
| Skilled-labor shortages inflating install costs | -0.3% | National, with rural areas most severely impacted | Medium term (2-4 years) |
| Rising electricity tariffs dampening HVAC run-time | -0.2% | Regional variations, highest impact in California, Northeast | Medium term (2-4 years) |
| Volatility of steel and copper input costs | -0.1% | National, affecting all equipment manufacturers | Short term (≤ 2 years) |
| Source: Mordor Intelligence | |||
Surging HFC-Alternative Refrigerant Prices
Prices for R-454B have climbed from USD 17 to USD 60 per pound, adding USD 3,000-5,000 to the cost of large commercial systems and transferring roughly USD 25 billion of incremental expense to end users since 2024. Supply remains heavily dependent on imports from China, exposing the market to geopolitical risks and freight volatility. Limited domestic production capacity constrains availability during the regulatory transition, forcing contractors to pre-purchase inventory and strain working capital. Larger refrigerant charges in chillers and VRF systems intensify the effect on commercial buyers, delaying some projects despite compelling efficiency gains.
Skilled-Labor Shortages Inflating Install Costs
The industry counts more than 110,000 open technician positions, with experienced workers retiring faster than apprentices complete multi-year training pipelines. Labor scarcity elevates installation lead times and wage pressures, raising project costs and occasionally missing utility incentive deadlines. Rural areas feel the impact most severely, where technician travel adds expenses and weakens service coverage. The shortage also dampens the pace of heat-pump rollouts because installers need new certifications to handle flammable A2L refrigerants safely. Companies offering in-house training gain competitive leverage but cannot fully close the skills gap before the mid-term horizon.
*Our forecasts treat driver/restraint impacts as directional, not additive. The impact forecasts reflect baseline growth, mix effects, and variable interactions.
Segment Analysis
By Equipment: Heat Pumps Propel Electrification Momentum
Heat pumps represent the fastest-expanding equipment class at a 5.89% CAGR through 2031 as incentives and decarbonization policies redirect budgets toward electric heating solutions. Split systems retain dominance with 36.92% revenue share in 2025 due to entrenched dealer familiarity and broad SKU variety. However, their growth moderates as households and light commercial sites migrate to dual-function heat pumps. Packaged and rooftop units remain staples for quick-turn commercial retrofits, particularly in retail strip centers and low-rise offices that value plug-and-play replacement. Chillers continue to anchor large central plants in hospitals, universities, and manufacturing sites that demand tight temperature controls. VRF solutions gain traction in medium-size offices and hospitality because zone-level modulation slashes part-load energy use. Air-handling units, fan coils, and coils support these core systems, with demand linked to the trajectory of ducted versus ductless architectures.
Heat-pump technological diversity from ducted split to ductless mini-split, hybrid, and geothermal configurations broadens addressable climates. Advancements in variable-speed inverters allow cold-climate models to deliver 100% heating capacity at 5 °F, expanding relevance across the northern tier. Furnaces still dominate in the coldest rural markets but face a measured share decline as homeowner economics improve for dual-fuel or all-electric packages. Window and through-the-wall units serve legacy multifamily buildings and temporary structures, yet their share erodes as compact mini-splits provide superior seasonal efficiency. Boilers continue to underpin hydronic heating in institutions and older high-rise assets where radiant distribution exists. Ancillary air-quality equipment such as humidifiers and dehumidifiers grew steadily after pandemic-era awareness, though they remain supplementary revenue streams rather than volume drivers. The resulting portfolio mix underscores a gradual but clear pivot toward electric, variable-speed heat-pump platforms within the United States HVAC Equipment and Services market.


By Service Type: Retrofit Activity Outpaces New Construction
New installations commanded 43.62% of 2025 revenue, fueled by ongoing commercial fit-outs and residential new-builds. Yet retrofit and replacement workstreams are set to grow more quickly, expanding at a 5.74% CAGR as regulatory and efficiency triggers pull forward system changeouts. Ageing HVAC fleets average 15-20 years in service, and new refrigerant rules now make many R-410A units technically obsolete once major repairs arise. End users are increasingly attracted to turnkey upgrade packages that combine equipment changeouts with utility rebates, financing, and predictive-maintenance subscriptions.
Maintenance contracts remain stable anchor revenue, but digital tools are reshaping execution practices. Cloud-based diagnostics detect anomalies early, allowing service providers to shift from reactive dispatches to scheduled interventions that minimize downtime. Performance-based service agreements, in which contractors share verified energy savings, are gaining traction in municipalities and school districts. Utility demand-response programs augment profitability by creating revenue for capacity curtailment events. These models position service firms as long-term energy partners rather than one-off installers inside the United States HVAC Equipment and Services market.
By Distribution Channel: Digital Platforms Disrupt Price Transparency
Traditional wholesalers controlled 49.02% of shipments in 2025, leveraging credit terms, local inventory, and technical assistance that contractors value. However, online HVAC marketplaces post a 9.08% CAGR as price transparency and rapid shipping appeal to cost-sensitive installers. COVID-19 catalyzed digital adoption; many contractors now source commodity components online and reserve complex system purchases for dedicated reps. OEM direct-sales teams penetrate large commercial and mission-critical segments, bundling advisory engineering and factory commissioning to secure specification loyalty. Retail and DIY outlets target filter replacements, thermostat upgrades, and small ductless kits that homeowners install with minimal professional help.
Hybrid models blend e-commerce convenience with last-mile expertise. Distributors have launched online portals that marry real-time stock data with curbside pickup, minimizing downtime for field crews. Some national wholesalers employ algorithmic pricing that matches internet offers to retain share. As contractors consolidate through private equity rollups, their procurement sophistication rises, further increasing the bargaining power of digital channels within the United States HVAC Equipment and Services market.
By Technology: Connectivity Redefines System Value
Ducted architectures held 61.05% share in 2025 owing to legacy prevalence and familiarity among installers. Ductless mini-splits flourish in retrofit scenarios where duct fabrication is disruptive or cost prohibitive. Hybrid and geothermal heat-pump variants serve premium efficiency niches, attractive to institutional buyers chasing zero-carbon goals. Smart and connected HVAC solutions, advancing at an 8.37% CAGR, embed Wi-Fi thermostats, IoT sensors, and AI algorithms that synchronize operation with occupancy and weather forecasts. Utilities leverage these connected endpoints for virtual power plant (VPP) programs, rewarding building owners for real-time flexibility.
Predictive-maintenance platforms digest vibration, temperature, and current data to diagnose mechanical fatigue up to 90 days in advance, cutting emergency calls by 75%. Machine learning further optimizes setpoints, delivering 20-40% runtime energy savings. As connected device penetration rises, cybersecurity has become a board-level topic, prompting OEMs to certify products under UL-2900. Software subscription models unlock recurring revenue, allowing manufacturers to monetize installed bases beyond initial hardware margin in the United States HVAC Equipment and Services market.
By End User: Data Centers Set the Pace
Residential properties generated 55.21% of 2025 demand, reflecting ongoing replacement cycles and robust single-family construction in southern growth corridors. Commercial buildings trail closely, upgrading outdated HVAC assets to meet tighter codes and tenant sustainability goals. Industrial users deploy specialized chillers and process coolers to safeguard production quality, while institutional clients emphasize air quality alongside cost efficiency to comply with healthcare and educational standards. Data centers, expanding at a 6.91% CAGR, represent the fastest-moving segment as hyperscalers and colocation providers race to satisfy cloud and AI workloads.
Higher rack densities drive liquid and immersion cooling pilots that reduce airflow requirements and free capacity in existing white space. Edge facilities proliferate near population clusters, demanding compact, modular cooling units that installers can set and commission quickly. Data-center operators adopt redundant heat-pump chillers that shift seasonal energy loads between heating and cooling functions. This specialized growth amplifies opportunities for integrators versed in environmentals and controls, strengthening sector diversification in the United States HVAC Equipment and Services market.
Geography Analysis
Regional climate patterns, policy frameworks, and economic conditions create distinct demand clusters within the United States HVAC Equipment and Services market. Southern states, led by Texas and Florida, confront prolonged cooling seasons and frequent heat waves that propel high-efficiency air-conditioning and dual-fuel heat-pump sales. Utility rebates for connected thermostats accelerate smart equipment uptake, and peak-pricing tariffs encourage variable-speed compressors that optimize part-load performance. Rapid population inflows to metropolitan areas such as Austin and Orlando further sustain residential replacement volume.
California wields outsized influence through building-electrification mandates and incentive layering that target 6 million additional heat pumps by 2030. The state already captures 24.12% of national revenue, with early adoption of A2L refrigerants and advanced controls positioning it as a technology bellwether. Pacific Gas and Electric’s VPP initiative aggregates residential HVAC assets into grid-responsive fleets, spotlighting the monetization potential of distributed flexibility.
In the Northeast and Midwest, cold-climate heat-pump prototypes tested under the DOE challenge now sustain full heating capacity at –13 °F, opening electrification pathways where gas furnaces historically dominated. Nine northeastern states pursue a coordinated 65% market penetration goal by 2030, backed by utility rebates that mitigate higher upfront costs. Rural counties face pronounced technician shortages, extending project timelines and occasionally curtailing rebate eligibility windows.
The Pacific Northwest and Rocky Mountain regions show rising VRF adoption for mixed-use complexes where temperate climates favor heat-recovery advantages. Meanwhile, the Southeast commands the nation’s fastest data-center construction pace, with Virginia’s “Data Center Alley” driving demand for precision liquid cooling systems. Across all regions, policy momentum and climate extremes argue for continued investment in efficient, low-GWP, and connected HVAC systems, sustaining steady growth for the United States HVAC Equipment and Services market.
Regulatory Landscape
US HVAC equipment compliance is being shaped by the Environmental Protection Agency (EPA) Technology Transitions program under the American Innovation and Manufacturing (AIM) Act, which restricts higher-GWP HFCs in new refrigeration, air conditioning, and heat pump equipment with subsector compliance dates spanning January 1, 2025, through January 1, 2028. In December 2024, EPA finalized amendments for certain VRF air conditioning and heat pump systems, extending some installation deadlines to January 1, 2027 (for equipment using components manufactured or imported before January 1, 2026) and allowing until January 1, 2028 for projects tied to building permits issued before October 5, 2023. The updates tighten the link between component date-codes, permits, and field installation planning.
On the energy-efficiency side, the US Department of Energy (DOE) updated central air conditioner and heat pump test procedures in January 2025 by incorporating AHRI 210/240-2024 (appendix M1) and establishing a new appendix M2 referencing AHRI 1600-2024 for future metrics (SCORE and SHORE). Separately, DOE efficiency requirements for air-cooled, three-phase, small commercial package air conditioners and heat pumps (below 65,000 Btu/h) became mandatory on January 1, 2025, reinforcing the market shift toward higher-efficiency product lines alongside the refrigerant transition.
Value Chain Analysis
The United States HVAC equipment and services value chain spans upstream inputs (steel, copper, compressors, controls, and refrigerants), OEM manufacturing and assembly, and multi-tier distribution through national and regional wholesalers and distributors (supported by local inventory and credit), with contractors performing installation, retrofit, and recurring maintenance. Technology Transitions compliance has become a supply-chain variable, with OEMs and distributors managing A2L refrigerant readiness, cylinder availability, and legacy-system inventory exposure around component manufacture and installation cutoffs, while service firms add safety training and tooling to handle mildly flammable refrigerants.
Downstream, procurement and fulfillment are increasingly digitized, with OEM and channel initiatives linking home builders, contractors, and distributors to improve stock visibility and order flow. Bottlenecks flagged across 2024-2025 include tariff exposure for certain components and intermittent refrigerant supply constraints, which has increased dual sourcing and localization efforts by manufacturers and their tier suppliers. Aftermarket services (maintenance contracts, predictive diagnostics, and connected controls) extend the chain beyond equipment shipment, strengthening the role of software platforms and OEM-certified training in sustaining contractor performance and end-user uptime.
Competitive Landscape
The market exhibits moderate concentration, with the top five manufacturers controlling an estimated 62% of aggregate revenue through diverse portfolios and nationwide dealer networks. Carrier, Trane Technologies, Lennox, and Johnson Controls leverage scale economies to negotiate favorable component pricing and keep channel partners well stocked. Competitive intensity has shifted toward solution ecosystems that bind hardware with software and services. Carrier’s alliance with Google Cloud integrates HVAC, battery storage, and AI guidance into home energy management platforms, broadening Carrier’s value proposition beyond compressors and coils.
Strategic consolidation continues. Samsung and Lennox formed a joint venture to accelerate VRF penetration, combining Samsung inverter expertise with Lennox’s distribution reach. Daikin partnered with Copeland to introduce advanced inverter swing rotary compressors, lifting energy efficiency and positioning for tightened 2025 SEER2 benchmarks. Trane Technologies’ planned purchase of BrainBox AI enhances Trane’s autonomous optimization capabilities, supporting service contracts that guarantee savings.
Innovation pipelines emphasize refrigerant transition and electrification. Mitsubishi Electric Trane’s new R-454B product line shows 78% lower GWP than legacy R-410A while sustaining performance across load points. Daikin Applied’s Trailblazer HP chiller introduces air-sourced heat-pump capability for commercial retrofits, achieving up to 300% heating efficiency and positioning the unit for electrified boiler replacement. Intellectual-property races intensify, illustrated by the Hong Kong University of Science and Technology’s elastic-alloy magnetocaloric breakthroughs promising an order-of-magnitude leap in temperature-change efficiency. Vendors able to translate such lab advances into commercial products could reset industry cost curves.
Utility programs and federal incentives magnify the role of after-sales services, making training and field support differentiators amid a labor crunch. OEMs with accredited technician academies position themselves to capture retrofit waves tied to refrigerant rules, solidifying channel loyalty within the United States HVAC Equipment and Services market.
United States HVAC Equipment And Services Industry Leaders
Daikin Industries Ltd.
Lennox International Inc.
Emerson Electric Company
EMCOR Group
Johnson Controls International plc
- *Disclaimer: Major Players sorted in no particular order

Market Opportunities and Future Outlook
Regulatory change and incentives are creating whitespace for contractors and OEMs that can streamline compliant electrification upgrades. Federal tax credits up to USD 2,000 for qualifying heat pumps (extended through 2032 under the Inflation Reduction Act) and the USD 4.5 billion High-Efficiency Electric Home Rebate Program (rebates up to USD 8,000 for eligible households) are pushing demand toward high-efficiency, low-GWP equipment and turnkey replacement packages that bundle rebates, financing, and commissioning. State electrification mandates further concentrate opportunity in code-driven new construction, including California requirements for electric heat pumps in new buildings from January 2026.
Connected HVAC and building-management cybersecurity is also becoming a market-access and differentiation lever, expanding opportunities in device certification, secure commissioning, and lifecycle services for commercial owners and data centers. In July 2026, the third edition of UL 2900-2-4 became mandatory for cybersecurity testing of connected smart HVAC controllers and related endpoints, increasing the value of vendors that can deliver compliant, cloud-connected products and keep installed bases patched. Parallel momentum shows up in AI-enabled optimization platforms, including Johnson Controls actions in 2026 (acquiring Nantum AI for OpenBlue and launching Metasys 16.0 with expanded resilience and cybersecurity capabilities aligned with IEC 62443-4-2 Security Level 2), which supports performance contracting and predictive maintenance offerings for energy-intensive facilities.
Recent Industry Developments
- July 2026: Daikin Comfort Technologies North America launched the NEXIO Max package heat pump, an inverter-driven rooftop unit for light commercial applications using R-32 refrigerant. The release expands the pool of low-GWP rooftop options available to contractors as the refrigerant transition reshapes replacement and new-installation specs.
- June 2026: Johnson Controls introduced Metasys 16.0 with added resilience and cybersecurity capabilities aligned with IEC 62443-4-2 Security Level 2. The upgrade reinforces the software and services layer around HVAC and building controls, supporting enterprise customers that need secure, connected operations across portfolios.
- June 2025: Daikin Applied unveiled the Trailblazer HP air-cooled scroll chiller with integrated heat-pump functionality for commercial buildings. By enabling electrified heating alongside cooling in a single platform, the launch supports boiler-replacement projects and expands solution selling in retrofit-heavy end markets.


Research Methodology Framework and Report Scope
Market Definition and Coverage
This market covers revenue generated in the United States from HVAC equipment sales and HVAC services that support installed systems, across residential, commercial, industrial, and institutional buildings, and measured in current USD.
Scope exclusions: We exclude non-HVAC building trades that are not directly tied to heating, ventilation, or air-conditioning outcomes (for example, general plumbing-only work and standalone electrical contracting).
Segmentation Overview
- By Equipment
- Split Systems (Ducted and Ductless)
- Packaged and Rooftop Units
- Chillers
- Air-Handling Units
- Furnaces
- Fan Coils
- Window / Through-the-Wall / PTAC
- Boilers
- Heat Pumps
- Humidifiers and Dehumidifiers
- Variable Refrigerant Flow (VRF) Systems
- Other Equipment Types
- By Service Type
- New Installations
- Retrofits / Replacements
- Maintenance and Repair
- Demand-Response and Performance Contracting
- By Distribution Channel
- Direct Sales (OEM to End-User)
- HVAC Distributors / Wholesalers
- Retail / DIY Stores
- Online E-commerce Platforms
- By End User
- Residential
- Commercial
- Industrial
- Institutional (Healthcare, Education)
- Other End-users
- By Technology
- Ducted Systems
- Ductless Mini-Splits
- Hybrid / Geothermal Heat-Pump Systems
- Smart and Connected HVAC
Data Sources, Market Sizing, and Validation
Desk Research
Desk work was used to set the market frame and to anchor demand signals that are visible in public data. We referred to sources such as U.S. Census Bureau construction and housing series, Bureau of Labor Statistics price and employment data, Energy Information Administration energy consumption trends, and Environmental Protection Agency refrigerant and efficiency policy information. For context on shipment momentum and replacement activity, we also used association releases and publicly available standards updates (such as those issued by HVAC-focused trade bodies), along with investor presentations, annual filings, and disclosures from large contractors.
A paid subscription database for company financials, and another for news and financials, were used to normalize revenue splits, confirm business mix, and track material events like plant expansions and M&A announcements. Where import intensity mattered for certain equipment categories, shipment-level trade statistics were checked to spot unusual swings, then validated through expert feedback. The desk sources listed here are illustrative, and we reviewed many other public documents for data collection, cross-checks, and clarification.
Primary Interviews and Surveys
Primary inputs were collected through expert interviews and structured surveys with OEM-side leaders, distributors, contractors, service organizations, and facility decision-makers who influence specification and replacement timing. We used these discussions to pressure-test assumptions on retrofit versus new-build mix, service attach rates, and price movement, and to close gaps that desk sources cannot explain at a practical level across the United States.
Distribution of primary research fieldwork respondents
| Company type | Respondent position | Region |
|---|---|---|
| Top tier: 29% | CXOs: 15% | |
| Mid tier: 52% | Functional/Unit leaders: 39% | |
| Smaller Players: 19% | Managers: 46% |
Market-Sizing & Forecasting
Sizing starts with a top-down build where construction activity and the installed base are translated into equipment demand and service demand, and then converted into value using price ladders by equipment class and service type. The model uses inputs such as housing starts and nonresidential floor-space trends, replacement cycle assumptions tied to system age, retrofit triggers tied to efficiency rule changes, and the split between ducted and ductless installations. Service revenue is shaped using maintenance penetration, emergency repair frequency, and the average ticket size progression observed through channel discussions.
After totals are formed, selective bottom-up checks are applied to keep the numbers realistic. These include rolling up sampled supplier revenues by HVAC exposure, channel checks on unit volumes and margin bands, and sampled ASP times volume calculations for common equipment categories, then adjusting when overlaps are found. If a bottom-up signal is incomplete, the gap is handled by applying conservative coverage factors, and then rechecking the implied per-building spend against what field respondents describe in practice.
For forecasting, we use scenario analysis supported by a simple multivariate regression layer so the outlook reacts to interest rates and construction momentum, while still reflecting replacement-driven stability. Assumptions on price, mix shift toward higher-efficiency products, and service attach rates are reviewed with experts before the final forecast is locked.
Data Validation & Update Cycle
Validation is done in steps so the market total, the major sub-pools, and the implied unit economics align with each other. We compare modeled outputs against independent signals such as equipment shipment direction, labor availability trends, and construction pipeline indicators, and we investigate outliers before sign-off. When a variance cannot be explained with a clear driver, follow-up calls are triggered to confirm whether the issue is pricing, mix, or a timing mismatch.
Each report is refreshed annually, with interim updates made when major rule changes, refrigerant transitions, or demand shocks can shift near-term sizing. Before delivery, the full dataset is rechecked so clients receive the latest updated view rather than an older snapshot.
Mordor Intelligence's United States Hvac Equipment and Services Market Sizing Compared With Other Published Estimates
Published market values for US HVAC often do not line up because the scope line can shift between equipment-only, services-only, and a wider contractor revenue pool, and because the year and pricing basis are not always consistent. We keep the logic simple and traceable so each step ties back to a clear demand driver, then is reviewed with primary inputs.
The biggest gap comes from whether contractor installation labor and broader mechanical contracting revenue are counted as part of HVAC services. In this approach, Mordor Intelligence treats services as HVAC-linked installation, retrofit, and maintenance activity rather than the full contractor ecosystem that can include non-HVAC work.
Benchmark comparison
| Source | Market Size | Gaps in Research Methodology |
|---|---|---|
| Mordor Intelligence | USD 76.48 B (2025) | |
| Industry Finance Note A | USD 32.00 B (2023) | Uses a narrower definition that reads closer to HVAC systems or equipment activity, and it is anchored to an earlier base year that does not capture the later price lift and service expansion. |
| Industry Synthesis B | USD 199.00 B (2026) | Expands the scope to include a broader contractor revenue pool, which can fold in adjacent building services and thereby inflates service totals beyond HVAC-specific work. |
The spread across sources is mainly explained by what gets counted under services and how equipment versus labor is treated in value. By keeping inputs tied to replacement cycles, construction activity, and observable pricing, the estimate stays repeatable and easier to reconcile with real operating signals.


Key Questions Answered in the Report
What is the current value of the United States HVAC Equipment and Services market?
The market stands at USD 79.96 billion in 2026 and is projected to reach USD 100.55 billion by 2031.
Which equipment segment is growing the fastest?
Heat pumps lead growth with a 5.89% CAGR, buoyed by federal incentives and state electrification mandates.
How will refrigerant regulations affect HVAC investments?
The 2025 A2L requirement compels early replacement of R-410A systems, prompting near-term capex spikes and shifting product demand toward low-GWP solutions.
Why are smart HVAC systems gaining traction?
Connected controls enable utility demand-response participation and predictive maintenance, delivering 20-40% energy savings and reducing downtime.
Where is the strongest regional demand?
Southern states show the highest cooling-driven volumes, while California tops policy-driven electrification spending and the Northeast accelerates cold-climate heat-pump adoption.
What strategic moves define current competition?
Partnerships integrating AI, joint ventures on VRF and compressor technologies, and acquisitions that enhance software capabilities signal a pivot from hardware to solutions-based differentiation.
Page last updated on:






