
Market Overview
| Study Period | 2020 - 2031 |
|---|---|
| Forecast Data Period | 2026 - 2031 |
| Base Year Market Size (2025) | USD 87.26 Billion |
| Market Size (2026) | USD 90.06 Billion |
| Market Size (2031) | USD 105.45 Billion |
| Growth Rate (2026 - 2031) | 3.21 % |
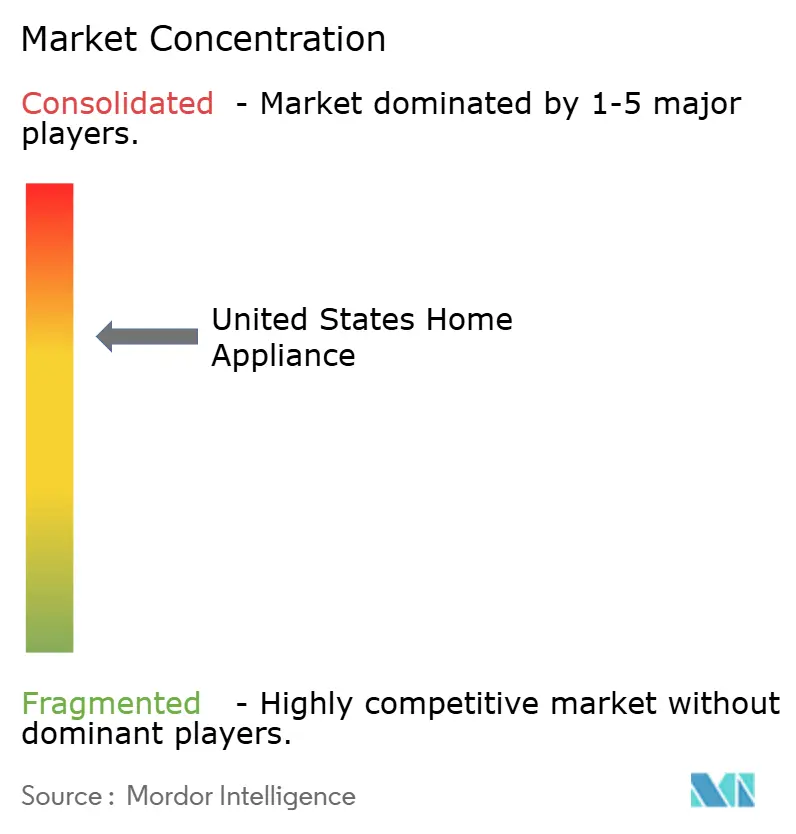
| Market Concentration | Medium |
Major Players *Disclaimer: Major Players sorted in no particular order Image © Mordor Intelligence. Reuse requires attribution under CC BY 4.0. | |
United States Home Appliance Market Analysis by Mordor Intelligence
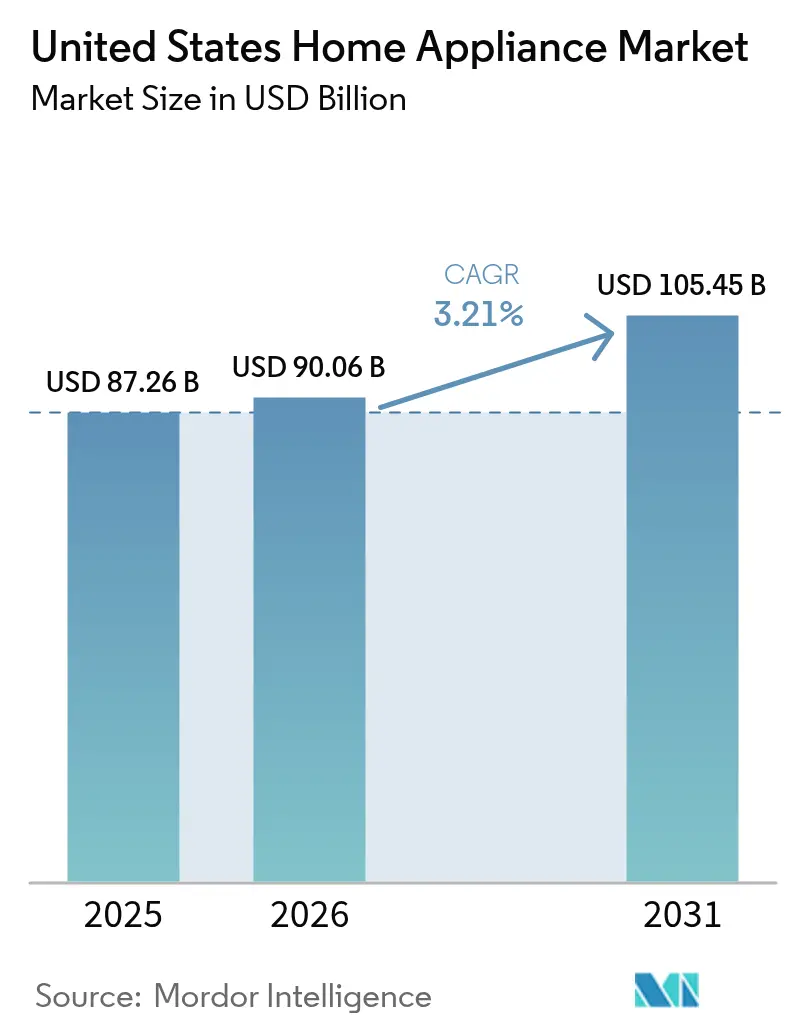
The United States home appliance market size is expected to grow from USD 87.26 billion in 2025 to USD 90.06 billion in 2026 and is forecast to reach USD 105.45 billion by 2031 at 3.21% CAGR over 2026-2031. Mature replacement demand remains the principal revenue engine, while advances in smart connectivity, energy-efficient designs, and domestic production capacity are reshaping product value propositions. Federal incentives, especially the Inflation Reduction Act’s heat-pump tax credits, accelerate adoption of high-efficiency models, and updated Department of Energy standards set a higher performance baseline for manufacturers to meet[1]. Distribution dynamics continue to shift toward digital channels as consumers embrace virtual showrooms and frictionless delivery options, although multi-branded stores still dominate large-ticket purchases. Competitive intensity is mounting as leading brands expand U.S. manufacturing footprints to mitigate tariffs and logistics risks, and interoperability standards such as Matter 1.3 are lowering barriers for connected appliances.
Key Report Takeaways
- Refrigerators led with 27.55% of the United States home appliance market share in 2025, while smart refrigerators are expanding at a 11.86% CAGR through 2031.
- Multi-branded stores held 44.62% of the United States home appliance market size in 2025, whereas e-commerce channels are advancing at a 13.05% CAGR to 2031.
- Conventional appliances accounted for 60.55% of the United States home appliance market size in 2025, yet smart and connected models show the highest momentum with a 15.95% CAGR.
- The South captured 36.35% of the United States home appliance market share in 2025; the West is outpacing all regions with a 5.48% CAGR through 2031.
Note: Market size and forecast figures in this report are generated using Mordor Intelligence’s proprietary estimation framework, updated with the latest available data and insights as of 2026.
Market Trends and Insights
Drivers Impact Analysis of United States Home Appliance Market*
| Driver | (~) % Impact on CAGR Forecast | Geographic Relevance | Impact Timeline |
|---|---|---|---|
| ENERGY STAR & DOE-compliant appliance demand | +0.8% | National; strongest in California and Northeast | Medium term (2-4 years) |
| Smart/IoT-enabled white-goods adoption | +1.2% | National; early gains on West Coast and urban centers | Long term (≥ 4 years) |
| IRA heat-pump incentives | +0.6% | National; highest in cold-climate regions | Short term (≤ 2 years) |
| Social-media-driven premium small-appliance uptake | +0.4% | National; millennial-dense metro areas | Short term (≤ 2 years) |
| BNPL-financed replacements | +0.3% | National; stronger among younger cohorts | Medium term (2-4 years) |
| Electrification push for induction cooking | +0.2% | West Coast and Northeast | Long term (≥ 4 years) |
| Source: Mordor Intelligence | |||
Rising Demand For Energy Star & Doe-Compliant Appliances
Federal efficiency mandates are generating a compliance-driven upgrade cycle that shortens traditional replacement timelines. The Department of Energy’s 2028 cooking-product standard will require electric cooktops to achieve at least 30% higher efficiency, delivering USD 1.6 billion in cumulative consumer savings[2]. Manufacturers are fast-tracking ENERGY STAR Most Efficient 2025 models across heat pumps, washers, and refrigerators, while utilities leverage the standards to roll out targeted rebates. New water-heater regulations that mandate heat-pump technology for common electric units starting in 2029 are expected to double category efficiency and anchor long-term demand for high-performance models. Predictable compliance dates allow brands to optimize inventory transitions, and regional utilities align incentive budgets with federal timelines to maximize consumer uptake.
Accelerating adoption of smart/IoT-enabled white goods
Connected appliances are shifting from novelty status to ecosystem linchpins that enable whole-home energy management. Samsung’s 2025 Bespoke AI refrigerators integrate Voice ID, 9-inch displays, and Matter-ready connectivity, illustrating how premium design meets interoperability. GE Appliances’ partnership with ABB adds circuit-level monitoring through the SmartHQ app, giving builders and homeowners actionable insights on appliance loads. Yet 68% of IoT manufacturers cite development hurdles, underscoring competitive advantages for firms that solve integration pain points. With Matter 1.3 now covering kitchen and laundry specifications, consumer hesitation around vendor lock-in is steadily waning, positioning smart features as mainstream differentiators rather than niche add-ons.
IRA heat-pump incentives expanding dryer & HVAC categories
The Energy Efficient Home Improvement Credit grants up to USD 2,000 for heat-pump installs and USD 600 for high-efficiency AC units, while the High-Efficiency Electric Home Rebate Program offers as much as USD 14,000 in point-of-sale discounts for qualifying households[3]. Panasonic’s CES 2025 OASYS system achieves 53% lower energy use than legacy HVAC, showcasing performance benefits that resonate with zero-energy-ready builders. Manufacturers now segment product lines by incentive thresholds, and staggered state rollouts are producing regional demand spikes that require agile production planning. As heat-pump dryers piggyback on HVAC awareness, cross-category bundling strategies are emerging for retailers targeting incentive-eligible consumers.
Social-media-led surge in premium small appliances
Digital content creation is driving appliance purchases beyond traditional replacement cycles, with social media platforms influencing product discovery and brand preference formation. Air fryer adoption reached 60% of American households by 2023, spurring a 90% increase in frozen food products featuring air fryer instructions and prompting brands like La Choy and Gorton's to launch dedicated product lines. This phenomenon extends to coffee equipment, where GE Appliances' Grind & Brew Coffee Maker and similar premium countertop appliances benefit from viral recipe content and influencer endorsements. The trend particularly impacts millennials and Gen Z consumers, who prioritize appliances that enhance their content creation capabilities and align with wellness-focused lifestyles. Manufacturers are responding by developing Instagram-worthy designs and partnering with food influencers to demonstrate product capabilities, creating marketing strategies that blur the lines between traditional advertising and user-generated content.
Restraints Impact Analysis of United States Home Appliance Market*
| Restraint | (~) % Impact on CAGR Forecast | Geographic Relevance | Impact Timeline |
|---|---|---|---|
| Volatile steel & semiconductor costs | –0.7% | National; heaviest on domestic manufacturers | Short term (≤ 2 years) |
| Persistent logistics & parts shortages | –0.4% | Nationwide | Medium term (2-4 years) |
| Consumer cybersecurity concerns | –0.3% | National; privacy-sensitive segments | Medium term (2-4 years) |
| Higher future DOE compliance costs | –0.2% | National; smaller manufacturers most affected | Long term (≥ 4 years) |
| Source: Mordor Intelligence | |||
Volatile steel & semiconductor costs compress margins
Steel tariffs rose to 50% in June 2025, now covering appliance subcomponents, and pushed major-appliance shelf prices 4% higher in a single month[4]. Major appliance prices increased over 4% in May 2025 alone, with companies like Samsung and LG facing significant cost pressures from imported materials. Hurricane Helene's disruption of North Carolina's Spruce Pine quartz mine, which supplies high-purity materials essential for semiconductor production, created additional supply chain vulnerabilities for smart appliance manufacturers. The semiconductor shortage particularly affects premium connected appliances, where advanced chips enable AI features and energy management capabilities that justify higher price points.
Persistent global logistics & parts shortages
Supply chain resilience remains compromised despite post-pandemic recovery efforts, with component availability creating production bottlenecks that limit manufacturers' ability to meet demand surges. The 2021-2024 Quadrennial Supply Chain Review identifies appliance-critical components among vulnerable supply chains, emphasizing the need for domestic manufacturing investment and supplier diversification. Power transformer shortages, with lead times extending to 2-4 years and 80% price increases since the pandemic, affect the electrical infrastructure supporting appliance manufacturing facilities. Manufacturers are responding through vertical integration strategies, with GE Appliances' USD 490 million Kentucky investment including in-house production of critical washer components to reduce external dependencies. The challenge is particularly acute for smaller manufacturers lacking the scale to secure priority supplier relationships or invest in backward integration.
*Our forecasts treat driver/restraint impacts as directional, not additive. The impact forecasts reflect baseline growth, mix effects, and variable interactions.
United States Home Appliance Market Segment Analysis
By Product Type:
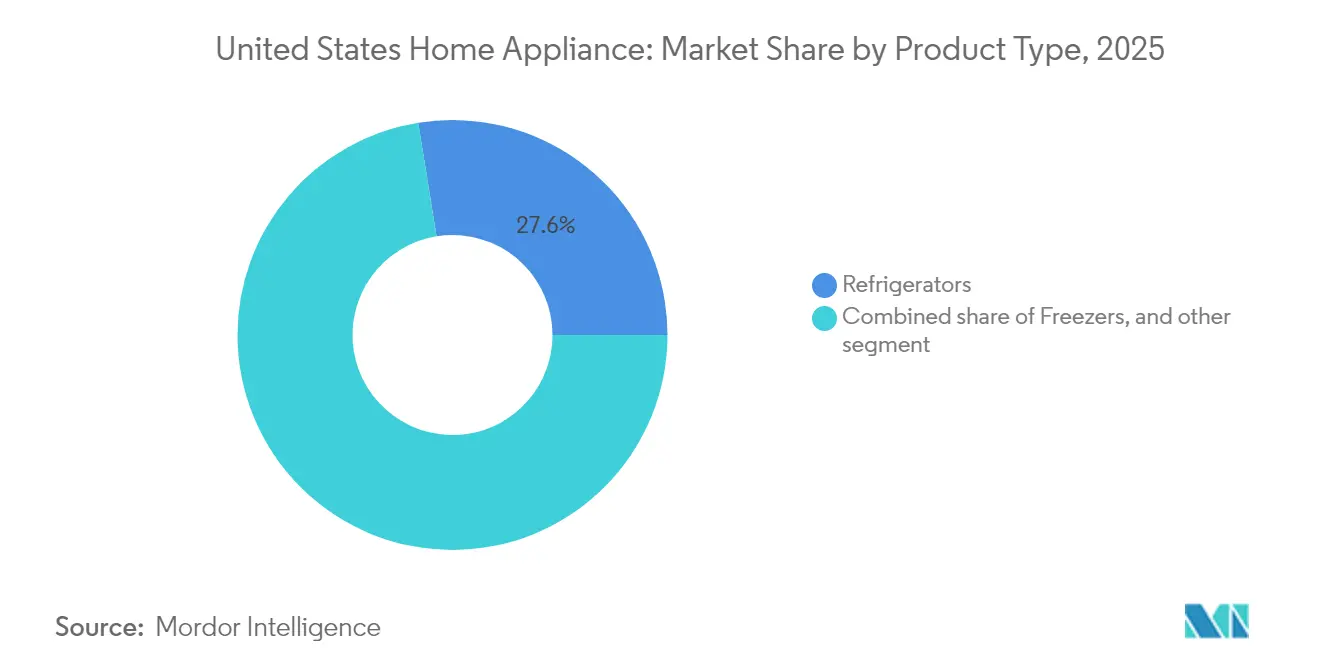
Smart features unlock premium refrigeration demandRefrigerators held a commanding 27.55% share of the United States home appliance market in 2025, confirming their status as the category anchor for most retailers. Within that base, smart refrigerators are racing ahead at a 11.86% CAGR, fueled by AI-enhanced food tracking and voice-controlled user interfaces that allow consumers to minimize waste and manage energy use. The United States home appliance market size for refrigerators reached USD 24.04 billion in 2025, and incremental growth increasingly skews toward feature-rich variants. Washing machines followed with 24.95% share thanks to steady replacement cycles and shifts toward high-efficiency top loaders, while ovens captured 17.72% share as induction technology builds momentum in electrification-focused states.
Momentum is also evident in floor-care and countertop segments. Vacuum cleaners represented 9.48% of 2025 sales, but robotic units continue to outpace traditional formats as mapping accuracy and smart-home integration improve. Social-media-driven enthusiasm for air fryers, coffee systems, and multicookers widens the small-appliance addressable base and generates aftermarket opportunities for specialized accessories. GE Appliances’ Cookcam™ AI, which identifies food and recommends settings in real time, illustrates how embedded intelligence can differentiate even mature cooking appliances.

By Distribution Channel:
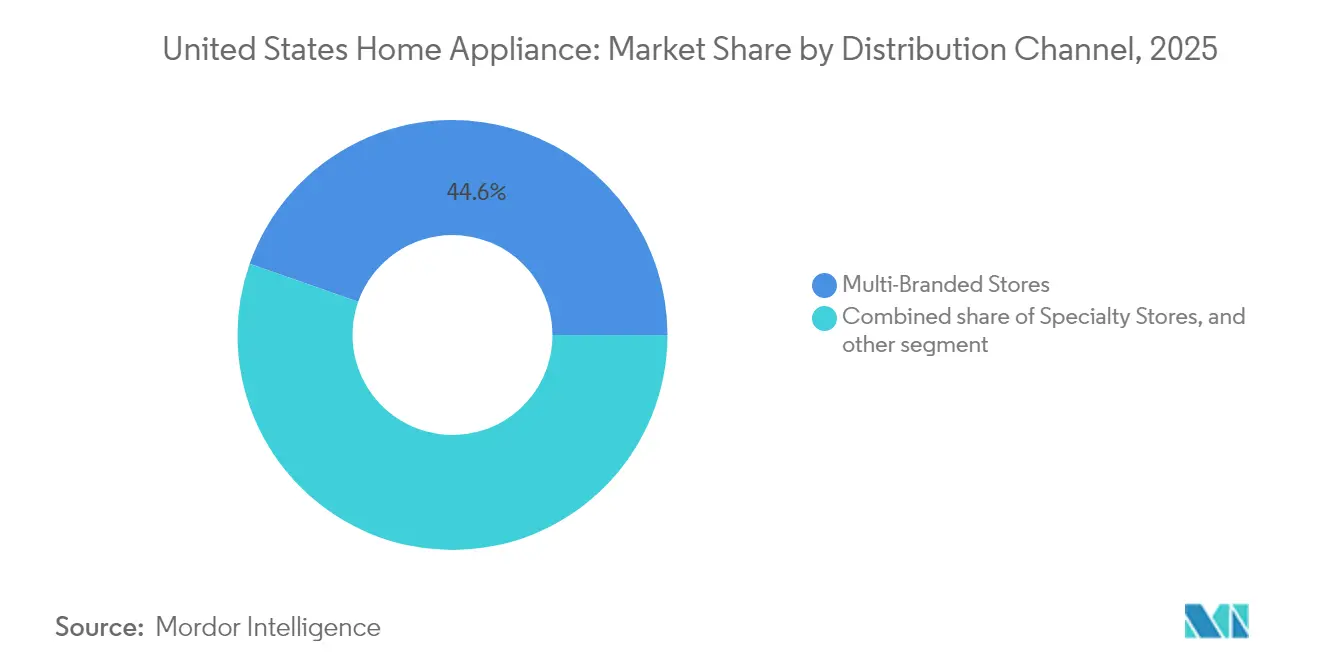
Digital expansion erodes in-store dominanceMulti-branded stores accounted for 44.62% of the United States home appliance market share in 2025, reflecting entrenched consumer habits for tactile evaluation and bundled installation services. Yet e-commerce revenue is climbing at a 13.05% CAGR as virtual showroom tools close the experiential gap and last-mile carriers refine two-man delivery and haul-away services. Average online ticket size sits at USD 890 versus USD 940 in-store, indicating price transparency advantages for digital shoppers. Specialty showrooms secure 28.35% of value by curating premium assortments and leveraging white-glove services such as in-home consultations and warranty concierge support. Direct-to-consumer platforms post a 10.25% CAGR as manufacturers seek richer data and higher gross margins, while warehouse clubs like Costco leverage membership economics to punch above their 2% aggregate share with a 6% slot among club patrons.
Retailers continue heavy omnichannel investment. Home Depot’s appliance call-center integration and Lowe’s same-day pickup programs aim to blunt e-commerce leakage, while Best Buy pilots AR-enabled product visualization to revive lost share. As the United States home appliance market evolves, successful channels will synchronize personalized digital content with reliable in-home service execution.
By Technology:
Interoperability accelerates connected-appliance rolloutConventional platforms retained 60.55% of 2025 revenue, but the connected-appliance cohort is forecast to expand at a robust 15.95% CAGR through 2031 as Matter 1.3 resolves inter-brand compatibility friction. Smart units already command clear price premiums often 20%–30% above conventional peers and early adopters cite energy savings and automation convenience as top purchase drivers. Energy-efficient appliances captured 25.62% share and are growing 9.12% annually, bolstered by rebate stacking from utilities and state programs. The United States home appliance market size benefit from technology cross-pollination, where conventional insulation advances such as Whirlpool’s SlimTech™ reduce energy draw without necessitating connectivity.
Heat-pump water-heater mandates taking effect in 2029 will trigger a broad technology reset for the category, transforming once-niche units into default replacements. Brands balancing R&D between AI features, efficiency gains, and regulatory compliance should capture disproportionate share in the next product-refresh cycle.
Geography Analysis
The South dominated with 36.35% of United States home appliance market share in 2025 on the back of robust housing starts and population inflows. However, its projected 2.98% CAGR through 2031 trails the national average as price-sensitive customers temper smart-feature uptake, especially in rural areas where lower electricity tariffs reduce payback motivation. Texas and Florida anchor demand, with post-hurricane replacement surges creating opportunistic sales peaks that manufacturers address via flexible production scheduling. Builders in large suburban developments still favor conventional appliance bundles to manage cost, moderating short-term premium-segment penetration.
The West accounts for 28.15% of 2025 revenue but leads on growth at 5.48% CAGR, propelled by municipal gas bans and high electricity prices that make induction cooking and energy-monitoring features attractive. California’s Title 24 standards, combined with early EV adoption, elevate whole-home load management into a mainstream consumer requirement, strengthening value propositions for connected appliances and grid-interactive water heaters. Nevada’s 10% electrical-goods sales growth and marquee renewable-energy infrastructure projects signal broad regional upside, especially for heat-pump technologies tailored to desert climates.
The Northeast holds 18.55% of sales, characterized by an older housing stock that favors retrofit solutions. Stringent weatherization and electrification objectives underpin steady demand for heat-pump water heaters and induction ranges, while higher urban density supports e-commerce penetration despite last-mile delivery complexities. The Midwest rounds out the national picture with stable but slower expansion, buoyed by local manufacturing footprints that give Whirlpool and GE Appliances freight-cost advantages. Regional differentiation highlights how utilities, building codes, and climate profiles steer localized product mixes, requiring brands to maintain agile SKU assortments across sales territories.
Regulatory Landscape
The United States home appliance market works within a dual compliance stack, with energy conservation rules led by the U.S. Department of Energy (DOE) and product safety oversight led by the U.S. Consumer Product Safety Commission (CPSC). ENERGY STAR and other voluntary efficiency signals also shape retailer assortments and utility rebate eligibility. Policy direction has varied through the current cycle, with DOE actions in February 2025 suspending certain efficiency mandates for covered appliances, while longer-dated federal efficiency timelines referenced in the report, including upcoming cooking-product and water-heater efficiency steps, continue to guide product roadmaps and certification planning.
On safety and trade compliance, CPSC moved toward risk-based enforcement, formalized in its FY 2026 Operating Plan approved in January 2026, and tightened compliance administration for imports. A key operational change for manufacturers and importers is CPSC mandatory electronic filing (eFiling) for certificate-of-compliance data for imported consumer products, including appliances, which took effect on July 8, 2026. This increases documentation readiness, importer recordkeeping, and supplier traceability as practical go-to-market requirements for cross-border appliance flows.
Value Chain Analysis
The U.S. home appliance value chain runs from upstream raw materials and critical components such as steel, aluminum, resins, compressors, electronic control modules, and semiconductors, to midstream manufacturing and assembly through both domestic plants and import-based sourcing. Downstream channels include multi-branded stores, specialty showrooms, e-commerce, and direct-to-consumer models, supported by two-man delivery, installation, haul-away, and warranty service networks. Cost and availability of steel and electronics remain central value drivers, with the report context also highlighting component constraints, including semiconductor-linked vulnerabilities for connected appliances and long lead times in grid-related electrical equipment.
Tariff and localization dynamics have also become central to how value is captured and risks are managed across tiers. The June 2025 move to a 50% steel tariff on steel-containing appliances and subcomponents increased incentives to localize sourcing and production, pushing manufacturers to rebalance bills of materials, qualify domestic suppliers, and invest in automation to protect margins and lead times. Reshoring and supplier-localization actions, including GE Appliances expanding U.S. manufacturing and awarding new U.S. supplier contracts, reinforce a value chain that increasingly prioritizes domestic supplier ecosystems, dual sourcing, and tighter inbound-quality and compliance documentation for both factory output and imported inputs.
Competitive Landscape
The market remains moderately concentrated, dominated by a handful of key players. Whirlpool holds a leading position, supported by its extensive product range and strong dealer network. GE Appliances follows closely, benefiting from Haier’s investment support and a major domestic expansion initiative announced in August 2025. LG and Samsung also maintain strong positions, successfully capitalizing on demand for premium smart features, even amid challenges like rising raw material costs. BSH strengthens niche leadership in dishwashers on the back of a 5.5% R&D spend ratio, underscoring the innovation premium in mature categories.
Strategic shifts toward domestic manufacturing are reshaping the competitive landscape. Manufacturers are increasingly investing in U.S. production to offset the impact of 50% steel tariffs and persistent bottlenecks in trans-Pacific shipping. LG’s $100 million expansion in Tennessee includes new refrigerator production lines and a 560,000-square-foot warehouse, improving logistics and service for Southeast U.S. dealers. Similarly, Miele’s Alabama facility reflects a broader reshoring trend, particularly in the premium cooking appliances segment. These moves not only improve supply chain resilience but also enhance brands’ responsiveness to regional demand.
The market now favors companies that combine localized production with advanced digital ecosystems. Home appliances are evolving from standalone products to connected service platforms, with interoperability and smart integration becoming key differentiators. Consumers increasingly expect appliances that seamlessly integrate into their smart homes and offer ongoing value through software updates and energy management features. This shift is creating opportunities for brands to build long-term customer relationships beyond the initial sale. As a result, the future of competition in the U.S. home appliance market will hinge on both technological innovation and supply chain agility.
United States Home Appliance Industry Leaders
-
Whirlpool Corporation
-
GE Appliances (Haier
-
LG Electronics USA
-
Samsung Electronics America
-
BSH Home Appliances (Bosch, Thermador)
- *Disclaimer: Major Players sorted in no particular order
United States Home Appliance Market Companies Covered in this Report
- Whirlpool Corporation
- GE Appliances (Haier)
- LG Electronics USA
- Samsung Electronics America
- BSH Home Appliances (Bosch, Thermador)
- Electrolux North America
- Sub-Zero Group
- Miele USA
- Panasonic North America
- Sharp Home Electronics USA
- Dyson Inc.
- iRobot Corporation
- Breville USA
- Keurig Dr Pepper
- Instant Brands
- Traeger Inc.
- Weber Inc.
- Hamilton Beach Brands
- Spectrum Brands (Home & Personal Care)
- SharkNinja
Market Opportunities and Future Outlook
Electrification and efficiency-led replacement create whitespace where incentives and standards intersect with product refresh cycles, particularly in heat-pump adjacent categories and in cooking electrification. The Inflation Reduction Act programs referenced in the report, including the Energy Efficient Home Improvement Credit and the High-Efficiency Electric Home Rebate Program, provide a near-term pathway for retailers and OEMs to package qualifying appliances with installation services and financing. ENERGY STAR Most Efficient positioning and DOE compliance timelines also keep efficiency upgrades visible in consumer decision-making. Evidence from company activity aligns with this opportunity set, with GE Appliances expanding its heat-pump water-heater and smart-hybrid offerings and Samsung commercializing AI-forward kitchen platforms that can be positioned around energy management and interoperability (Matter-ready ecosystems).
Manufacturing localization and automation form a second opportunity area. The focus is not only on reducing tariff and logistics exposure, but also on improving speed-to-market for high-mix SKUs, including smart and premium refrigeration and laundry. The investment cadence provides supporting proof points: GE Appliances announced major multi-year U.S. manufacturing expansion and followed with targeted 2026 plant upgrades in refrigeration, while Whirlpool announced a 2026 investment to produce washer and dryer components in Ohio. Together, these actions expand the domestic supply base for key subassemblies, create room for local supplier development, and support faster iteration on connected features and compliant efficiency designs across major-appliance categories.
Recent Industry Developments in United States Home Appliance Market
- April 2026: GE Appliances announced a USD 28 million investment in equipment upgrades at its Decatur, Alabama refrigeration facility, adding automated thermoforming capability for refrigerator liner production. The upgrade extends the company's broader U.S. manufacturing expansion program and supports higher-throughput, quality-controlled production for a core major-appliance category.
- August 2025: GE Appliances committed USD 3 billion over five years to expand U.S. manufacturing across 11 plants in multiple states. The program raises the competitive bar on localization, supplier qualification, and capacity availability for high-volume categories such as laundry and refrigeration.
- April 2024: Whirlpool closed its transaction combining its European major domestic appliance business with Arcelik to form Beko Europe. The portfolio move refocused capital and management attention, reinforcing North America as a strategic center for investment and product-platform updates.
United States Home Appliance Market Report Scope and Research Methodology
Market Definition and Coverage
For this study, the market covers revenues generated from home appliances sold for household use across the United States, including major and small appliances, and including smart or connected models when they are sold as appliances.
Scope exclusions: We exclude non-appliance consumer electronics and pure installation or repair services that are billed separately from the appliance sale.
Segments Covered in This Report
- By Product Type
- Major Home Appliances
- Refrigerators
- Freezers
- Dishwashing Machines
- Washing Machines
- Ovens
- Air Conditioners
- Other Major Products (Electric Hobs, Ranges, etc.)
- Small Home Appliances
- Coffee Makers
- Food Processors
- Grills & Toasters
- Vacuum Cleaners
- Juicers & Blenders
- Other Small Appliances (Waffle Makers, Egg Cookers, Air Fryers, Kettles, etc.)
- Major Home Appliances
- By Distribution Channel
- Multi-Branded Stores
- Specialty Stores
- E-Commerce
- Other Distribution Channels
- By Technology
- Smart / Connected Appliances
- Energy-Efficient (? 5-Star, Inverter) Appliances
- Conventional Appliances
- By Region (U.S.)
- Northeast
- Midwest
- South
- West
Data Sources, Market Sizing, and Validation
Desk Research
Desk research was used to map the demand environment and the rulebook for what counts as a home appliance sale in the United States. We referenced public sources such as U.S. Census Bureau retail trade data, Bureau of Economic Analysis consumer spending series, Bureau of Labor Statistics CPI and durable goods indicators, U.S. International Trade Commission trade statistics, and Department of Energy efficiency standards and program updates, which help explain replacement cycles and feature shifts.
In parallel, we reviewed public company filings, investor presentations, retailer category commentary, association publications, and reputed business press to understand channel mix and pricing direction. A few paid subscriptions were also used for company financials and news screening, plus patent databases to sanity check innovation intensity around connectivity and efficiency features. The desk research sources mentioned here are illustrative only, since additional public and paid sources were used for data collection, cross-checking, and clarification.
Primary Interviews and Surveys
Primary work focused on filling the gaps that secondary data usually leaves behind, especially on how units, pricing, and mix are changing by appliance type and selling channel. We spoke with manufacturers, distributors, retailers, and participants in the service ecosystem, then compared themes with independent experts covering the Northeast, Midwest, South, and West to confirm assumptions across different demand patterns.
Distribution of primary research fieldwork respondents
| Company type | Respondent position |
|---|---|
| Top tier: 38% | CXOs: 15% |
| Mid tier: 47% | Functional/Unit leaders: 31% |
| Smaller Players: 15% | Managers: 54% |
Market-Sizing & Forecasting
Sizing starts with a top-down build where household formation, replacement demand, and category-level spending signals are translated into an appliance revenue pool, and then split across major and small appliance groupings using observed mix indicators. The totals are then corroborated through selective bottom-up checks, including sampled price point mapping by product type, channel checks on online versus store-based share, and a limited roll-up of reported revenues for key appliance lines where disclosures allow.
Key inputs used in the model include appliance replacement cadence, housing completions and remodeling activity, CPI-linked price movement for durable goods, import intensity for core categories, penetration of smart or connected features, and shifts in online purchasing for bulky items. Where bottom-up detail is thin (for example, private players with limited disclosures), gaps are handled using conservative share ranges that are pressure-tested with interview feedback and public trade indicators.
For forecasting, we apply scenario analysis supported by time-series smoothing on the base demand drivers, then adjust the path using expert views on the next replacement wave, efficiency-driven upgrades, and promotional pricing behavior. This keeps the forecast explainable, while still allowing the model to respond to changing housing and consumer spending conditions.
Data Validation & Update Cycle
Outputs are validated in a few steps so issues are caught early. We compare implied per-household and per-unit spending against independent signals such as durable goods inflation, trade flows for appliance categories, and channel commentary, then investigate any large variance before final numbers are signed off.
An internal analyst review is completed after the first full model run, and a second check is done after assumptions are updated from primary feedback. The report is refreshed annually, and interim updates are made when material events occur that can change pricing, availability, or demand patterns. Right before delivery, a final pass is completed so clients receive the most current view available at that time.
Mordor Intelligence's United States Home Appliances Market Market Size Compared Against Other Published Estimates
Published market sizes for US home appliances often vary because the scope line is not always drawn in the same place, and the pricing basis can be handled differently. Differences also show up when one estimate leans more on shipment proxies, while another leans more on consumer spend, which can move apart in years with sharp price swings.
Two gap drivers matter most here. Some sources appear to fold in broader household goods or adjacent electronics, which can inflate totals, and some use aggressive price growth assumptions without enough checks against CPI and channel promotions. The spread is also widened when the refresh cadence is slower, since this market can change quickly with housing and replacement cycles, and those changes are captured differently when the 2025 base is re-validated before forecasting.
Benchmark comparison
| Source | Market Size | Gaps in Research Methodology |
|---|---|---|
| Mordor Intelligence | USD 87.26 B (2025) | |
| Industry Research Publisher A | USD 99.35 B (2024) | Uses a different base year and a broader category set in its product list, which can pull in adjacent household goods, and it is less explicit on how price inflation versus volume is separated. |
| Market Analytics Publisher B | USD 136.10 B (2025) | Assumes a faster value expansion path through higher price progression and a wider appliance definition, which can push totals up when replacement volumes are not rising at the same pace. |
The table shows that most of the difference comes from definition breadth and how pricing is projected across the forecast path. By keeping the scope to major and small appliances and tying pricing to observable inflation and channel behavior, the estimate stays closer to a repeatable demand story, which matches the approach applied by Mordor Intelligence.
Key Questions Answered in the Report
What is the current value of the United States home appliance market?
The United States home appliance market size stands at USD 90.06 billion in 2026.
Which product category holds the largest share?
Refrigerators lead with 27.55% share of 2025 revenue.
How fast are smart appliances growing?
Smart and connected models are expanding at a 15.95% CAGR through 2031.
Why is the West region growing quickest?
Electrification mandates, high electricity rates, and early smart-home adoption drive a 5.48% CAGR for the West.
What is the impact of steel tariffs on appliance pricing?
A 50% tariff implemented in 2025 pushed average major-appliance prices up 4% in a single month.
Which companies are expanding U.S. manufacturing?
GE Appliances, LG Electronics, Whirlpool, and Miele all announced significant U.S. capacity investments in 2025.