
| Study Period | 2017 - 2030 |
| Base Year For Estimation | 2024 |
| Forecast Data Period | 2025 - 2030 |
| Market Size (2025) | USD 136.8 Million |
| Market Size (2030) | USD 159 Million |
| CAGR (2025 - 2030) | 3.05 % |
| Market Concentration | Medium |
Major Players*Disclaimer: Major Players sorted in no particular order |


United States Gelatin Market Analysis
The United States Gelatin Market size is estimated at 136.8 million USD in 2025, and is expected to reach 159 million USD by 2030, growing at a CAGR of 3.05% during the forecast period (2025-2030).
The United States gelatin industry is experiencing a significant transformation driven by changing consumer preferences and increasing health consciousness. Manufacturers are responding to the growing demand for functional foods by developing innovative gelatin-based products that offer enhanced nutritional benefits. A notable shift is evident in consumer behavior, with approximately 35% of US households following specific protein-focused diets such as high-protein, paleo, and low-carb regimens. This trend has prompted manufacturers to reformulate their products and expand their protein-enriched product portfolios, particularly in the functional foods category.
The industry is witnessing substantial innovation in product formulations and applications across various sectors. Manufacturers are developing new delivery formats and specialized gelatin grades to meet specific industry requirements. For instance, companies are introducing clean-label protein ingredients from various sources that are naturally rich in amino acids and free from artificial colors, sweeteners, additives, or preservatives. The focus on product innovation is particularly evident in the confectionery sector, where approximately 85% of chocolates and candies sold now contain 200 calories or less, regardless of packaging format.
The personal care and cosmetics sector has emerged as a significant growth area for gelatin applications, driven by increasing consumer awareness of natural ingredients and their benefits. Gelatin's film-forming properties and ability to enhance product effectiveness have made it a preferred ingredient in various beauty and personal care formulations. The industry is witnessing increased demand for gelatin-based products that offer multiple benefits, particularly among diverse ethnic communities, with Hispanic women showing 49% higher interest in multi-purpose beauty products compared to the general population.
The sports nutrition and functional foods segments are experiencing robust growth, supported by increasing health awareness and active lifestyles. Recent data indicates that 67% of US consumers participate in various fitness activities, with 43.3% engaging in individual sports and 52.9% in outdoor sports. This trend has led to increased demand for protein-enriched products, with approximately 80% of American adults consuming high-protein snacks twice daily. Manufacturers are responding by developing specialized gelatin formulations that cater to specific nutritional requirements while maintaining optimal texture and functionality in various applications. Additionally, the integration of collagen peptide and protein hydrolysate in product development is enhancing the appeal of these offerings.
United States Gelatin Market Trends
The growth of the bakery industry is led by large commercial players
- Several small-scale and large-scale players characterize the US bakery industry. There were more than 23,158 retail bakeries in the United States in 2020. California, New York, Texas, Florida, and Illinois are among the top markets for bakeries in the country. In 2020, California alone accounted for about 3,400 bakeries. The aggressive store opening trend set by major players reflects plenty of growth opportunities. As the demand continues to rise, the market is expected to grow over the forecast period.
- Among all bakery products, bread, rolls, and cakes are the most highly consumed products. In 2022, the bread industry recorded price inflation due to the Russia-Ukraine War, which resulted in a 40% rise in wheat prices. The United States, known as the "breadbasket of the world," witnessed hampered wheat, oats, and cooking oil production due to the war. In 2020, wheat production in the country declined by 5.5% due to the COVID-19 pandemic.
- In 2020, stockpiling during the lockdowns boosted the demand for bakery products. The sales value and volume peaked during that year. Increased demand for packaged bread, morning goods, and cookies resulted in a Y-o-Y growth volume of around 7.52% in 2020. After the lockdown period, the sales of sourdough products, cakes, and cookies increased. Chocolate-chip cookies and molasses cookies witnessed high demand due to widespread interest among consumers. About one in five Americans consumes more than three cookies daily. In terms of cookie addiction, Utah tops the list, closely followed by Idaho and Oregon. People from Maine, Alaska, South Dakota, Iowa, and Kansas are the top consumers of chocolate chip cookies.

Understand The Key Trends Shaping This Market
Download PDF
Meat production majorly contributes as a raw material for plant protein ingredient manufacturers
- Gelatin is mainly driven by supply from the meat industry, especially from meat of cattle, chickens, and pigs with bone, and the graph given is the production of all these raw materials considered for gelatin production. As meat consumers, collagen producers account for more than 60%, followed by gelatin. The demand is mainly driven by a strong inclination toward protein and high-protein products across the entire food and beverage sector, especially as a food additive, in the country. Recent advancements in medical research, especially on bone structure and its function, have revolutionized the nutritional approach to optimizing bone health.
- The increasing consumer awareness about gelatin-based products leads to higher production of gelatin, which, along with expanding its application in several industrial segments, is expected to boost the market. The US gelatin market is expected to witness considerable growth of 2.1% during the forecast period due to consumers' lifestyle changes. Manufacturers are increasing their R&D expenditure to develop new kinds of gelatin-enriched products, which, in turn, helps them broaden their customer base and gain a competitive advantage.
- The animal industry's production declined due to the COVID-19 pandemic as production plants shut down across the nation. Gelatin products are mainly used in special dietary applications because their hydrolyzed form is used to protein-fortify dietary foods. Dried, hydrolyzed gelatin contains over 92% protein. Typically, it is blended with other hydrolyzed proteins to balance the nutritional aspects of amino acids. The market is majorly driven by the rise in the usage of gelatin in the functional food industry.

OTHER KEY INDUSTRY TRENDS COVERED IN THE REPORT
- Baby food is expected to witness steady growth post-pandemic
- Sustainable and innovative packaging trends are expected to influence the breakfast cereal market
- Key players are expected to focus on fortification and nutritional enrichment
- The emphasis on awareness and innovation is the driving force behind the growth of the elderly nutrition market
- E-commerce is expected to emerge as one of the most preferred channels
- Sport/performance nutrition is expected to witness significant growth during the forecast period
- The US cosmetics industry is expected to be driven by the synergy of innovation and social media influence
- Innovation is expected to help maintain a steady growth rate
- Consumer preferences are shifting to premium condiments and sauces, away from packaged soups
- Dairy alternatives are expected to witness a significant growth rate
- There are great opportunities for meat alternative products
- Key players focused more on healthy ingredients post-COVID-19
- Rising US feed exports and feed prices are expected to impact production
- The consumption growth of animal protein fuels opportunities for key players in the ingredients segment
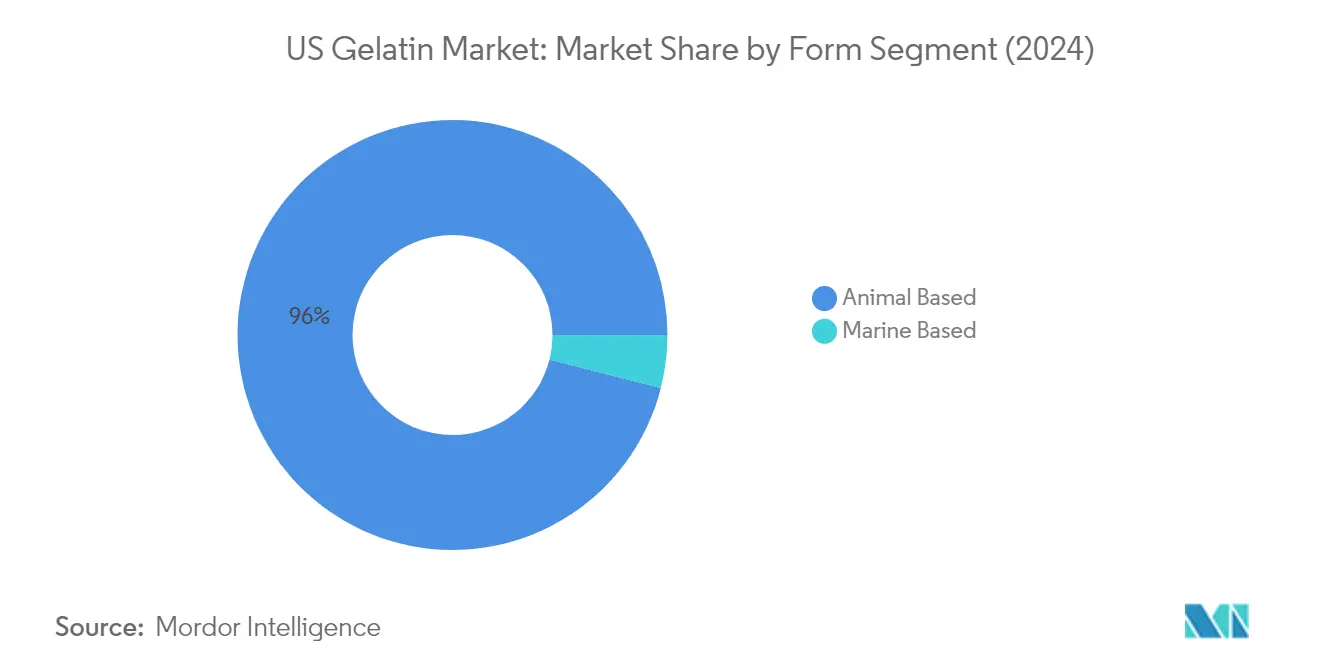
Segment Analysis: Form
Animal-Based Segment in US Gelatin Market
The animal source gelatin segment continues to dominate the US gelatin market, commanding approximately 96% market share in 2024. This substantial market position is primarily attributed to its significantly lower price point, being around 58% cheaper than marine gelatin alternatives, making it a cost-effective choice for manufacturers. The segment's dominance is further strengthened by its widespread acceptance among consumers who are allergic to shellfish and those who are lactose- and gluten-intolerant. Animal-based gelatin's versatility in applications, particularly in the food and beverage sector where it serves as a crucial ingredient in bakery products, confectionery, and dairy items, has solidified its market leadership. The segment's success is also driven by its superior protein content, which is approximately 5% higher than other protein sources, making it particularly attractive for manufacturers of protein-enriched products.
Marine-Based Segment in US Gelatin Market
The marine gelatin segment is projected to exhibit the strongest growth trajectory, with an expected growth rate of approximately 7% during the forecast period 2024-2029. This accelerated growth is primarily driven by increasing consumer awareness of fish gelatin's health benefits and its improved functionalities. The segment's growth is further propelled by its environmental sustainability credentials, as it utilizes about 30% of previously unused fish parts in production. Marine-based gelatin's superior bioavailability, being up to 1.5 times more effective in absorption compared to other forms, is attracting health-conscious consumers. The segment is particularly gaining traction among flexitarian consumers who prefer marine-based ingredients in their food and beverages. The lower molecular weight and size of marine-based gelatin, enabling efficient absorption and quicker transportation across the bloodstream, is making it increasingly popular in premium health and wellness products.
Segment Analysis: End User
Food and Beverages Segment in US Gelatin Market
The Food and Beverages segment continues to dominate the US gelatin market, commanding approximately 99.8% of the total market share in 2024. This overwhelming dominance is primarily attributed to the extensive application of gelatin across various food and beverage categories, including bakery products, confectionery, dairy products, and beverages. The segment's strong position is reinforced by the increasing consumer preference for protein-enriched food products and the versatile functional properties of gelatin in food applications. The rising demand for healthy, protein-fortified foods and beverages, coupled with gelatin's unique properties as a stabilizer, thickener, and gelling agent, has further consolidated its position as the primary end-user segment in the market.
Personal Care and Cosmetics Segment in US Gelatin Market
The Personal Care and Cosmetics segment is emerging as the fastest-growing end-user segment in the US gelatin market, projected to expand at a CAGR of approximately 7% during 2024-2029. This robust growth is driven by increasing consumer awareness about protein-based personal care products and their benefits for skin and hair health. The segment's growth is further propelled by the rising demand for natural and clean beauty products, with gelatin being increasingly incorporated into various cosmetic formulations due to its film-forming properties and ability to improve product texture. The trend toward premium personal care products and the growing preference for protein-enriched skincare solutions are expected to sustain this segment's rapid growth trajectory in the coming years.
Remaining Segments in End User Segmentation
The supplements segment, while smaller in market share, plays a vital role in the US gelatin market by catering to specific consumer needs in the health and wellness sector. This segment primarily focuses on providing gelatin-based supplements for joint health, bone strength, and protein supplementation. The segment's growth is supported by increasing health consciousness among consumers and the growing recognition of gelatin's nutritional benefits. The supplements segment continues to evolve with new product innovations and formulations, particularly targeting sports nutrition and elderly care markets.
United States Gelatin Industry Overview
Top Companies in United States Gelatin Market
The US gelatin market is characterized by companies focusing heavily on product innovations and strategic expansions to strengthen their market positions. Major players are investing significantly in research and development to introduce new gelatin grades and delivery formats, particularly targeting the pharmaceutical gelatin and nutraceutical sectors. Companies are expanding their production capabilities and geographical reach through strategic partnerships and facility expansions. The industry witnesses continuous product development initiatives, especially in specialized segments like marine-based gelatin and pharmaceutical-grade products. Manufacturers are also emphasizing sustainability and clean-label solutions, developing organic variants and environmentally conscious production processes. The competitive landscape shows a strong focus on obtaining various certifications and quality standards to enhance product credibility and market acceptance.
Consolidated Market Led By Global Players
The US gelatin market demonstrates a high level of consolidation, with established global players dominating the landscape. These multinational corporations leverage their extensive research capabilities, advanced manufacturing facilities, and strong distribution networks to maintain their market positions. The market structure favors companies with integrated operations, from raw material sourcing to end-product manufacturing, providing them with better cost control and quality assurance. The presence of specialized manufacturers focusing on specific applications or source materials adds diversity to the competitive landscape, though their market share remains relatively small compared to the industry leaders.
The market shows limited merger and acquisition activity, with companies preferring organic growth through capacity expansion and product development. Major players are increasingly focusing on vertical integration to ensure supply chain stability and quality control. The competitive dynamics are influenced by the companies' ability to maintain strong relationships with both raw material suppliers and end-users across various industries. Regional players are carving out niches in specific application areas or geographical regions, while global players continue to strengthen their presence through strategic partnerships and distribution agreements.
Innovation and Sustainability Drive Future Success
Success in the gelatin market increasingly depends on companies' ability to innovate while maintaining sustainable practices. Incumbent players need to focus on developing specialized products for high-growth applications while maintaining cost competitiveness through operational efficiency. Companies must invest in research and development to create unique formulations that address specific industry needs, particularly in the pharmaceutical and nutraceutical sectors. Building strong relationships with end-users through technical support and customization capabilities will become increasingly important for maintaining market share. Established players need to balance between maintaining their traditional product lines and investing in emerging applications.
New entrants and smaller players can gain ground by focusing on underserved market segments and developing innovative solutions for specific applications. Success factors include establishing strong quality control systems, obtaining relevant certifications, and building reliable supply chain networks. Companies need to consider potential regulatory changes, particularly regarding raw material sourcing and production processes. The ability to adapt to changing consumer preferences, especially regarding clean-label and natural products, will be crucial. Future success will also depend on companies' ability to manage raw material costs while maintaining product quality and meeting sustainability requirements.
United States Gelatin Market Leaders
-
Ajinomoto Co. Inc.
-
Darling Ingredients Inc.
-
Gelatines Weishardt SAS
-
GELITA AG
-
Nitta Gelatin Inc.
- *Disclaimer: Major Players sorted in no particular order

Need More Details on Market Players and Competiters?
Download PDF
United States Gelatin Market News
- May 2021: Darling Ingredients Inc. announced that its Rousselot brand expanded its range of purified, pharmaceutical-grade, and modified gelatin with the launch of X-Pure® GelDAT – Gelatin Desaminotyrosine.
- January 2021: Nitta Gelatin India has introduced an international-standard fine-grade gelatin under its Hotel/Restaurant/Catering (HoReCa) business. The superior-grade gelatin is produced using Japanese technology in accordance with Good Manufacturing Practice (GMP) and the Hazard Analysis and Critical Control Point (HACCP) system, in line with the European Regulation hygiene standards (EC). This gelatin is derived from natural sources that contain all essential amino acids except tryptophan.
- November 2020: Rousselot launched a new delivery format, the gummy caps, for nutraceutical and pharmaceutical gelatin ingredients offered under its SiMoGel brand, enabling manufacturers to tap into the growing popularity of chews and gummies. Gummy caps combine the benefits of capsules, soft gels, and gummies in a single delivery format. Created with SiMoGel in a starchless depositing process, gummy caps can be used to deliver a broad range of active ingredients at highly accurate dosages, from nutritional solutions to OTC products.
Free With This Report
We provide a comprehensive and exhaustive set of data pointers for global, regional, and country-level metrics that illustrate the fundamentals of the protein industry. With the help of 45+ free charts, clients can access in-depth market analysis based on per capita consumption of animal and plant protein, end-user market volume, and production data of raw materials for protein ingredients, through granular-level segmental information supported by a repository of market data, trends, and expert analysis. Data and analysis on protein sources, protein types, forms, end-user segments, etc., are available in the form of comprehensive reports as well as Excel-based data worksheets.


United States Gelatin Market Report - Table of Contents
1. EXECUTIVE SUMMARY & KEY FINDINGS
2. INTRODUCTION
- 2.1 Study Assumptions & Market Definition
- 2.2 Scope of the Study
- 2.3 Research Methodology
3. KEY INDUSTRY TRENDS
-
3.1 End User Market Volume
- 3.1.1 Baby Food and Infant Formula
- 3.1.2 Bakery
- 3.1.3 Beverages
- 3.1.4 Breakfast Cereals
- 3.1.5 Condiments/Sauces
- 3.1.6 Confectionery
- 3.1.7 Dairy and Dairy Alternative Products
- 3.1.8 Elderly Nutrition and Medical Nutrition
- 3.1.9 Meat/Poultry/Seafood and Meat Alternative Products
- 3.1.10 RTE/RTC Food Products
- 3.1.11 Snacks
- 3.1.12 Sport/Performance Nutrition
- 3.1.13 Animal Feed
- 3.1.14 Personal Care and Cosmetics
-
3.2 Protein Consumption Trends
- 3.2.1 Animal
-
3.3 Production Trends
- 3.3.1 Animal
-
3.4 Regulatory Framework
- 3.4.1 United States
- 3.5 Value Chain & Distribution Channel Analysis
4. MARKET SEGMENTATION (includes market size in Value in USD and Volume, Forecasts up to 2030 and analysis of growth prospects)
-
4.1 Form
- 4.1.1 Animal Based
- 4.1.2 Marine Based
-
4.2 End User
- 4.2.1 Food and Beverages
- 4.2.1.1 By Sub End User
- 4.2.1.1.1 Bakery
- 4.2.1.1.2 Beverages
- 4.2.1.1.3 Condiments/Sauces
- 4.2.1.1.4 Confectionery
- 4.2.1.1.5 Dairy and Dairy Alternative Products
- 4.2.1.1.6 RTE/RTC Food Products
- 4.2.1.1.7 Snacks
- 4.2.2 Personal Care and Cosmetics
- 4.2.3 Supplements
- 4.2.3.1 By Sub End User
5. COMPETITIVE LANDSCAPE
- 5.1 Key Strategic Moves
- 5.2 Market Share Analysis
- 5.3 Company Landscape
-
5.4 Company Profiles (includes Global Level Overview, Market Level Overview, Core Business Segments, Financials, Headcount, Key Information, Market Rank, Market Share, Products and Services, and Analysis of Recent Developments).
- 5.4.1 Ajinomoto Co. Inc.
- 5.4.2 Baotou Dongbao Bio Tech Co. Ltd
- 5.4.3 Darling Ingredients Inc.
- 5.4.4 Gelatines Weishardt SAS
- 5.4.5 GELITA AG
- 5.4.6 Hangzhou Qunli Gelatin Chemical Co. Ltd
- 5.4.7 Italgelatine SpA
- 5.4.8 Lapi Gelatine SpA
- 5.4.9 Nitta Gelatin Inc.
6. KEY STRATEGIC QUESTIONS FOR PROTEIN INGREDIENTS INDUSTRY CEOS
7. APPENDIX
-
7.1 Global Overview
- 7.1.1 Overview
- 7.1.2 Porter’s Five Forces Framework
- 7.1.3 Global Value Chain Analysis
- 7.1.4 Market Dynamics (DROs)
- 7.2 Sources & References
- 7.3 List of Tables & Figures
- 7.4 Primary Insights
- 7.5 Data Pack
- 7.6 Glossary of Terms
You Can Purchase Parts Of This Report. Check Out Prices For Specific Sections
Get Price Break-up Now
List of Tables & Figures
- Figure 1:
- VOLUME OF BABY FOOD AND INFANT FORMULA MARKET, METRIC TON, UNITED STATES, 2017 - 2029
- Figure 2:
- VOLUME OF BAKERY MARKET, METRIC TON, UNITED STATES, 2017 - 2029
- Figure 3:
- VOLUME OF BEVERAGES MARKET, METRIC TON, UNITED STATES, 2017 - 2029
- Figure 4:
- VOLUME OF BREAKFAST CEREALS MARKET, METRIC TON, UNITED STATES, 2017 - 2029
- Figure 5:
- VOLUME OF CONDIMENTS/SAUCES MARKET, METRIC TON, UNITED STATES, 2017 - 2029
- Figure 6:
- VOLUME OF CONFECTIONERY MARKET, METRIC TON, UNITED STATES, 2017 - 2029
- Figure 7:
- VOLUME OF DAIRY AND DAIRY ALTERNATIVE PRODUCTS MARKET, METRIC TON, UNITED STATES, 2017 - 2029
- Figure 8:
- VOLUME OF ELDERLY NUTRITION AND MEDICAL NUTRITION MARKET, METRIC TON, UNITED STATES, 2017 - 2029
- Figure 9:
- VOLUME OF MEAT/POULTRY/SEAFOOD AND MEAT ALTERNATIVE PRODUCTS MARKET, METRIC TON, UNITED STATES, 2017 - 2029
- Figure 10:
- VOLUME OF RTE/RTC FOOD PRODUCTS MARKET, METRIC TON, UNITED STATES, 2017 - 2029
- Figure 11:
- VOLUME OF SNACKS MARKET, METRIC TON, UNITED STATES, 2017 - 2029
- Figure 12:
- VOLUME OF SPORT/PERFORMANCE NUTRITION MARKET, METRIC TON, UNITED STATES, 2017 - 2029
- Figure 13:
- VOLUME OF ANIMAL FEED MARKET, METRIC TON, UNITED STATES, 2017 - 2029
- Figure 14:
- VOLUME OF PERSONAL CARE AND COSMETICS MARKET, METRIC TON, UNITED STATES, 2017 - 2029
- Figure 15:
- AVERAGE PER CAPITA CONSUMPTION OF ANIMAL PROTEIN, GRAM PER DAY, UNITED STATES, 2017 - 2029
- Figure 16:
- MEAT PRODUCTION, METRIC TON, UNITED STATES, 2017 - 2022
- Figure 17:
- VOLUME OF GELATIN MARKET, TONNES, UNITED STATES, 2017 - 2029
- Figure 18:
- VALUE OF GELATIN MARKET, USD, UNITED STATES, 2017 - 2029
- Figure 19:
- VOLUME OF GELATIN MARKET BY FORM, METRIC TONNES, UNITED STATES, 2017 - 2029
- Figure 20:
- VALUE OF GELATIN MARKET BY FORM, USD, UNITED STATES, 2017 - 2029
- Figure 21:
- VALUE SHARE OF GELATIN MARKET BY FORM, %, UNITED STATES, 2017 VS 2023 VS 2029
- Figure 22:
- VOLUME SHARE OF GELATIN MARKET BY FORM, %, UNITED STATES, 2017 VS 2023 VS 2029
- Figure 23:
- VOLUME OF GELATIN MARKET, ANIMAL BASED, METRIC TONNES, UNITED STATES, 2017 - 2029
- Figure 24:
- VALUE OF GELATIN MARKET, ANIMAL BASED, USD, UNITED STATES, 2017 - 2029
- Figure 25:
- VALUE SHARE OF GELATIN MARKET BY END USER, % ANIMAL BASED , UNITED STATES, 2022 VS 2029
- Figure 26:
- VOLUME OF GELATIN MARKET, MARINE BASED, METRIC TONNES, UNITED STATES, 2017 - 2029
- Figure 27:
- VALUE OF GELATIN MARKET, MARINE BASED, USD, UNITED STATES, 2017 - 2029
- Figure 28:
- VALUE SHARE OF GELATIN MARKET BY END USER, % MARINE BASED , UNITED STATES, 2022 VS 2029
- Figure 29:
- VOLUME OF GELATIN MARKET BY END USER, METRIC TONNES, UNITED STATES, 2017 - 2029
- Figure 30:
- VALUE OF GELATIN MARKET BY END USER, USD, UNITED STATES, 2017 - 2029
- Figure 31:
- VALUE SHARE OF GELATIN MARKET BY END USER, %, UNITED STATES, 2017 VS 2023 VS 2029
- Figure 32:
- VOLUME SHARE OF GELATIN MARKET BY END USER, %, UNITED STATES, 2017 VS 2023 VS 2029
- Figure 33:
- VOLUME OF GELATIN MARKET, FOOD AND BEVERAGES END USER, METRIC TONNES, UNITED STATES, 2017 - 2029
- Figure 34:
- VALUE OF GELATIN MARKET, FOOD AND BEVERAGES END USER, USD, UNITED STATES, 2017 - 2029
- Figure 35:
- VALUE SHARE OF GELATIN MARKET BY FOOD AND BEVERAGES END USER, %, UNITED STATES, 2017 VS 2023 VS 2029
- Figure 36:
- VOLUME SHARE OF GELATIN MARKET BY FOOD AND BEVERAGES END USER, %, UNITED STATES, 2017 VS 2023 VS 2029
- Figure 37:
- VOLUME OF GELATIN MARKET, BAKERY, METRIC TONNES, UNITED STATES, 2017 - 2029
- Figure 38:
- VALUE OF GELATIN MARKET, BAKERY, USD, UNITED STATES, 2017 - 2029
- Figure 39:
- VALUE SHARE OF GELATIN MARKET BY FORM, % BAKERY , UNITED STATES, 2022 VS 2029
- Figure 40:
- VOLUME OF GELATIN MARKET, BEVERAGES, METRIC TONNES, UNITED STATES, 2017 - 2029
- Figure 41:
- VALUE OF GELATIN MARKET, BEVERAGES, USD, UNITED STATES, 2017 - 2029
- Figure 42:
- VALUE SHARE OF GELATIN MARKET BY FORM, % BEVERAGES , UNITED STATES, 2022 VS 2029
- Figure 43:
- VOLUME OF GELATIN MARKET, CONDIMENTS/SAUCES, METRIC TONNES, UNITED STATES, 2017 - 2029
- Figure 44:
- VALUE OF GELATIN MARKET, CONDIMENTS/SAUCES, USD, UNITED STATES, 2017 - 2029
- Figure 45:
- VALUE SHARE OF GELATIN MARKET BY FORM, % CONDIMENTS/SAUCES , UNITED STATES, 2022 VS 2029
- Figure 46:
- VOLUME OF GELATIN MARKET, CONFECTIONERY, METRIC TONNES, UNITED STATES, 2017 - 2029
- Figure 47:
- VALUE OF GELATIN MARKET, CONFECTIONERY, USD, UNITED STATES, 2017 - 2029
- Figure 48:
- VALUE SHARE OF GELATIN MARKET BY FORM, % CONFECTIONERY , UNITED STATES, 2022 VS 2029
- Figure 49:
- VOLUME OF GELATIN MARKET, DAIRY AND DAIRY ALTERNATIVE PRODUCTS, METRIC TONNES, UNITED STATES, 2017 - 2029
- Figure 50:
- VALUE OF GELATIN MARKET, DAIRY AND DAIRY ALTERNATIVE PRODUCTS, USD, UNITED STATES, 2017 - 2029
- Figure 51:
- VALUE SHARE OF GELATIN MARKET BY FORM, % DAIRY AND DAIRY ALTERNATIVE PRODUCTS , UNITED STATES, 2022 VS 2029
- Figure 52:
- VOLUME OF GELATIN MARKET, RTE/RTC FOOD PRODUCTS, METRIC TONNES, UNITED STATES, 2017 - 2029
- Figure 53:
- VALUE OF GELATIN MARKET, RTE/RTC FOOD PRODUCTS, USD, UNITED STATES, 2017 - 2029
- Figure 54:
- VALUE SHARE OF GELATIN MARKET BY FORM, % RTE/RTC FOOD PRODUCTS , UNITED STATES, 2022 VS 2029
- Figure 55:
- VOLUME OF GELATIN MARKET, SNACKS, METRIC TONNES, UNITED STATES, 2017 - 2029
- Figure 56:
- VALUE OF GELATIN MARKET, SNACKS, USD, UNITED STATES, 2017 - 2029
- Figure 57:
- VALUE SHARE OF GELATIN MARKET BY FORM, % SNACKS , UNITED STATES, 2022 VS 2029
- Figure 58:
- VOLUME OF GELATIN MARKET, PERSONAL CARE AND COSMETICS, UNITED STATES, 2017 - 2029
- Figure 59:
- VALUE OF GELATIN MARKET, PERSONAL CARE AND COSMETICS, UNITED STATES, 2017 - 2029
- Figure 60:
- VALUE SHARE OF GELATIN MARKET BY FORM, % PERSONAL CARE AND COSMETICS , UNITED STATES, 2022 VS 2029
- Figure 61:
- MOST ACTIVE COMPANIES BY NUMBER OF STRATEGIC MOVES, COUNT, UNITED STATES GELATIN MARKET, 2017 - 2022
- Figure 62:
- MOST ADOPTED STRATEGIES, COUNT, UNITED STATES, 2017 - 2022
- Figure 63:
- VALUE SHARE OF MAJOR PLAYERS, %, UNITED STATES GELATIN MARKET
United States Gelatin Industry Segmentation
Animal Based, Marine Based are covered as segments by Form. Food and Beverages, Personal Care and Cosmetics, Supplements are covered as segments by End User.| Form | Animal Based | |||
| Marine Based | ||||
| End User | Food and Beverages | By Sub End User | Bakery | |
| Beverages | ||||
| Condiments/Sauces | ||||
| Confectionery | ||||
| Dairy and Dairy Alternative Products | ||||
| RTE/RTC Food Products | ||||
| Snacks | ||||
| Personal Care and Cosmetics | ||||
| Supplements | By Sub End User | |||
Need A Different Region or Segment?
Customize Now
Market Definition
- End User - The Protein Ingredients Market operates on a B2B basis. Food, Beverages, Supplements, Animal Feed, and Personal Care & Cosmetic manufacturers are considered to be end-consumers in the market studied. The scope excludes manufacturers buying liquid/dry whey to be used for application as a binding agent or thickener or other non-protein applications.
- Penetration Rate - Penetration Rate is defined as the percentage of Protein-Fortified End User Market Volume in the Overall End User Market Volume.
- Average Protein Content - Average protein content is the average protein content present per 100 g of product manufactured by all end-user companies considered under the scope of this report.
- End User Market Volume - End-user market volume is the consolidated volume of all types and forms of end-user products in the country or region.
| Keyword | Definition |
|---|---|
| Alpha-lactalbumin (α-Lactalbumin) | It is a protein that regulates the production of lactose in the milk of almost all mammalian species. |
| Amino acid | It is an organic compound that contains both amino and carboxylic acid functional groups, which are required for the synthesis of body protein and other important nitrogen-containing compounds, such as creatine, peptide hormones, and some neurotransmitters. |
| Blanching | It is the process of briefly heating vegetables with steam or boiling water. |
| BRC | British Retail Consortium |
| Bread improver | It is a flour-based blend of several components with specific functional properties designed to modify dough characteristics and give quality attributes to bread. |
| BSF | Black Soldier Fly |
| Caseinate | It is a substance produced by adding an alkali to acid casein, a derivative of casein. |
| Celiac disease | Celiac disease is an immune reaction to eating gluten, a protein found in wheat, barley, and rye. |
| Colostrum | It is a milky fluid that’s released by mammals that have recently given birth before breast milk production begins. |
| Concentrate | It is the least processed form of protein and has a protein content ranging from 40-90% by weight. |
| Dry protein basis | It refers to the percentage of "pure protein" present in a supplement after the water in it is completely removed through heat. |
| Dry whey | It is the product resulting from drying fresh whey which has been pasteurized and to which nothing has been added as a preservative. |
| Egg protein | It is a mixture of individual proteins, including ovalbumin, ovomucoid, ovoglobulin, conalbumin, vitellin, and vitellenin. |
| Emulsifier | It is a food additive that facilitates the blending of foods that are immiscible with one another, such as oil and water. |
| Enrichment | It is the process of addition of micronutrients that are lost during the processing of the product. |
| ERS | Economic Research Service of the USDA |
| Extrusion | It is the process of forcing soft mixed ingredients through an opening in a perforated plate or die designed to produce the required shape. The extruded food is then cut to a specific size by blades. |
| Fava | Also known as Faba, it is another word for yellow split beans. |
| FDA | Food and Drug Administration |
| Flaking | It is a process in which typically a cereal grain (like corn, wheat, or rice) is broken down into grits, cooked with flavors and syrups, and then pressed into flakes between cooled rollers. |
| Foaming agent | It is a food ingredient that makes it possible to form or maintain a uniform dispersion of a gaseous phase in a liquid or solid food. |
| Foodservice | It refers to the part of the food industry which includes businesses, institutions, and companies which prepare meals outside the home. It includes restaurants, school and hospital cafeterias, catering operations, and many other formats. |
| Fortification | It is the deliberate addition of micronutrients that are not found in them naturally or which are lost during processing, to improve a food product's nutritional value. |
| FSANZ | Food Standards Australia New Zealand |
| FSIS | Food Safety and Inspection Service |
| FSSAI | Food Safety and Standards Authority of India |
| Gelling agent | It is an ingredient that functions as a stabilizer and thickener to provide thickening without stiffness through the formation of gel. |
| GHG | Greenhouse Gas |
| Gluten | It is a family of proteins found in grains, including wheat, rye, spelt, and barley. |
| Hemp | It is a botanical class of Cannabis sativa cultivars grown specifically for industrial or medicinal use. |
| Hydrolysate | It is a form of protein manufactured by exposing the protein to enzymes that can partially break the bonds between the protein's amino acids and break down large, complicated proteins into smaller pieces. Its processing makes it easier and quicker to digest. |
| Hypoallergenic | It refers to a substance that causes fewer allergic reactions. |
| Isolate | It is the purest and most processed form of protein which has undergone separation to obtain a pure protein fraction. It typically contains ≥ 90% of protein by weight. |
| Keratin | It is a protein that helps form hair, nails, and the outer layer of skin. |
| Lactalbumin | It is the albumin contained in milk and obtained from whey. |
| Lactoferrin | It is an iron‑binding glycoprotein that is present in the milk of most mammals. |
| Lupin | It is the yellow legume seeds of the genus Lupinus. |
| Millenial | Also known as Generation Y or Gen Y, it refers to the people born from 1981 to 1996. |
| Monogastric | It refers to an animal with a single-compartmented stomach. Examples of monogastric include humans, poultry, pigs, horses, rabbits, dogs, and cats. Most monogastric are generally unable to digest much cellulose food materials such as grasses. |
| MPC | Milk protein concentrate |
| MPI | Milk protein isolate |
| MSPI | Methylated soy protein isolate |
| Mycoprotein | Mycoprotein is a form of single-cell protein, also known as fungal protein, derived from fungi for human consumption. |
| Nutricosmetics | It is a category of products and ingredients that act as nutritional supplements to care for skin, nails, and hair natural beauty. |
| Osteoporosis | It is a medical condition in which the bones become brittle and fragile from loss of tissue, typically as a result of hormonal changes, or deficiency of calcium or vitamin D. |
| PDCAAS | Protein digestibility-corrected amino acid score (PDCAAS) is a method of evaluating the quality of a protein based on both the amino acid requirements of humans and their ability to digest it. |
| Per-capita consumption of animal protein | It is the average amount of animal protein (such as milk, whey, gelatin, collagen, and egg proteins) that is readily available for consumption by each person in an actual population. |
| Per-capita consumption of plant protein | It is the average amount of plant protein (such as soy, wheat, pea, oat, and hemp proteins) that is readily available for consumption by each person in an actual population. |
| Quorn | It is a microbial protein manufactured using mycoprotein as an ingredient, in which the fungus culture is dried and mixed with egg albumen or potato protein, which acts as a binder, and then is adjusted in texture and pressed into various forms. |
| Ready-to-Cook (RTC) | It refers to food products that include all of the ingredients, where some preparation or cooking is required through a process that is given on the package. |
| Ready-to-Eat (RTE) | It refers to a food product prepared or cooked in advance, with no further cooking or preparation required before being eaten. |
| RTD | Ready-to-Drink |
| RTS | Ready-to-Serve |
| Saturated fat | It is a type of fat in which the fatty acid chains have all single bonds. It is generally considered unhealthy. |
| Sausage | It is a meat product made of finely chopped and seasoned meat, which may be fresh, smoked, or pickled and which is then usually stuffed into a casing. |
| Seitan | It is a plant-based meat substitute made out of wheat gluten. |
| Softgel | It is a gelatin-based capsule with a liquid fill. |
| SPC | Soy protein concentrate |
| SPI | Soy protein isolate |
| Spirulina | It is a biomass of cyanobacteria that can be consumed by humans and animals. |
| Stabilizer | It is an ingredient added to food products to help maintain or enhance their original texture, and physical and chemical characteristics. |
| Supplementation | It is the consumption or provision of concentrated sources of nutrients or other substances that are intended to supplement nutrients in the diet and is intended to correct nutritional deficiencies. |
| Texturant | It is a specific type of food ingredient that is used to control and alter the mouthfeel and texture of food and beverage products. |
| Thickener | It is an ingredient that is used to increase the viscosity of a liquid or dough and make it thicker, without substantially changing its other properties. |
| Trans fat | Also called trans-unsaturated fatty acids or trans fatty acids, it is a type of unsaturated fat that naturally occurs in small amounts in meat. |
| TSP | Textured soy protein |
| TVP | Textured vegetable protein |
| WPC | Whey protein concentrate |
| WPI | Whey protein isolate |
Need More Details on Market Definition?
Ask a Question
Research Methodology
Mordor Intelligence follows a four-step methodology in all our reports.
- Step-1: Identify Key Variables: The quantifiable key variables (industry and extraneous) pertaining to the specific product segment and country are selected from a group of relevant variables & factors based on desk research & literature review; along with primary expert inputs. These variables are further confirmed through regression modeling (wherever required).
- Step-2: Build a Market Model: In order to build a robust forecasting methodology, the variables and factors identified in Step-1 are tested against available historical market numbers. Through an iterative process, the variables required for market forecast are set and the model is built on the basis of these variables.
- Step-3: Validate and Finalize: In this important step, all market numbers, variables and analyst calls are validated through an extensive network of primary research experts from the market studied. The respondents are selected across levels and functions to generate a holistic picture of the market studied.
- Step-4: Research Outputs: Syndicated Reports, Custom Consulting Assignments, Databases & Subscription Platforms

Get More Details On Research Methodology
Download PDF


