
Market Overview
| Study Period | 2020 - 2031 |
|---|---|
| Forecast Data Period | 2026 - 2031 |
| Base Year Market Size (2025) | USD 67.62 Billion |
| Market Size (2026) | USD 68.90 Billion |
| Market Size (2031) | USD 103.58 Billion |
| Growth Rate (2026 - 2031) | 8.50% CAGR |
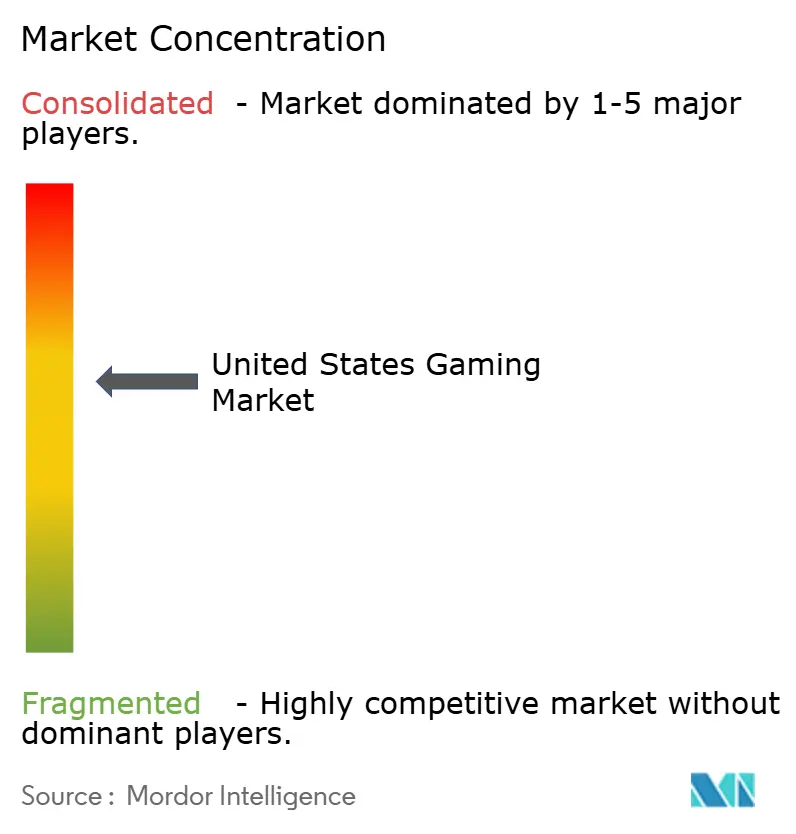
| Market Concentration | Medium |
Major Players *Disclaimer: Major Players sorted in no particular order Image © Mordor Intelligence. Reuse requires attribution under CC BY 4.0. | |
United States Gaming Market Analysis by Mordor Intelligence
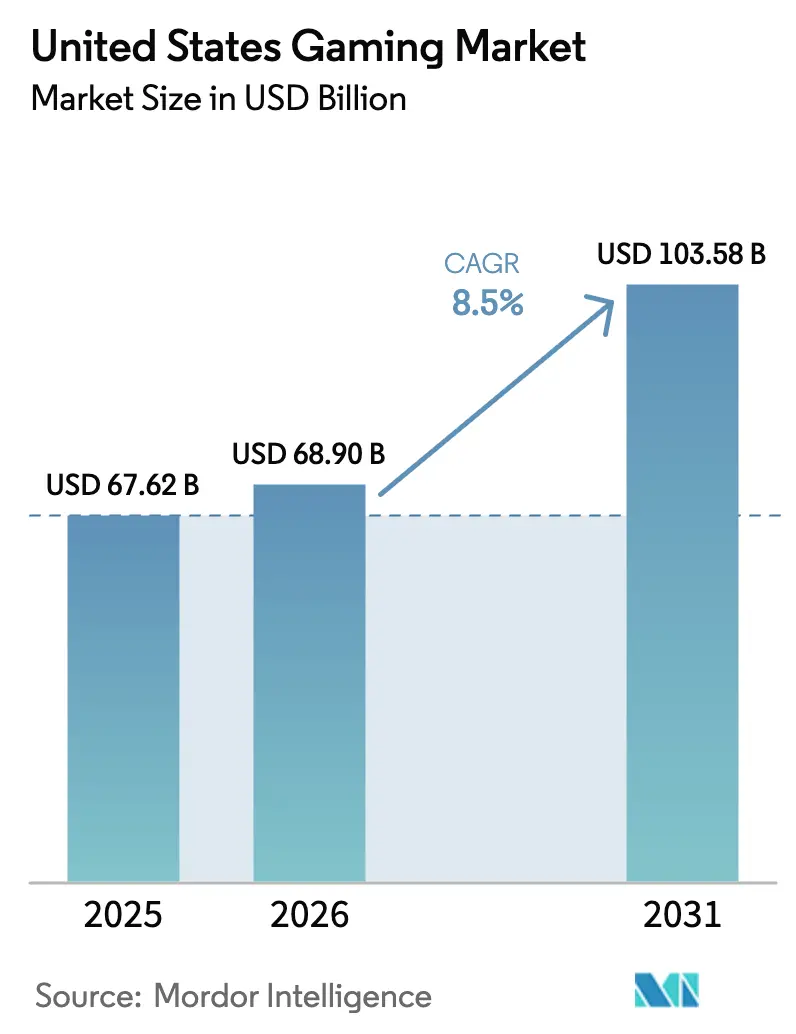
The United States gaming market size was valued at USD 67.62 billion in 2025 and estimated to grow from USD 68.90 billion in 2026 to reach USD 103.58 billion by 2031, at a CAGR of 8.5% during the forecast period (2026-2031). Smartphone penetration above 85% and the rapid rollout of 5G fixed wireless have expanded the reach of the audience while lowering latency thresholds for cloud gaming. Subscription bundles, led by Xbox Game Pass and PlayStation Plus, are steering consumer spending toward recurring-revenue models and compressing the pay-to-own channel. Federal Trade Commission guidance on micro-transactions is nudging publishers to adopt transparent monetization, while also removing regulatory overhang and clarifying compliance costs. Rising capital requirements-AAA budgets now exceed USD 200 million per title-are reinforcing the dominance of deep-pocketed publishers and accelerating studio consolidation.
Key Report Takeaways
- By platform, mobile gaming led with 51.83% of United States gaming market share in 2025, while cloud and streaming gaming is projected to expand at a 9.16% CAGR through 2031.
- By revenue model, in-app purchases captured 62.66% share of the United States gaming market size in 2025, whereas subscription passes are forecast to advance at an 8.74% CAGR to 2031.
- By genre, casual and puzzle titles accounted for 28.64% share of the United States gaming market size in 2025 and sports and racing is anticipated to register the fastest 9.02% CAGR over 2026-2031.
- By gamer demographic, the 18-34 cohort held 44.71% of the United States gaming market share in 2025 and the 45-plus segment is expanding at an 8.96% CAGR through 2031.
Note: Market size and forecast figures in this report are generated using Mordor Intelligence’s proprietary estimation framework, updated with the latest available data and insights as of 2026.
United States Gaming Market Trends and Insights
Drivers Impact Analysis*
| Driver | (~) % Impact on CAGR Forecast | Geographic Relevance | Impact Timeline |
|---|---|---|---|
| Growing cloud-gaming subscriptions | +1.2% | National, with concentrated adoption in urban and suburban areas served by 5G fixed-wireless | Medium term (2-4 years) |
| Rising mobile-gamer base and smartphone penetration | +1.8% | National, with highest penetration in metropolitan statistical areas and among 18-44 age cohorts | Long term (≥ 4 years) |
| Esports media-rights monetization boom | +0.9% | National, with premium valuations in coastal markets and university towns | Medium term (2-4 years) |
| AI-driven in-game personalization lifts ARPU | +1.1% | National, led by studios in California, Washington, and Texas technology corridors | Short term (≤ 2 years) |
| FTC micro-transaction guidance clarity | +0.4% | National, with compliance frameworks enforced federally and supplemented by state-level consumer-protection statutes | Short term (≤ 2 years) |
| 5G fixed-wireless roll-out lowers latency | +0.6% | National, with early gains in T-Mobile and Verizon coverage zones; AT&T expanding rapidly | Medium term (2-4 years) |
| Source: Mordor Intelligence | |||
Growing Cloud-Gaming Subscriptions
Xbox Game Pass surpassed 35-37 million subscribers by mid-2025, generating roughly USD 5 billion in annual revenue, after Microsoft inked more than 150 content deals in the same year.[1]Microsoft Corporation, “Investor Relations,” microsoft.com Subscriber spending across all gaming platforms climbed 24% year-over-year in December 2025, confirming consumer appetite for bundled day-one access. Reduced hardware requirements and cross-device continuity are projected to propel global cloud-gaming revenue from USD 1.4 billion in 2025 to USD 18.3 billion by 2030. Platform holders use “all-you-can-play” libraries to smooth revenue volatility and shift titles toward live-service design. This raises barriers for mid-tier publishers that lack back catalogs large enough to anchor a subscription proposition.
Rising Mobile-Gamer Base and Smartphone Penetration
Mobile gaming represented 51.83% of the United States gaming market in 2025, supported by USD 52 billion in mobile in-app-purchase revenue during 2024, up 16% year-over-year.[2]Sensor Tower, “Mobile Gaming Market Intelligence,” sensortower.comiOS captured 55% of that spend despite Android’s larger install base, highlighting Apple’s monetization edge. 5G devices now deliver sub-20-millisecond latencies that enable competitive play previously confined to console and PC. Affordable mid-tier handsets with 120-hertz displays are democratizing premium experiences for older demographics that value short session lengths. Publishers are therefore prioritizing one-hand controls and portrait orientations to widen reach.
Esports Media-Rights Monetization Boom
The National Basketball Association’s USD 76 billion domestic broadcast renewal in 2025 underscored the premium valuations attached to live content and raised expectations for esports rights packages. United States esports viewership hit 805 million hours in Q3 2025, narrowing the gap with traditional sports ratings. Sponsorship and ad revenue tied to esports climbed 18% year-over-year, fuelled by in-broadcast product integrations that bypass ad-blockers. Collegiate leagues are formalizing franchising structures, granting media partners multi-year visibility. Bundled subscriptions that mix live sports and esports on the same streaming platforms are reducing churn.
AI-Driven In-Game Personalization Lifts ARPU
Studios deploying machine-learning bid engines have reported ARPU gains above 180% by tailoring offers and difficulty curves in real time. Fifty-two percent of developers already employ generative AI for prototyping and asset creation, compressing production schedules by up to 30%. Investors reward AI-enabled publishers with valuation multiples two to three times higher than peers because scalable content pipelines reduce hit-risk. Nonetheless, 30% of creators worry about IP leakage and energy usage, indicating an emerging governance challenge.
Restraints Impact Analysis*
| Restraint | (~) % Impact on CAGR Forecast | Geographic Relevance | Impact Timeline |
|---|---|---|---|
| Escalating AAA development and marketing costs | -1.4% | National, with highest concentration in California, Washington, and Texas studio clusters | Long term (≥ 4 years) |
| Regulatory scrutiny on loot-box mechanics | -0.8% | National, with federal enforcement supplemented by state-level consumer-protection statutes | Medium term (2-4 years) |
| Senior real-time-engine talent shortage | -0.6% | National, with acute shortages in Unreal Engine and Unity specialists in technology hubs | Medium term (2-4 years) |
| Energy-intensive data centers raise OPEX | -0.5% | National, with highest impact in Virginia, California, and Texas data-center corridors | Long term (≥ 4 years) |
| Source: Mordor Intelligence | |||
Escalating AAA Development and Marketing Costs
Take-Two capitalized USD 2.145 billion in development costs by June 30 2025, primarily for Grand Theft Auto VI, illustrating ballooning spending profiles.[3]Take-Two Interactive Software Inc., “Form 10-K 2025,” sec.gov Ray-tracing consumes 30-40% of modern AAA budgets and motion-capture plus voice talent can exceed USD 25 million per release. Development cycles now stretch five to seven years, requiring teams of up to 1,000 employees with six-figure salaries, shrinking margins. Publishers answer by canceling mid-tier titles and doubling down on live-service franchises to amortize investment.
Regulatory Scrutiny on Loot-Box Mechanics
The FTC levied USD 520 million in relief against Epic Games through June 2025 and fined Cognosphere USD 20 million in January 2025, establishing federal precedent on random-reward monetization. Compliance expenses-from age-verification to parental-consent workflows-are climbing, prompting some publishers to excise loot-boxes from youth-oriented releases. The Entertainment Software Rating Board’s “random items” label, combined with state privacy acts, adds further disclosure obligations.
*Our forecasts treat driver/restraint impacts as directional, not additive. The impact forecasts reflect baseline growth, mix effects, and variable interactions.
Segment Analysis
By Platform: Mobile Dominance Meets Cloud Disruption
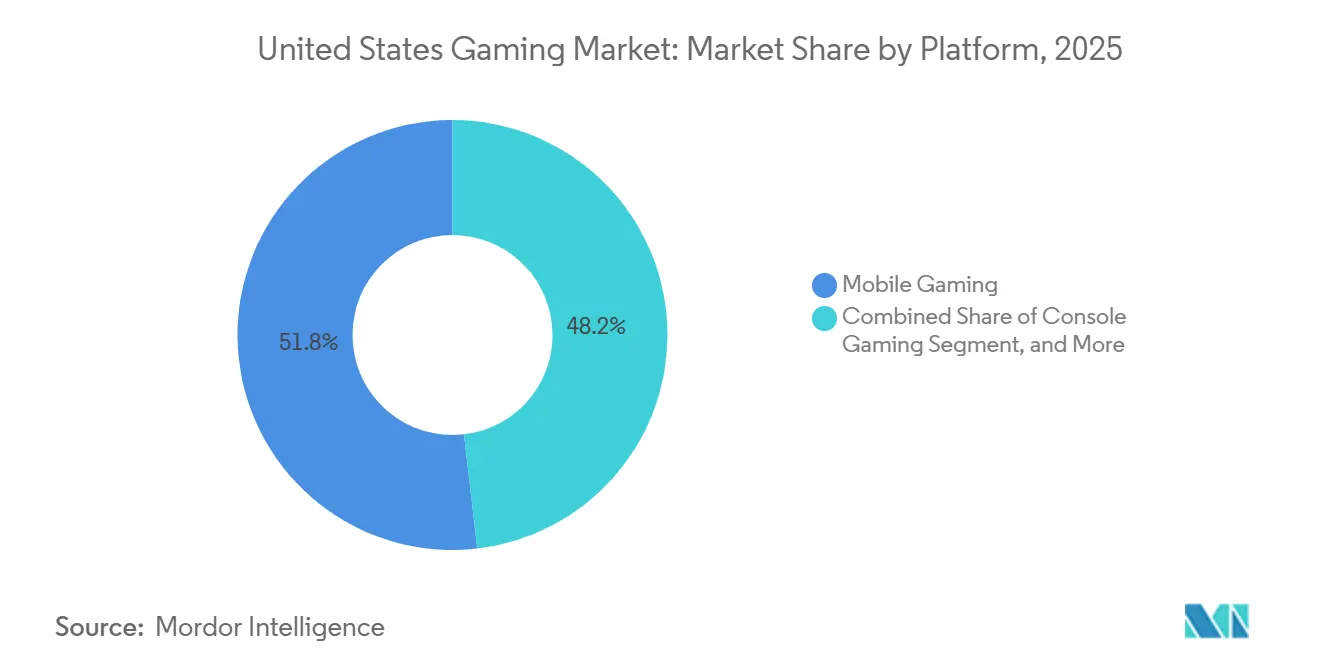
Mobile contributed 51.83% of United States gaming market share in 2025, led by USD 52 billion in IAP revenue. Cloud play, although only a low-single-digit contributor today, is poised to grow at a 9.16% CAGR, outpacing the overall United States gaming market.Console gaming experienced a resurgence in 2025, with hardware sales climbing 20 percent year-to-date through August to USD 2.9 billion, propelled by Nintendo Switch 2's record-breaking launch that sold more than 2.4 million units in the United States within three months, outpacing PlayStation 4's debut by approximately 5 percent.
Market concentration is intensifying, as the top 10 games on Steam captured 61 percent of revenue and the top 100 accounted for 91 percent, indicating winner-take-most dynamics that favor established franchises and live-service titles. Forward momentum stems from 5G fixed-wireless that already covers 10.3 million households combined across T-Mobile and Verizon, enabling sub-10 millisecond round-trip latencies. Console hardware price hikes-Xbox Series X at USD 599 and PlayStation 5 at USD 549-are nudging budget-sensitive users toward streaming alternatives.


By Revenue Model: In-App Purchases Lead, Subscriptions Accelerate
In-app purchases delivered 62.66% of value in 2025, underpinning the largest pool within the United States gaming market size. Subscription passes, on the other hand, are projected to record an 8.74% CAGR to 2031. Premium pay-to-own titles faced headwinds as new releases accounted for only 12 percent of total playtime in 2024, with players gravitating toward established live-service games that offer continuous content updates and social engagement.
Xbox Game Pass alone added more than 150 titles during 2025 and pushed console content revenue up 65.9% after catalog integration. Hybrid models that mix IAP, advertising and subscriptions achieve steadier cash flows and hedge against whale-spend volatility. Fifty-eight percent of marketers planned to increase connected-TV spending in the second half of 2025, with addressability, measurability, and first-party data cited as top priorities, positioning gaming as a distinct ad channel with positive year-over-year growth.
By Genre: Casual Puzzle Anchors Share, Sports Racing Surges
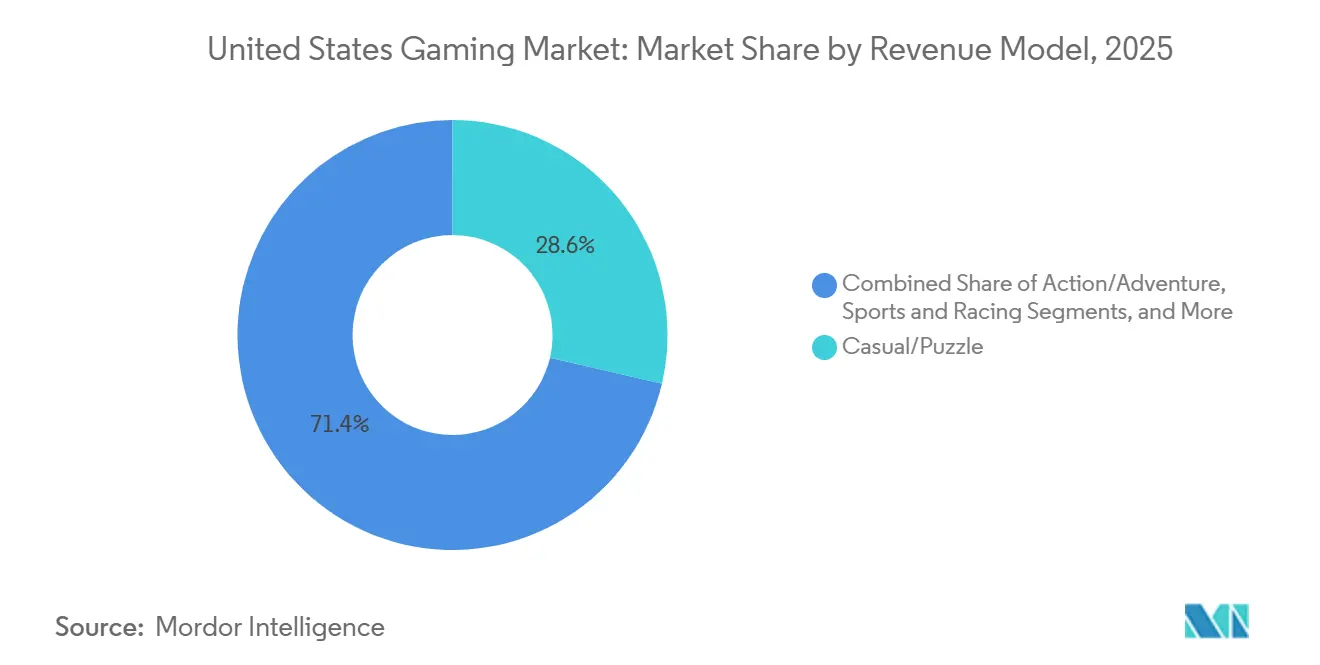
Casual and puzzle games held 28.64% of United States gaming market share in 2025 thanks to older-age mobile adoption. Sports and racing franchises, however, are expected to expand at a 9.02% CAGR as live-service updates and cross-platform play deepen engagement.Shooter games remain a cornerstone of the market, with Call of Duty: Black Ops 6 generating USD 1 billion in its first three weeks post-launch in October 2024, marking the fastest-selling entry in franchise history, while the broader Call of Duty franchise surpassed 500 million lifetime players.
Role-playing and massively multiplayer online games maintain dedicated audiences, with Sony's Bungie studio accelerating Marathon's launch by March 2026 under tighter corporate oversight following restructuring in August 2025. Electronic Arts generated USD 1.9 billion in quarterly sports revenue in fiscal Q3 2025, with EA Sports FC 25 attracting 22 million unique players in its first three months. Annualized content drops sustain monetization well into subsequent release cycles.
By Gamer Demographic: Young Adults Dominate, Older Cohorts Accelerate
Gamers aged 18-34 comprised 44.71% of players in 2025, anchoring premium console and competitive shooter demand. The 45-plus segment, expanding at an 8.96% CAGR, uses mobile interfaces and health gamification to reinforce daily routines. AARP reported 52.4 million gamers aged 50 and older in the United States in 2024, while the Entertainment Software Association found that 26 percent of gamers are 55 or older, and the average gamer age reached 36 years.
Mobile gaming serves as the primary entry point for older demographics, with casual and puzzle genres offering low-friction onboarding and shorter session lengths that fit into daily routines. Cross-generational play is rising as family subscription plans gain popularity. This dynamic creates incremental revenue opportunities through cosmetics that appeal across age divides.
Geography Analysis
Regional revenue reached USD 52.7 billion in 2025, accounting for the largest share globally. Coastal metropolitan areas boast faster broadband, greater ad budgets and higher disposable incomes than rural zones. Regional variations within the United States reflect infrastructure disparities, with 5G fixed-wireless adoption concentrated in urban and suburban zones served by T-Mobile's 6.1 million and Verizon's 4.2 million fixed-wireless access customers as of Q3 2024, while rural areas lag due to limited fiber availability affecting 25 percent of United States households.
Urban clusters in California, Washington and Texas host the majority of studio headcount and cloud data-center racks, benefiting from talent density and venture capital access. Virginia’s “Data Center Alley” leads electricity consumption, compelling operators to sign renewable power-purchase agreements as GPU servers exceed 5 kW per unit.
5G fixed-wireless adoption remains strongest in the 10 largest MSAs, yet 25% of households in rural counties still lack fiber-grade connectivity, limiting cloud-gaming uptake. The Federal Trade Commission and state-level consumer-protection agencies enforce compliance frameworks that shape monetization practices nationwide, with California's Consumer Privacy Act and Children's Online Privacy Protection Act setting de facto national standards that publishers adopt to avoid fragmented compliance regimes.
Regulatory Landscape
Gaming oversight in the United States cuts across federal consumer-protection enforcement and state-level rules that govern monetization, privacy, and gambling-like mechanics. The Federal Trade Commission (FTC) established precedent through enforcement tied to microtransactions and random-reward monetization. In May 2025, it dismissed its administrative complaint regarding the Microsoft-Activision Blizzard transaction after the 9th Circuit declined injunctive relief, which reduced uncertainty around consolidation in the sector.
At the state level, consumer-protection and gambling statutes increasingly target casino-adjacent mechanics and promotional formats. Multiple states, including California, Connecticut, Montana, New Jersey, and New York, passed 2025 legislation targeting sweepstakes platforms that mimic casinos. Separately, a federal tax change enacted in July 2025 raised the withholding threshold on winnings from electronic gaming devices from USD 1,200 to USD 2,000, reflecting continued policy attention to gaming-related transactions.
Value Chain Analysis
The United States gaming value chain is anchored by developers, including independent studios through AAA teams, that create content using engines and middleware. Publishers then finance, publish, and market the content, managing IP portfolios and live-operations as games scale. Platform and storefront owners are the main distribution intermediaries for both content and payments, with digital channels such as Steam, Xbox Store, PlayStation Store, Nintendo eShop, Apple App Store, and Google Play largely disintermediating physical retail for most segments.
Downstream, service providers supply core building blocks such as real-time engines, cloud and backend hosting, identity and analytics, fraud prevention, and ad networks that support advertising-funded and in-app purchase models. Consolidation and integration repeatedly reshape the value chain, including the FTC closing its Microsoft-Activision Blizzard administrative challenge in May 2025, which reinforced the role of scaled platform ecosystems in content distribution and cloud infrastructure leverage.
Competitive Landscape
Platform holders Microsoft, Sony Interactive Entertainment and Nintendo act as gatekeepers by bundling exclusive intellectual property with hardware and services. Microsoft finalized its USD 68.7 billion Activision Blizzard acquisition in 2023, folding Call of Duty into Game Pass and nudging subscribers past the 35 million mark by mid-2025.
Electronic Arts accepted a USD 55 billion privatization offer in October 2025, signaling that private-equity capital values predictable live-service cash flows. Epic Games’ partnership with Unity will let Unity-built titles run inside Fortnite from 2026, positioning Fortnite as an alternative distribution layer that retains 88% of creator revenue.
Smaller studios deploying generative AI can now build prototype levels in days, yet 41% of developers reported layoffs in 2025 as publishers prune overlapping roles after M&A waves. Market power is therefore tilting toward conglomerates able to fund ballooning budgets and negotiate prime cloud contracts.
United States Gaming Industry Leaders
Activision Blizzard, Inc.
Electronic Arts Inc.
Take-Two Interactive Software Inc.
Microsoft Corporation
Sony Interactive Entertainment
- *Disclaimer: Major Players sorted in no particular order

Market Opportunities and Future Outlook
Monetization and distribution are moving beyond one-time game sales into recurring access, live-service content, and embedded commerce. This creates room for publishers and platforms that can combine subscriptions, in-app purchases, and advertising within a single player journey. The underlying pull is visible in subscription libraries, including Xbox Game Pass surpassing 35-37 million subscribers by mid-2025 and adding more than 150 content deals in 2025, which increases demand for cross-platform entitlement management, live-ops tooling, and differentiated back-catalog content strategies.
Real-money gaming also continues to generate adjacent opportunities for compliant digital experiences and partnerships where permitted. The American Gaming Association notes that sports betting is live in 39 states plus DC, and iGaming is live in 8 states. 2026 policy activity includes pending iGaming-related bills in New York, Illinois, and Indiana, while 2025 also saw 16 states challenge unregulated prediction markets. For video game publishers and platforms, these conditions raise the commercial value of compliance operations such as age-gating, disclosures, and fraud controls, and they support licensed, state-by-state offerings and B2B enablement services aligned to local requirements.
Recent Industry Developments
- July 2026: Microsoft Corporation announced internal restructuring and a 15 percent workforce reduction (1,600 employees) to realign investments toward Activision, Bethesda, Blizzard, King, and Mojang studios. The company is consolidating capital toward core IP and cost optimization, which may influence licensing dynamics and platform strategy within the US gaming market.
- May 2026: Microsoft Corporation settled the final major class action lawsuit regarding the Activision Blizzard acquisition for 250 million dollars. The settlement clears regulatory and litigation risk and supports the ongoing integration of Activision Blizzard assets into the Game Pass ecosystem.
- May 2026: Electronic Arts Inc. announced a multi-year global partnership with Visa to integrate payment services and fan experiences into EA SPORTS FC and EA SPORTS College Football franchises. The partnership expands monetization and engagement through payments and rewards, which could increase in-game monetization and subscriber value in the US market.


Research Methodology Framework and Report Scope
Market Definition and Coverage
For this study, the United States gaming market is sized as revenue generated from playing electronic games across mobile devices, consoles, PCs (client and browser), and cloud or streaming services, including the common ways players pay and publishers earn.
Scope exclusions: Real-money gambling and betting revenues are excluded when they are not tied to video game content consumption.
Segmentation Overview
- By Platform
- Mobile Gaming
- Console Gaming
- PC Gaming (Client and Browser)
- Cloud / Streaming Gaming
- By Revenue Model
- In-App Purchases (IAP)
- Premium (Pay-to-Own)
- Subscription Passes
- Advertising-Supported
- By Genre
- Action / Adventure
- Shooter
- Sports and Racing
- Role-Playing and MMO
- Casual / Puzzle
- Strategy and Card
- Other Genres
- By Gamer Demographic
- Less Than 18 Years
- 18 -34 Years
- 35 -44 Years
- 45+ Years
Data Sources, Market Sizing, and Validation
Desk Research
Desk work started by mapping the demand pool and the payment routes that create gaming revenue in the United States. We used public references such as the U.S. Census Bureau, the Bureau of Labor Statistics, the Federal Communications Commission, the Federal Trade Commission, and the World Intellectual Property Organization to ground basics like population cohorts, spending context, broadband availability, consumer guidance, and IP activity.
That backbone was then tied to company filings and investor decks, app store category trends discussed in the public domain, and reputable press coverage on launches and monetization changes. Where useful, we also used paid subscriptions that provide company financials and intelligence, plus patent and news coverage, to cross-check timelines and revenue exposure. The desk sources listed here are not exhaustive, and additional public documents and databases were referenced to collect, validate, and clarify data points.
Primary Interviews and Surveys
Primary work focused on validating what actually drives revenue by platform and by revenue model, because those splits tend to shift with pricing and content cycles. We spoke with a mix of publishers and studios, platform and ecosystem participants, ad and monetization specialists, and channel-side experts, and then used these inputs to pressure-test assumptions across the United States.
Responses were also used to confirm practical items such as typical take rates, subscription attachment patterns, and how ad-supported formats are counted, before final totals were locked.
Distribution of primary research fieldwork respondents
| Company type | Respondent position | Region |
|---|---|---|
| Top tier: 36% | CXOs: 12% | |
| Mid tier: 46% | Functional/Unit leaders: 39% | |
| Smaller Players: 18% | Managers: 49% |
Market-Sizing & Forecasting
Sizing began with a top-down build where the United States demand pool is reconstructed by platform and revenue model, then matched to observed monetization pathways (premium purchases, in-app purchases, subscription passes, and advertising-supported formats). The totals were subsequently checked with selective bottom-up approximations, such as sampled average revenue per user by platform, title-level and genre-level revenue intensity checks, and channel conversations on subscription and ad load behavior, which helped adjust outliers.
Inputs used in the model included smartphone and broadband penetration, time spent and engagement shifts by platform, subscription pass pricing and expected attachment rates, in-app purchase intensity and payer mix, and ad-supported fill and pricing direction. Where direct reads were missing, gaps were handled by using bounded ranges from primary inputs, then narrowing them using consistency checks across platform shares and revenue-model splits.
Forecasting relied on scenario analysis supported by short time-series smoothing for stable components, and it was guided by how experts expect subscription mix, cloud/streaming adoption, and advertising contribution to evolve over the 2026 to 2031 period.
Data Validation & Update Cycle
Outputs were validated through triangulation across independent signals, followed by variance checks at the platform and revenue-model level so the total aligns with realistic consumer spend and monetization behavior. When an anomaly appeared, assumptions were re-checked, and targeted follow-ups were triggered to determine whether the change was a one-off event or a structural shift.
Before sign-off, the model goes through multi-step analyst reviews, where calculations, unit logic, and year-on-year movements are verified. Reports are refreshed annually, with interim updates when material events occur, and a final pre-delivery pass is completed so clients receive the most current view available.
Mordor Intelligence's United States Gaming Market Estimate Compared With Other Published Estimates
Published market sizes for United States gaming rarely line up perfectly because the same end market can be counted using different revenue lines and different inclusion rules. The most common reasons are platform coverage choices, how ad-supported gaming is valued, whether subscriptions are counted as gross or net of store fees, and the year used for currency timing and normalization.
The table shows a visible spread. In Mordor Intelligence's model, the value is built from platform totals that follow the report scope of mobile, console, PC (client and browser), and cloud or streaming, and it also counts revenue models consistently across premium, in-app purchases, subscriptions, and advertising-supported gaming rather than merging adjacent digital entertainment lines.
Benchmark comparison
| Source | Market Size | Gaps in Research Methodology |
|---|---|---|
| Mordor Intelligence | USD 67.62 B (2025) | |
| Industry Association A | USD 59.80 B (2025) | Often focuses on core game content spending and may exclude some advertising-supported revenue, and it can also treat subscription passes using net revenue after platform fees, which lowers the total. |
| Global Consultancy B | USD 75.40 B (2025) | May apply a broader digital gaming definition that pulls in adjacent creator economy or live-streaming related income, and it can use more aggressive assumptions on ARPU progression for mobile and subscriptions. |
Taken together, the comparison suggests the gap is mainly created by what is counted as gaming revenue and how gross versus net treatment is handled across stores and subscriptions. Our approach keeps inputs traceable to clear platform and monetization variables, and the steps can be repeated and stress-tested when new evidence or market events emerge.


Key Questions Answered in the Report
How big is the United States gaming market in 2026?
The United States gaming market size reached USD 68.9 billion in 2026.
Which platform leads spending?
Mobile Gaming led with 55.88% of United States gaming market share in 2025.
What is the forecast growth rate through 2031?
Overall revenue is projected to rise at a 8.75% CAGR between 2026 and 2031.
Which revenue model is expanding fastest?
Subscription Passes are forecast to post a 10.18% CAGR through 2031.
What demographic spends the most on games?
Players aged 18-34 represent the largest and fastest-growing spending cohort at 39.35% share.
Page last updated on:






