United States FTL Freight Brokerage Market Size and Share
Market Overview
| Study Period | 2019 - 2030 |
|---|---|
| Base Year For Estimation | 2024 |
| Forecast Data Period | 2025 - 2030 |
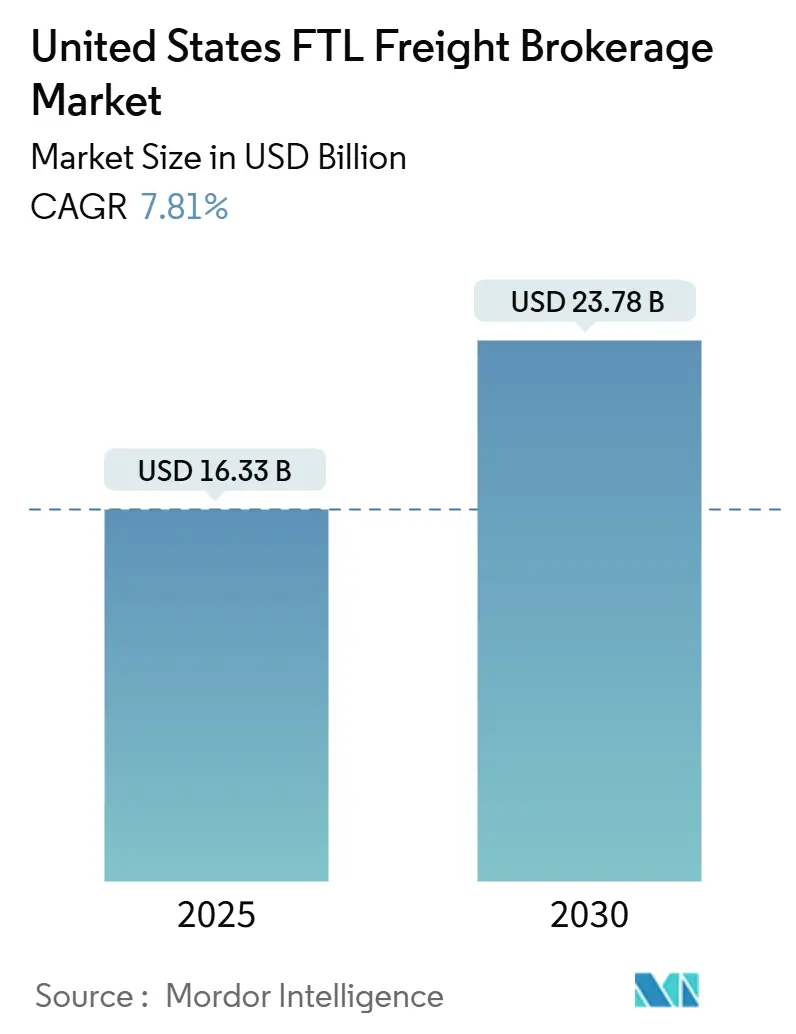
| Market Size (2025) | USD 16.33 Billion |
| Market Size (2030) | USD 23.78 Billion |
| Growth Rate (2025 - 2030) | 7.81% CAGR |
| Market Concentration | Low |
Major Players
*Disclaimer: Major Players sorted in no particular order Image © Mordor Intelligence. Reuse requires attribution under CC BY 4.0. |
|
United States FTL Freight Brokerage Market Analysis by Mordor Intelligence
The United States FTL Freight Brokerage Market size is estimated at USD 16.33 billion in 2025, and is expected to reach USD 23.78 billion by 2030, at a CAGR of 7.81% during the forecast period (2025-2030).
The scale and trajectory underscore how rapidly shippers are migrating procurement toward digital, third-party full-truckload specialists in response to e-commerce fulfillment imperatives, nearshoring, and infrastructure spending. Platform-driven intermediaries are consolidating volumes by integrating predictive pricing, API connectivity, and automated compliance checks that shrink manual touch points and shorten settlement cycles. At the same time, concentrated buying power allows top brokers to secure capacity despite an aging driver workforce, volatile diesel prices, and tightening credit. Technology leadership, deep carrier relationships, and diversified equipment portfolios therefore emerge as decisive advantages as supply chains digitize, cross-border traffic grows, and shippers pursue cost-out strategies through load consolidation.
Key Report Takeaways
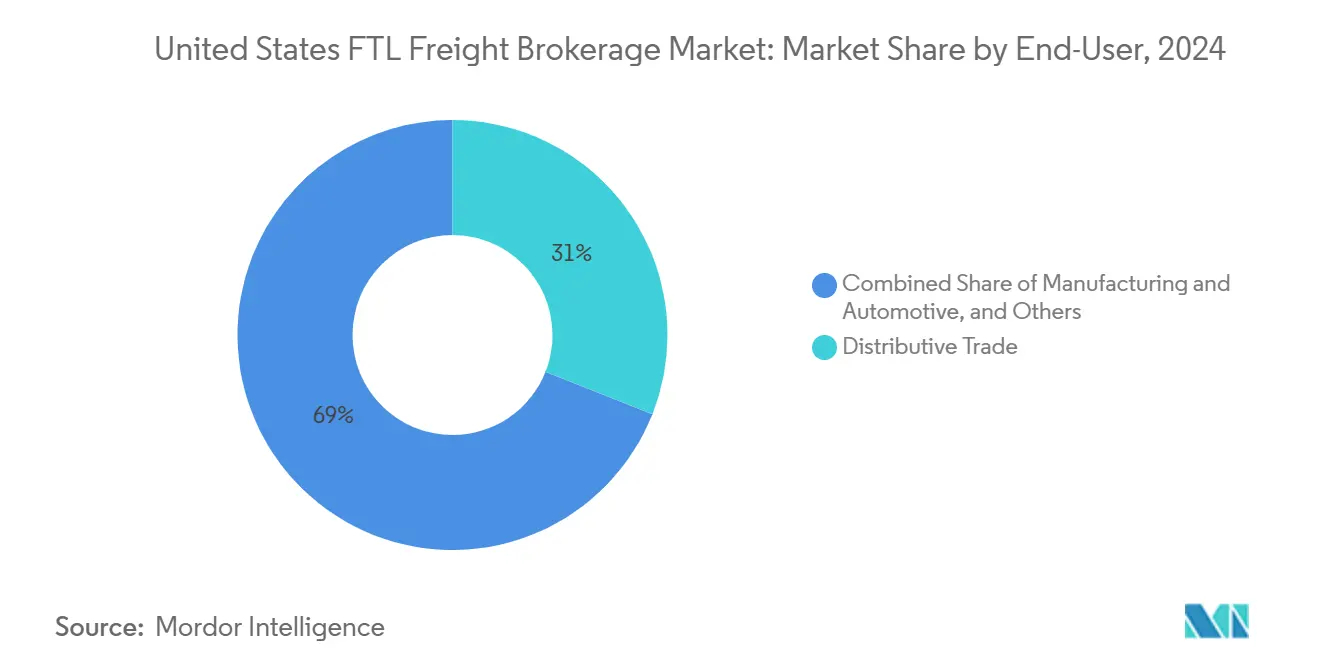
- By end-user, distributive trade held a 31.00% share of the US FTL freight brokerage market in 2024, while construction is forecast to expand at a 5.30% CAGR through 2030.
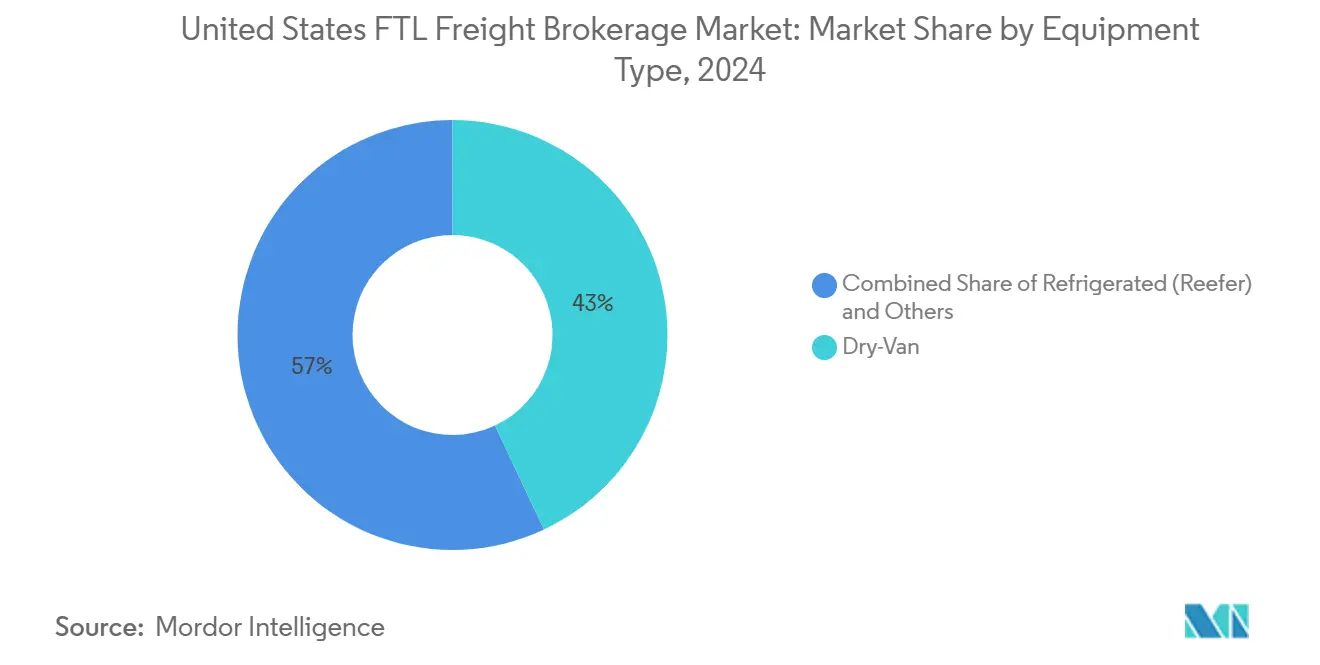
- By equipment type, dry-van captured 43.00% of the US FTL freight brokerage market share in 2024; flatbed and heavy-haul equipment is poised for the fastest 5.80% CAGR to 2030.
- By freight type, general freight accounted for 77.00% of the US FTL freight brokerage market size in 2024, whereas refrigerated freight is projected to grow at a 6.40% CAGR to 2030.
- By region, the Midwest commanded 24.00% of the US FTL freight brokerage market in 2024 and is set to grow at a 4.90% CAGR to 2030.
United States FTL Freight Brokerage Market Trends and Insights
Drivers Impact Analysis
| Driver | (≈) % Impact on CAGR Forecast | Geographic Relevance | Impact Timeline |
|---|---|---|---|
| Explosive e-commerce fulfillment demand | +1.8% | National, major metropolitan areas | Medium term (2-4 years) |
| Shippers’ cost-out agenda & modal shift | +1.2% | National, manufacturing corridors | Short term (≤ 2 years) |
| Digitization & API-based freight matching | +1.0% | National, tech-forward regions | Long term (≥ 4 years) |
| US-Mexico nearshoring corridor growth | +1.4% | Southwest border states, Texas-Mexico corridor | Medium term (2-4 years) |
| IIJA infrastructure projects | +0.9% | National, infrastructure investment zones | Long term (≥ 4 years) |
| FEMA disaster-relief contract spikes | +0.5% | Regional, disaster-prone areas | Short term (≤ 2 years) |
| Source: Mordor Intelligence | |||
Explosive E-commerce Fulfillment Demand
Distributed inventory strategies require granular capacity management that traditional asset-based carriers cannot meet efficiently. Brokers using AI-driven consolidation engines reduce empty miles and compress transportation cycle times by up to 35%, improving cost-to-serve for omnichannel retailers. Micro-fulfillment hubs in dense urban zones stimulate frequent, small-lot full-truckload moves that reward intermediaries capable of rapid capacity matching. Speed-to-customer remains paramount, enabling premium pricing on expedited multi-stop routes and reinforcing the US FTL freight brokerage market as a go-to partner for e-commerce networks[1]“Border Crossing Data,” U.S. Bureau of Transportation Statistics, bts.gov.
Shippers’ Cost-Out Agenda and Modal Shift to FTL
Manufacturers consolidating loads above 15,000 lb avoid terminal handling, lower damage claims, and cut transit times, realizing 12-18% savings versus comparable LTL routings. Automotive and industrial supply chains favor direct-to-plant deliveries to sustain just-in-time inventory disciplines. Brokers able to orchestrate regional consolidation hubs draw incremental volume as supply chain managers re-prioritize velocity over lowest unit cost, reinforcing volume flows into the US FTL freight brokerage market.
Digitization and API-Driven Freight-Matching Platforms
Real-time algorithms trim empty miles by 45% and shrink settlement cycles from weeks to minutes through blockchain-verified contracts. API hooks into shipper TMS platforms let brokers automate tendering, carrier vetting, and document generation. Operational efficiency climbs 40% as predictive engines recommend optimal route-equipment mixes. Smaller operators lacking digital capital lose share, accelerating consolidation within the US FTL freight brokerage market[2]“Public Assistance Transportation,” FEMA, fema.gov.
US-Mexico Nearshoring Corridor Growth
United States–Mexico trade lanes handle increasing electronics and automotive components as manufacturers shorten supply chains. Brokers fluent in bilingual documentation and customs processes capture premium freight into Texas gateways that now surpass West Coast volumes on some lanes. Specialized cross-border teams mitigate border-crossing dwell times, reduce compliance risk, and drive sustained lane density for the US FTL freight brokerage market[3]“Freight Fraud Schemes Target Brokers,” Journal of Commerce, joc.com.
Restraints Impact Analysis
| Restraint | (≈) % Impact on CAGR Forecast | Geographic Relevance | Impact Timeline |
|---|---|---|---|
| Chronic driver shortage & aging workforce | -1.5% | National, rural and long-haul routes | Long term (≥ 4 years) |
| Diesel-price volatility | -0.8% | National, refinery-dependent regions | Short term (≤ 2 years) |
| Double-brokering & cargo theft fraud | -0.6% | National, high-fraud corridors | Medium term (2-4 years) |
| Private-fleet insourcing by big shippers | -1.1% | National, Fortune 500 manufacturing clusters | Medium term (2-4 years) |
| Source: Mordor Intelligence | |||
Chronic Driver Shortage and Aging Workforce
Non-payroll trucking employment shrank 16.3% in 2024, the sharpest retrenchment since 2009. Independent contractors face 20% higher insurance and financing costs, pushing some off the road. Drug and Alcohol Clearinghouse violations and potential ELD mandates on pre-2000 trucks trim further capacity. Brokers with dependable carrier pools can raise margins, yet overall volume headroom narrows, slowing expansion potential for the US FTL freight brokerage market.
Diesel-Price Volatility Compressing Broker Margins
Pump prices spiked above USD 5.00 per gallon in several regions during 2024 peaks, inflating surcharge disputes between shippers and carriers. While brokers can pass through fuel surcharges, rapid price swings squeeze gross margin when contractual lag exists. Hedging and index-linked rate structures mitigate but do not fully neutralize volatility.
Segment Analysis
By End-User: Construction Surges While Distributive Trade Anchors Volumes
Distributive trade accounted for 31.00% of the US FTL freight brokerage market share in 2024, reflecting omnichannel retailers, wholesalers, and e-commerce marketplaces that depend on nationwide dry-van networks. Growth remains stable as inventory decentralization favors frequent replenishment. Construction, accelerated by Infrastructure Investment and Jobs Act funding, registers the fastest 5.30% CAGR to 2030. Flatbed brokers coordinate rebar, prefabricated walls, and heavy equipment to thousands of work sites, capturing premium rates for specialized routings. Manufacturing and automotive continue to present cross-border opportunities as nearshoring drives synchronized flows between assembly plants and supplier parks. Oil, gas, and mining volumes fluctuate with commodity cycles, while agriculture, fishing, and forestry shipments retain seasonal predictability that brokers monetize through strategic positioning of capacity in harvest corridors.
The end-user mix supports margin diversification. A slowdown in consumer spending can be offset by infrastructure outlays that extend through 2029 appropriations. Brokers leveraging data analytics segment shippers by commodity volatility and adjust pricing strategies dynamically, sustaining profitability across cycles. FEMA-related episodic volume spikes provide additional upside. The balanced portfolio across end-users therefore underpins the long-run resilience of the US FTL freight brokerage market.
Note: Segment shares of all individual segments available upon report purchase
By Equipment Type: Dry-Van Dominance Balanced by Flatbed Upside
Dry-van trailers held 43.00% of the US FTL freight brokerage market in 2024, driven by general merchandise, packaged foods, and consumer durables. Flatbed and heavy-haul capacity, while smaller, is forecast for a 5.80% CAGR through 2030 as infrastructure projects and nearshoring manufacturing require open-deck moves. The US FTL freight brokerage market size for flatbed loads is projected to expand steadily alongside IIJA road and bridge upgrades. Refrigerated units support cold-chain commodities, including pharmaceuticals and meal-kit deliveries, with brokers securing dedicated reefer fleets under multiyear contracts to guarantee temperature compliance. Tanker and bulk equipment deliver chemicals, fuels, and grain, integrating specialized washout and hazmat certifications into broker service offerings. Technology such as telematics-enabled temperature sensors and cargo weight monitoring boosts service reliability and drives higher revenue per mile.
Diversified equipment portfolios buffer seasonality. When consumer spending retreats, flatbed backlogs tied to public infrastructure projects sustain network utilization. Conversely, a construction slowdown can be offset by e-commerce-driven dry-van demand. This counter-cyclical benefit positions full-service intermediaries to capture outsized wallet share, reinforcing the maturation of the US FTL freight brokerage market.
Note: Segment shares of all individual segments available upon report purchase
By Freight Type: General Freight Provides Base; Refrigerated Freight Outperforms
General freight comprised 77.00% of total volume in 2024, offering scale efficiencies and stable routing patterns that underpin predictable revenue for brokers. Within this foundation, refrigerated freight’s 6.40% CAGR through 2030 outpaces the broader US FTL freight brokerage market as pharmaceutical cold chains, biologics, and fresh food e-commerce lift temperature-controlled demand. The US FTL freight brokerage market size linked to cold-chain loads increasingly commands premium yields due to equipment scarcity and stringent FDA compliance. Brokers with established reefer networks and 24/7 monitoring secure higher service fees. The expansion of personalized medicine and biologic treatments adds high-value, low-volume shipments requiring validated chain-of-custody protocols.
General freight still anchors network density and offers cross-sell opportunities into specialized segments. Load-balancing platforms merge dry-van backhauls with reefer headhauls to maximize tractor utilization. Brokers integrating reefer, dry-van, and flatbed networks through unified dashboards can flex equipment across freight types to capture peak season premiums, widening overall revenue capture within the US FTL freight brokerage market.
Geography Analysis
The Midwest retained a 24.00% share of the US FTL freight brokerage market in 2024 and is forecast to grow at 4.90% CAGR through 2030. Anchored by automotive hubs and grain export terminals, the region benefits from dense rail interchanges that enable efficient drayage and transload operations. Chicago, Kansas City, and Indianapolis corridors provide multi-modal connectivity that brokers leverage to orchestrate balanced lanes and minimize empty miles. Agricultural harvesting creates cyclical surges each fall, but steady manufacturing output cushions demand across seasons.
The South is the fastest-growing territory as population inflows, energy sector expansion, and reshoring attract assembly plants to Texas, Tennessee, and Georgia. Gulf Coast ports funnel petrochemical exports and consumer imports inland, supporting a vibrant lane mix for intermediaries. Energy-related drilling equipment, resin pellets, and auto parts anchor year-round volumes. Close proximity to Mexican maquiladora zones positions southern brokers to manage bilingual documentation and live border clearances, fortifying corridor specialization within the US FTL freight brokerage market.
The West manages trans-Pacific import flows through Los Angeles–Long Beach, Oakland, and Seattle. Port congestion and chassis shortages funnel discretionary cargo to secondary ports or intermodal rerouting through inland rail ramps. Brokers administering drayage-truckload handoffs capture incremental value through appointment scheduling and demurrage mitigation. The Northeast, though mature, offers dense final-mile markets from Boston to Washington, D.C. High tolls and urban congestion elevate broker value in securing capacity that meets tight delivery windows. Diesel price differentials and stricter environmental regulations create regional cost spread that savvy brokers arbitrage via lane pricing. Collectively, regional dynamics reinforce the need for granular network intelligence, sustaining demand for the US FTL freight brokerage market.
Competitive Landscape
Market share remains dispersed, yet consolidation accelerated through landmark deals such as RXO’s USD 1.025 billion acquisition of Coyote Logistics and Schneider’s USD 390 million purchase of Cowan Systems. Digital innovators like DAT, Loadsmart, and Convoy deploy machine-learning models that predict carrier acceptance and dynamically price freight. Legacy brokers respond by upgrading tech stacks, embedding API gateways, and launching mobile apps for real-time tracking. Fraud mitigation platforms using biometric driver validation and blockchain bill-of-lading records gain traction as cargo-theft incidents rise. Established brokerage houses integrate such tools to preserve customer trust and safeguard margins in the US FTL freight brokerage market.
Specialization is another differentiation vector. Cross-border brokerage units cultivate bilingual staff and bonded carrier pools to expedite northbound and southbound clearance. Temperature-controlled service divisions partner with pharma shippers to meet Good Distribution Practice audits. Disaster-relief teams maintain FEMA pre-approval to mobilize assets within hours of declared emergencies. These niches command higher yields and insulate providers from pure spot-rate commoditization.
Despite heightened M&A, the combined top five players hold well under 50% of gross revenue, leaving ample headroom for mid-sized regionals to thrive on service intimacy. Many smaller firms pursue technology partnerships rather than build proprietary platforms, preserving capital while accessing digital matching engines. The resulting mosaic of digital contenders and niche experts ensures vibrant competition across the US FTL freight brokerage market.
United States FTL Freight Brokerage Industry Leaders
-
C.H. Robinson
-
J.B. Hunt Transport Services
-
Total Quality Logistics
-
Echo Global Logistics
-
Landstar System
- *Disclaimer: Major Players sorted in no particular order
Recent Industry Developments
- March 2025: RXO completed its USD 1.025 billion acquisition of Coyote Logistics from UPS, forming one of North America’s largest digital freight platforms with expanded corridor coverage.
- February 2025: Schneider finalized its USD 390 million acquisition of Cowan Systems, strengthening dedicated fleet management and Southeast reach.
- January 2025: J.B. Hunt earmarked USD 75 million for AI-powered logistics technology and deepened partnerships with e-commerce marketplaces to enhance last-mile coverage.
- January 2025: Echo Global Logistics rolled out advanced carrier vetting systems to combat double-brokering.
United States FTL Freight Brokerage Market Report Scope
An FTL freight brokerage serves as the intermediary between the shipper, who needs to move their cargo, and the carrier (trucking company) that has the means to do so.
The report covers United States FTL trucking companies, and it is segmented by End User (Manufacturing and Automotive; Oil and Gas, Mining and Quarrying; Agriculture, Fishing and Forestry; Construction; Distributive Trade; and Other End-users). The report offers the market size in value terms in USD for all the abovementioned segments.
| Manufacturing And Automotive |
| Oil And Gas, Mining, And Quarrying |
| Agriculture, Fishing, And Forestry |
| Construction |
| Distributive Trade |
| Other End Users |
| Dry-Van |
| Refrigerated (Reefer) |
| Flatbed / Heavy-haul |
| Tanker / Bulk |
| Specialized / Over-dimension |
| General Freight |
| Refrigerated Freight |
| Northeast |
| Midwest |
| South |
| West |
| By End-User | Manufacturing And Automotive |
| Oil And Gas, Mining, And Quarrying | |
| Agriculture, Fishing, And Forestry | |
| Construction | |
| Distributive Trade | |
| Other End Users | |
| By Equipment Type | Dry-Van |
| Refrigerated (Reefer) | |
| Flatbed / Heavy-haul | |
| Tanker / Bulk | |
| Specialized / Over-dimension | |
| By Freight Type | General Freight |
| Refrigerated Freight | |
| By U.S. Region | Northeast |
| Midwest | |
| South | |
| West |
Key Questions Answered in the Report
How large will the US FTL freight brokerage market be by 2030?
It is projected to reach USD 23.78 billion, expanding at a 7.81% CAGR through the forecast horizon.
Which customer segment is growing the fastest for FTL brokers?
Construction freight tied to Infrastructure Investment and Jobs Act projects records the strongest 5.30% CAGR to 2030.
What equipment type offers the greatest upside through 2030?
Flatbed and heavy-haul trailers are set for a 5.80% CAGR as infrastructure and nearshoring lift specialized cargo demand.
Which U.S. region leads in brokerage revenue?
The Midwest holds the lead with 24.00% share in 2024 owing to manufacturing density and intermodal connectivity.
How are digital platforms changing FTL brokerage?
API-based marketplaces and AI load-matching engines cut empty miles, automate documentation, and shrink payment cycles from weeks to minutes.
What is the main risk brokers face in 2025?
Sophisticated double-brokering and cargo theft schemes tighten credit markets and raise vetting costs across the sector.
Page last updated on:


