Market Overview
| Study Period | 2020 - 2031 |
|---|---|
| Base Year For Estimation | 2025 |
| Forecast Data Period | 2026 - 2031 |
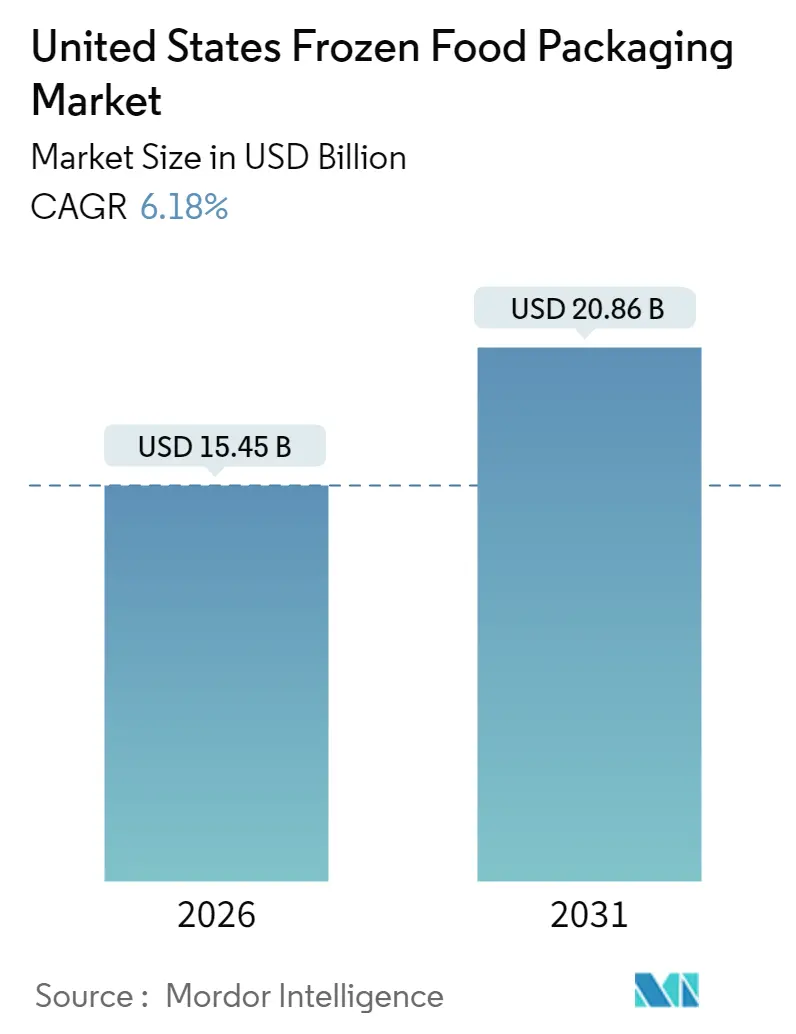
| Market Size (2026) | USD 15.45 Billion |
| Market Size (2031) | USD 20.86 Billion |
| Growth Rate (2026 - 2031) | 6.18% CAGR |
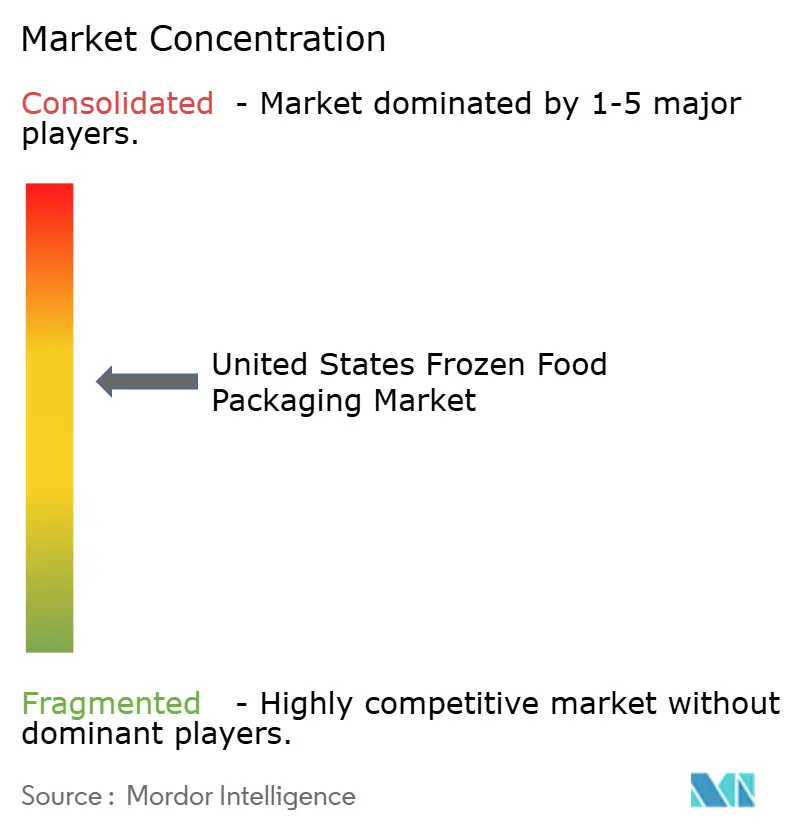
| Market Concentration | Medium |
Major Players *Disclaimer: Major Players sorted in no particular order Image © Mordor Intelligence. Reuse requires attribution under CC BY 4.0. | |
United States Frozen Food Packaging Market Analysis by Mordor Intelligence
The United States frozen food packaging market is expected to grow from USD 14.55 billion in 2025 to USD 15.45 billion in 2026 and is forecast to reach USD 20.86 billion by 2031 at 6.18% CAGR over 2026-2031. Robust growth stems from structural changes in consumer lifestyles, direct-to-consumer (D2C) delivery models, and retailer sustainability mandates. Demand for convenient heat-and-eat formats has spurred rapid adoption of dual-ovenable crystalline polyethylene terephthalate (CPET) trays, even though CPET commands a 35% price premium over polypropylene. At the same time, phase-change shipper inserts and vacuum-insulated panels enable D2C brands to reduce last-mile shipping costs by up to 18% while maintaining contents at a temperature below 10 °F for 48 hours. Converters are also chasing a USD 340 million substrate niche created by plant-based entrées that require ultra-low oxygen transmission rates to curb lipid oxidation. Automation of horizontal form-fill-seal (FFS) lines, capable of filling 180 pouches per minute, is reducing per-unit labor expense by 22%, freeing capital for investments in mono-material polyethylene (PE) films that meet Association of Plastic Recyclers design protocols.
Key Report Takeaways
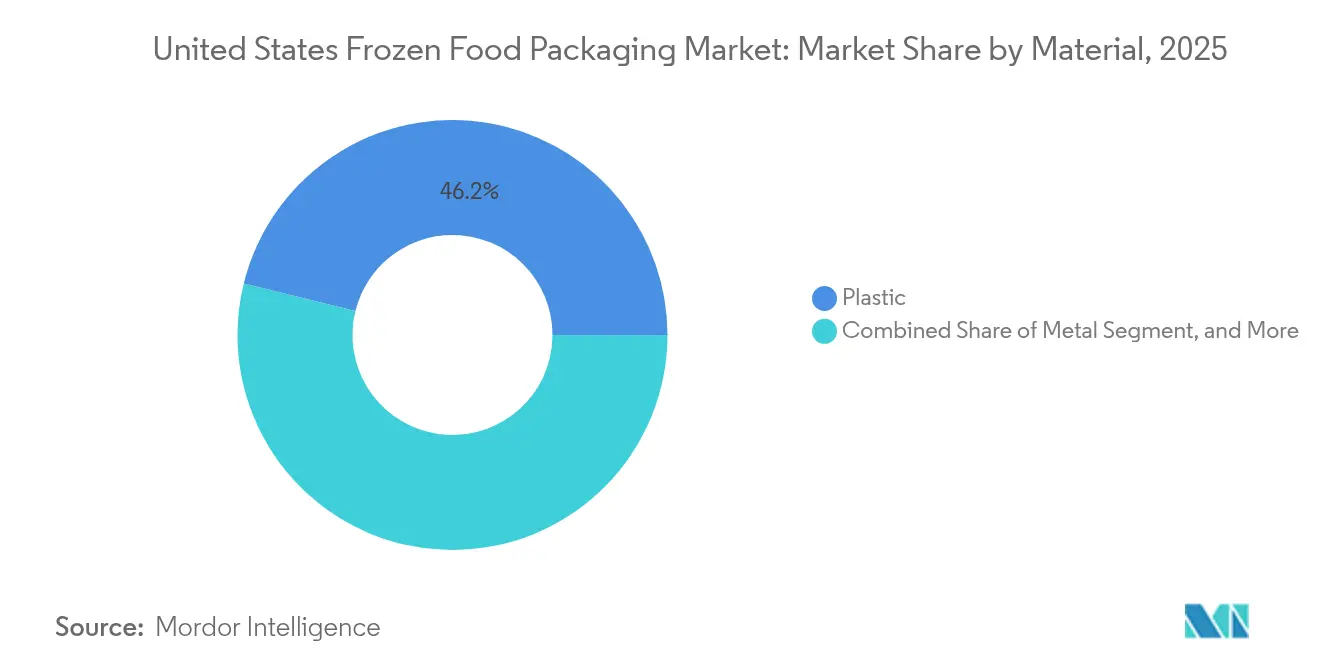
- By material, plastic captured 46.15% of the United States frozen food packaging market share in 2025, while paper and paperboard are projected to be the fastest-growing option at a 7.35% CAGR through 2031.
- By packaging format, flexible designs led with a 54.10% share of the United States frozen food packaging market in 2025 and are expected to expand at a 6.9% CAGR over the forecast period.
- By packaging product, bags and pouches accounted for 31.25% of the United States frozen food packaging market share in 2025, yet trays are poised for the quickest rise, advancing at a 7.22% CAGR.
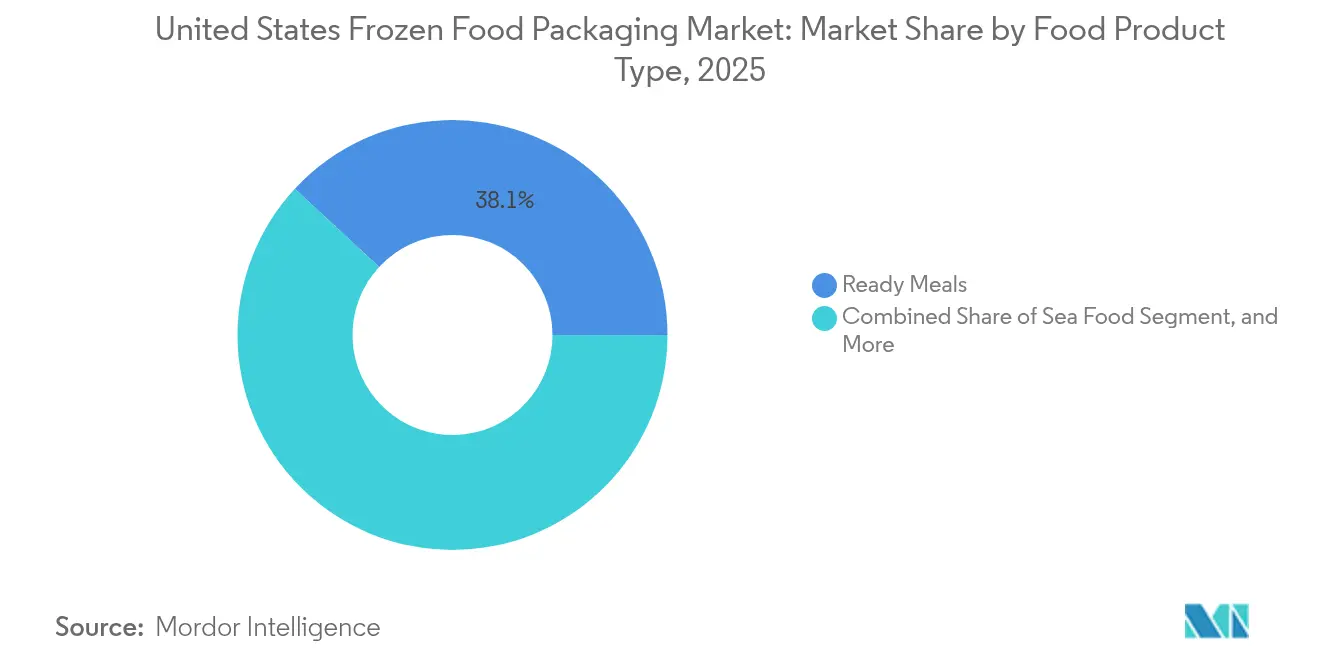
- By food product type, ready meals represented 38.10% of the United States frozen food packaging market share in 2025, whereas seafood packaging is forecast to grow the fastest with a 7.75% CAGR.
- By packaging technology, vacuum packaging dominated the United States frozen food packaging market with a 38.85% share in 2025, but intelligent and active packaging is expected to experience the highest growth, increasing at an 8.45% CAGR through 2031.
Note: Market size and forecast figures in this report are generated using Mordor Intelligence’s proprietary estimation framework, updated with the latest available data and insights as of January 2026.
United States Frozen Food Packaging Market Trends and Insights
Drivers Impact Analysis
| Driver | (~) % Impact on CAGR Forecast | Geographic Relevance | Impact Timeline |
|---|---|---|---|
| Rising Consumer Demand for Convenient Heat-and-Eat Formats | +1.2% | United States urban metros and suburban clusters | Medium term (2-4 years) |
| Growth of Direct-to-Consumer Frozen Meal Subscriptions | +0.9% | Northeast corridor and West Coast | Short term (≤2 years) |
| Surge in Plant-Based Frozen Entrées Requiring Specialized Films | +0.8% | California, New York, Illinois | Medium term (2-4 years) |
| Retailer Private-Label Expansion Driving High-Volume Flexible Packaging | +1.1% | Walmart, Costco, Target distribution networks | Long term (≥4 years) |
| Intelligent Time-Temperature Indicator Labels for Cold-Chain Integrity | +0.6% | National logistics hubs | Long term (≥4 years) |
| Automation of Pouch and Bag Form-Fill-Seal Lines Reducing Cost per Unit | +1.0% | Midwest and Southeast manufacturing clusters | Medium term (2-4 years) |
| Source: Mordor Intelligence | |||
Rising Consumer Demand for Convenient Heat-and-Eat Formats
Microwaveable and oven-ready meals accounted for 62% of new frozen product launches in 2024, up from 48% two years prior.[1]Food Marketing Institute, “2024 Power of Frozen Report: Consumer Trends and Preferences,” Fmi.org Dual-ovenable CPET trays endure 425 °F for 40 minutes, supporting premium positioning and faster shelf turns. Single-serve packs under 12 ounces grew 19% in unit volume in 2024, three times faster than family-size alternatives, reinforcing the need for packaging formats that stack vertically and minimize freezer cube waste. Retailers report that heat-and-eat SKUs cycle 1.7 times faster than conventional entrées, incentivizing shelf re-allocation to tray-based lines. Converters able to supply CPET and coated-paperboard hybrids enjoy pricing power despite the substrate’s 35% cost premium.
Growth of Direct-to-Consumer Frozen Meal Subscriptions
D2C frozen meal sales climbed to USD 2.8 billion in 2024, a 23% jump from 2023.[2]Specialty Food Association, “State of the Specialty Food Industry 2024,” Specialtyfood.com These services bypass store freezers, requiring insulated shippers that maintain temperatures between −10 °F and 10 °F for 48 hours. Korrvu suspension pouches from Sealed Air reduce breakage rates to below 2%, enhancing brand reputation and minimizing returns. Right-sizing initiatives shave USD 1.20-1.80 off excess freight per order, which is critical when D2C gross margins hover near 12-15%. USDA regulations further require tamper-evident seals and freeze-by dating, adding complexity that only converters with digital printing and quality control systems can manage efficiently.
Surge in Plant-Based Frozen Entrées Requiring Specialized Films
Plant-based frozen foods generated USD 1.9 billion in retail revenue in 2024, representing a 17% year-over-year increase.[3]Nielsen Company, “Plant-Based Frozen Foods Market Analysis 2024,” Nielsen.com Oxygen-sensitive pea-protein and mycoprotein matrices force packaging films to achieve OTR values below 0.5 cc/m²-day. Amcor’s AmPrima Encore mono-PE structure meets this spec while remaining store-drop-off recyclable, unlocking incremental shelf space at mass merchandisers. Transparent anti-fog windows, leveraging bio-based surfactants, maintain clarity for 24 months and add only USD 0.03-0.05 per pack, yet blind tests show an 11% sales lift. These demands create a USD 340 million substrate opportunity for converters with barrier-film expertise.
Retailer Private-Label Expansion Driving High-Volume Flexible Packaging
Private labels captured 22.4% of U.S. frozen food revenue in 2024, representing a 340-basis-point increase since 2022. Walmart’s Great Value, Costco’s Kirkland Signature, and Target’s Good and Gather added more than 1,200 combined frozen SKUs during 2024, gravitating toward light-weight pouches that cut freight costs by 40%. Pactiv Evergreen disclosed that private-label volume now stands at 34%, nine points higher than 18 months ago. Lead-time pressure has tightened to four weeks, elevating the value of converters with digital presses that print nutrition panels and promotional codes in a single pass. Shelf-price parity between private label and national brands also narrows the historical gap in packaging quality, compelling suppliers to improve print fidelity and barrier performance simultaneously.
Restraints Impact Analysis
| Restraint | (~) % Impact on CAGR Forecast | Geographic Relevance | Impact Timeline |
|---|---|---|---|
| PFAS and Single-Use Plastics Regulatory Crackdowns | -0.7% | Maine, California, New York, Washington | Medium term (2-4 years) |
| Volatile Resin Prices Compressing Converter Margins | -0.5% | Nationwide | Short term (≤2 years) |
| Limited Curbside Recyclability of Multi-Layer Films | -0.4% | Rural and mid-tier municipalities | Long term (≥4 years) |
| Capital-Intensive Shift Toward Recyclable Mono-Material Structures | -0.6% | Extrusion hubs in Midwest and Southeast | Medium term (2-4 years) |
| Source: Mordor Intelligence | |||
PFAS and Single-Use Plastics Regulatory Crackdowns
California’s AB 1200 bans PFAS in food packaging by 2028, while Maine’s LD 1541 imposes a similar prohibition by 2030. Converters relying on fluorinated grease barriers must reformulate or exit a USD 680 million microwaveable-tray niche. FDA’s voluntary phase-out of long-chain PFAS, announced in 2024, accelerates compliance deadlines. Bio-based alternatives derived from algae and chitosan currently lag CPET-grade grease resistance by 15-20%, adding USD 0.08-0.12 per tray. Smaller regional converters have begun to exit the category, citing USD 2-4 million in reformulation costs per product line.
Volatile Resin Prices Compressing Converter Margins
Polyethylene prices declined 14% through late 2024, then rebounded 9% in Q1 2025 as crude oil prices climbed above USD 80 per barrel. Polypropylene swings were steeper, which complicated budget forecasting and delayed automation upgrades. Fixed-price customer contracts hinder immediate cost pass-through, resulting in a 200-300 basis point reduction in converter margins during price surges. Even converters with hedging strategies recorded USD 18-25 million in unrecovered resin expense in 2024. The uncertainty is dampening capital outlays for mono-material PE extrusion lines, which carry USD 8-12 million in retooling costs per plant.
Segment Analysis
By Material: Fiber Substrates Gain Traction Amid Recyclability Push
Paper and paperboard are projected to advance at a 7.35% CAGR to 2031, outpacing all other substrates, as Walmart and Target incorporate curbside-recyclable requirements into their 2025 supplier contracts. Graphic Packaging logged a 16% year-over-year rise in frozen-food paperboard shipments during 2024, underscoring volume momentum. Amcor’s AmFiber paper tray, launched in late 2024, withstands freezer conditions and microwave reheating without a polyethylene laminate, helping brands secure retailer sustainability credits. Plastic maintained a 46.15% share of the United States frozen food packaging market in 2025, yet its growth has moderated. The United States frozen food packaging market size for plastic is expected to inch forward at a mid-single-digit rate as PFAS bans and mono-material demands accelerate capital spending. Metal cans remain relegated to frozen juice concentrates and institutional vegetables, while glass is nearly absent due to weight and breakage risks.
Plastic’s dominance persists because mono-PE pouches achieve sub-1 cc/m²-day oxygen transmission rates at half the weight of coated board, favoring applications such as frozen fruits and single-serve entrées. Nevertheless, fiber trays now qualify for municipality curbside programs in 72% of U.S. ZIP codes, improving end-of-life economics for retailers. Converters must juggle a wider substrate slate, often stocking six platforms versus three a decade ago, which raises working-capital burdens but also permits tailored solutions that match product viscosity, headspace, and reheat method.
Note: Segment shares of all individual segments available upon report purchase
Get Detailed Market Forecasts at the Most Granular Levels
Download PDF
By Packaging Format: Automation Favors Flexible Structures
Flexible structures held a 54.10% share in 2025, driven by high-speed horizontal FFS lines that reduce labor costs by 22%. These lines fill 180 pouches per minute for vegetables and 100 for chunky entrée fillings, driving a 6.9% CAGR for flexibles through 2031. Sealed Air’s recyclable PE pouch won Association of Plastic Recyclers recognition in 2024 and unlocked distribution at Walmart by enabling How2Recycle labeling. Rigid packaging format retained a 45.90% share, supported by the oven-ready performance required in premium entrées.
While rigid formats expand at a slower rate, innovations such as Sabert’s pulp-based post-consumer recycled (PCR) polypropylene tray reduce carbon footprint by 28%, softening sustainability concerns. Flexible pouches improve pallet cube efficiency by 18% and shrink blast-freezer energy use by 11%. Yet they require outer corrugated cases for pallet stability, adding USD 0.06-0.09 per unit. Trays self-stack, cutting secondary-packaging costs but sacrificing shipping density. The divergence means that high-velocity value lines lean toward pouches, whereas premium SKUs priced above USD 6.50 per unit continue to favor ridged CPET or PCR-PP trays, which communicate quality through their heft.
By Packaging Product: Trays Accelerate on Dual-Ovenable Appeal
Trays are on course for a 7.22% CAGR as consumers gravitate toward ‘oven-to-table’ convenience. CPET withstands 425 °F, enabling crust development and browning unattainable in microwave-only formats. Genpak’s 2025 snap-fit lid combines CPET bases with recyclable paperboard tops, meeting retailer scorecards while maintaining shelf strength. Bags and pouches retained a 31.25% volume share in 2025, dominating the category, although stand-up pouches with reclose zippers are siphoning market share within the broader bag category.
Polypropylene trays offer a 35% cost savings over CPET but cap reheat temperatures at 375°F, confining usage to microwave-only entrées. Brands transitioning frozen vegetables from trays to pillow bags posted a 9% gross margin gain in 2024, indicating that commoditized items will continue to favor low-cost, flexible formats. Cans, which account for just 12% of the volume, face a structural decline as consumer preference tilts toward refrigerated, not-from-concentrate beverages. The ‘other’ grouping, comprising lidding films, overwraps, and shrink bands, grew 19% in 2024 as D2C channels demanded tamper-evident and intelligent labels.
By Food Product Type: Seafood Outpaces in Premium Pricing
Seafood packaging is set to climb at an 7.75% CAGR through 2031. Vacuum-skin technology extends shelf life to 24 months, maintaining protein color and supporting retail prices of USD 12-18 per pound. Sealed Air’s Grip and Tear film enables one-handed opening, reducing product returns associated with difficult packaging. Ready meals dominated the market, accounting for 38.10% of the 2025 volume, as single-serve portions under 12 ounces expanded by 19%, while family packs lagged.
Meat packaging growth is modest as plant-based analogs siphon market share; frozen beef patty sales dropped 4% in 2024, while plant-based burgers climbed 11%. Fruits and vegetables, although high in tonnage, face razor-thin margins that cap packaging budgets at USD 0.22 per pound. The ‘other’ category, including frozen appetizers, desserts, and specialty bakery goods, grew 7% driven by premium ice cream pints and artisan pizza crusts, but remains fragmented across small SKU volumes, keeping packaging runs short and favoring digital print.
Note: Segment shares of all individual segments available upon report purchase
Get Detailed Market Forecasts at the Most Granular Levels
Download PDF
By Packaging Technology: Intelligence Adds Real-Time Assurance
Intelligent and active systems are forecast to rise at an 8.45% CAGR, the swiftest among technology classes. Brands embed oxygen scavengers and time-temperature indicators (TTIs) that shift color when cumulative exposure exceeds safety thresholds. Whole Foods has mandated TTIs on frozen seafood priced above USD 15 per pound, a policy covering 68% of its SKU roster. Vacuum packaging maintained a 38.85% share in 2025 and remains the mainstay for premium meats and seafood.
Cryovac’s Darfresh skin-pack reduces headspace by 22%, enabling 14% more units per pallet and trimming distribution cost. Modified atmosphere packaging (MAP) is gaining acceptance for organic vegetables, where nitrogen flushing helps preserve vitamin C and prevent surface browning. Active packaging extends the shelf life of frozen bread by 40%, allowing retailers to order larger quantities without incurring spoilage risk. The United States frozen food packaging market size for intelligent solutions is thus poised to compound faster than any other technology tranche, although cost premiums of USD 0.08-0.12 per pack limit adoption among value lines.
Geography Analysis
California, Texas, Florida, New York, and Illinois accounted for 47% of frozen food consumption in 2025, demonstrating the geographic concentration that defines the United States frozen food packaging market. The Northeast posted the highest per-capita frozen meal intake at 62 pounds per person, benefiting from superior cold-chain infrastructure and dense urban populations. By contrast, the Midwest dominates frozen vegetable processing, with Iowa, Minnesota, and Wisconsin accounting for 34% of national FFS capacity, which serves institutional buyers such as schools and hospitals.
Sun Belt states are experiencing population-led channel expansion. Arizona, Nevada, and North Carolina each experienced growth in retail frozen-food square footage between 8% and 11% in 2024, significantly outpacing the 3% U.S. average. Coastal metros generate 71% of D2C orders, reflecting higher household incomes and household time constraints. However, regulatory patchwork complicates supply chains: Washington’s HB 1799 imposes a 25% PCR content minimum by 2031, whereas Maine and California have already legislated PFAS bans that take effect before 2030.
Rural regions in the Mountain West and Great Plains rely on older blast-freezer assets that consume 20% more energy per pallet, raising landed packaging costs. Ethnic food demand is surging in Texas and California, where immigrant populations exceed 25%. These cuisines often require steam-venting films and grease-resistant coatings, which raises per-unit packaging spend by up to 20% but delivers incremental shelf-price premiums that justify the added cost. The United States frozen food packaging market, therefore, exhibits strong regional disparities that reward converters capable of flexing their production footprints and substrate offerings.
Competitive Landscape
The top five converters, Amcor, Pactiv Evergreen, Sealed Air, Graphic Packaging, and Smurfit Kappa, controlled roughly 42-48% of 2024 revenue, indicating moderate market concentration. Minimum economic plant scale exceeds USD 40 million in annual sales, deterring new entrants. Amcor’s AmPrima and AmFiber lines, Sealed Air’s Cryovac recyclable pouches, and Pactiv Evergreen’s EverGreen fiber trays all debuted in 2024, signaling an innovation race to meet retailer recyclability targets. Smaller players, such as Printpack and Genpak, compete on lead time, leveraging digital print to reduce order-to-delivery windows to four weeks—half the industry average.
Circular-resin partnerships are emerging as differentiation levers. Novolex signed a supply deal with Eastman for chemically recycled PE totaling 8 million pounds annually, while LyondellBasell is co-developing PCR-rich mono-PE films with multiple converters. Patent activity underscores the intensifying trend of R&D investment; Amcor filed 14 frozen-food packaging patents in 2024, while Sealed Air secured nine covering vacuum-skin innovations. Automation is another frontier: plants that installed vision inspection and robotic case packing posted 31% throughput increases and 14% labor savings, widening performance gaps that pressure laggards to invest or exit.
Regulatory compliance is fast becoming a moat. Converters earning recognition from the Association of Plastic Recyclers for mono-PE structures gain priority placement at Walmart and Target, driving 8-12% volume increases. Those delaying conversion face a risk to their shelf space as retailer contracts now include recyclability clauses. Active packaging suppliers remain fragmented, creating a white space for mid-tier brands seeking cost-effective TTIs. Overall, the competitive dynamics of the United States frozen food packaging market favor scale, sustainability alignment, and digital agility.
United States Frozen Food Packaging Industry Leaders
Amcor Plc
Sealed Air Corporation
Smurfit WestRock
Crown Holdings Inc.
Ball Corporation
- *Disclaimer: Major Players sorted in no particular order
Need More Details on Market Players and Competitors?
Download PDF
Recent Industry Developments
- November 2025: Amcor will invest USD 85 million to install two new extrusion lines at its Oshkosh, Wisconsin site, lifting annual output of AmPrima Encore mono-PE films for frozen foods to roughly 120 million lb and helping brands satisfy Walmart and Target recyclability mandates set for 2026.
- September 2025: Pactiv Evergreen signed a five-year supply agreement worth an estimated USD 180 million per year with Costco, under which it will furnish EverGreen fiber trays coated with a recyclable aqueous barrier for Kirkland Signature frozen entrees, vegetables, and seafood sold in all 580 U.S. warehouse clubs.
- June 2025: Sealed Air debuted Cryovac SmartSense for frozen seafood, an NFC-enabled package that tracks time-temperature exposure throughout distribution and links to retailer inventory systems, a move expected to cut spoilage-related returns by about 18% in line with FDA cold-chain guidance.
- March 2025: Graphic Packaging purchased a 340,000-sq-ft thermoforming plant in Columbus, Ohio for USD 52 million, adding 28% more CPET tray capacity and strengthening its position in the fast-growing dual-ovenable segment favored by quick-service restaurant retail lines.
United States Frozen Food Packaging Market Report Scope
The United States frozen food packaging industry involves the development and production of packaging solutions specifically designed to preserve and protect frozen food products during storage, transportation, and distribution. This industry plays a crucial role in maintaining the quality, safety, and shelf life of frozen foods.
The United States frozen food packaging industry report is segmented by Material (Plastic, Paper and Paperboard, Metal, Glass), Packaging Format (Flexible, Rigid), Packaging Product (Bags and Pouches, Trays, Cans, Other Packaging Products), Food Product Type (Ready Meals, Fruits and Vegetables, Meat, Seafood, Other Food Product Types), and Packaging Technology (Modified Atmosphere Packaging, Vacuum Packaging, Intelligent/Active Packaging, Other Packaging Technologies). The Market Forecasts are Provided in Terms of Value (USD).
By Material
| Plastic |
| Paper and Paperboard |
| Metal |
| Glass |
By Packaging Format
| Flexible |
| Rigid |
By Packaging Product
| Bags and Pouches |
| Trays |
| Cans |
| Other Packaging Products |
By Food Product Type
| Ready Meals |
| Fruits and Vegetables |
| Meat |
| Sea Food |
| Other Food Product Types |
By Packaging Technology
| Modified Atmosphere Packaging (MAP) |
| Vacuum Packaging |
| Intelligent / Active Packaging |
| Other Packaging Technologies |
| By Material | Plastic |
| Paper and Paperboard | |
| Metal | |
| Glass | |
| By Packaging Format | Flexible |
| Rigid | |
| By Packaging Product | Bags and Pouches |
| Trays | |
| Cans | |
| Other Packaging Products | |
| By Food Product Type | Ready Meals |
| Fruits and Vegetables | |
| Meat | |
| Sea Food | |
| Other Food Product Types | |
| By Packaging Technology | Modified Atmosphere Packaging (MAP) |
| Vacuum Packaging | |
| Intelligent / Active Packaging | |
| Other Packaging Technologies |
Need A Different Region or Segment?
Customize Now
Key Questions Answered in the Report
What is the projected value of United States frozen food packaging by 2031?
The market is forecast to reach USD 20.86 billion by 2031.
Which packaging format is growing fastest in U.S. frozen foods?
Dual-ovenable trays are expanding at a 7.22% CAGR through 2031.
How do PFAS regulations affect frozen food packaging suppliers?
Bans in California and Maine force reformulation of grease-resistant coatings, raising costs and driving R&D into bio-based barriers.
Why are plant-based frozen entrées reshaping packaging demand?
They require films with ultra-low oxygen transmission rates, spurring a USD 340 million barrier-substrate niche.
Which U.S. regions dominate D2C frozen meal shipments?
Coastal metros in the Northeast and West Coast generate roughly 71% of D2C orders.
How is automation impacting converter cost structures?
High-speed FFS lines cut labor expense by roughly 22% and increase throughput by about 31%.


