Market Overview
| Study Period | 2018 - 2031 |
|---|---|
| Base Year For Estimation | 2025 |
| Forecast Data Period | 2026 - 2031 |
| Market Size (2026) | USD 1.43 Trillion |
| Market Size (2031) | USD 1.72 Trillion |
| Growth Rate (2026 - 2031) | 3.80% CAGR |
| Market Concentration | Low |
Major Players *Disclaimer: Major Players sorted in no particular order Image © Mordor Intelligence. Reuse requires attribution under CC BY 4.0. | |

United States Freight And Logistics Market Analysis by Mordor Intelligence
The United States freight and logistics market is expected to grow from USD 1,381.09 billion in 2025 to USD 1,433.58 billion in 2026 and is forecast to reach USD 1,724.6 billion by 2031 at 3.8% CAGR over 2026-2031. This moderate trajectory reflects a maturing yet resilient landscape shaped by e-commerce fulfillment, nearshoring-driven manufacturing flows, and rapid technology adoption. Shippers shift from asset-heavy to digitally orchestrated networks, unlocking capacity optimization and real-time visibility across modes. Federal Infrastructure Investment and Jobs Act (IIJA) funds earmarked for roads, rail, and ports underpin long-term network reliability, while zero-emission truck pilots signal an accelerating transition toward sustainable transport. Competitive intensity tightens as large mergers reshape global forwarding capabilities, even as regional specialists carve niche positions around last-mile and temperature-controlled services.
Key Report Takeaways
- By logistics function, freight transport led with 62.85% of the United States freight and logistics market size in 2025, while courier, express, and parcel (CEP) is projected to expand at a 4.38% CAGR between 2026-2031.
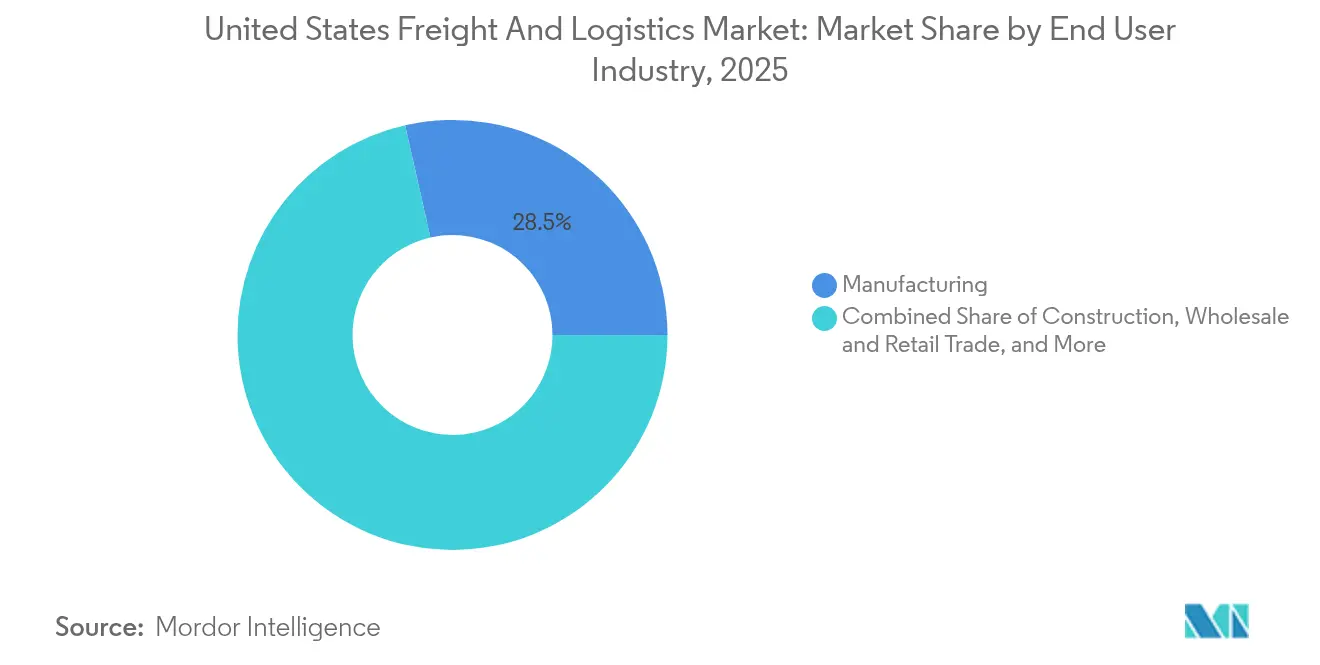
- By end user industry, manufacturing captured 28.54% of the United States freight and logistics market share in 2025, whereas wholesale and retail trade is forecast to grow fastest at a 4.05% CAGR between 2026-2031.
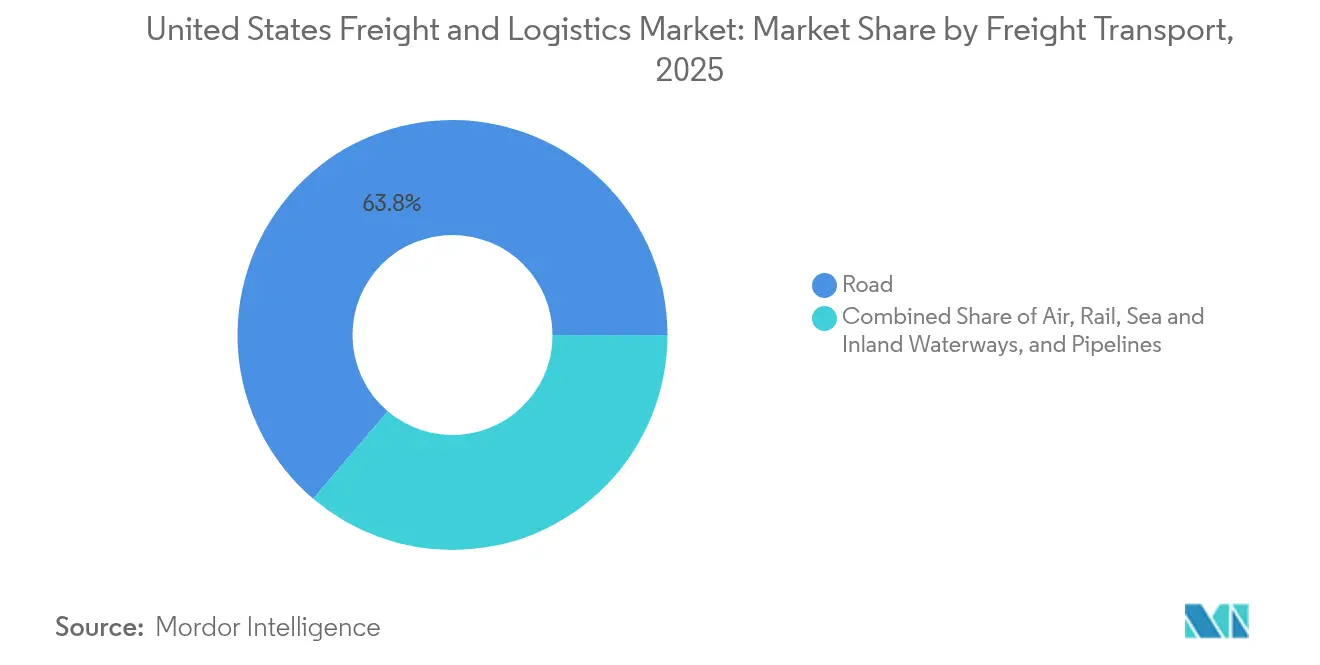
- By freight transport mode, road freight commanded 63.78% of the revenue share in 2025, while air freight is expected to advance at a 4.28% CAGR between 2026-2031.
- By freight forwarding mode, sea and inland waterways freight forwarding accounted for a 54.55% share in 2025, yet air freight forwarding is expected to post the highest 3.84% CAGR between 2026-2031.
- By CEP type, domestic shipments held a 76.05% revenue share in 2025, while international shipments are poised for a 4.65% CAGR between 2026-2031.
- By warehousing and storage type, non-temperature controlled facilities dominated with 92.05% share in 2025, whereas temperature controlled space is projected to grow at a 3.64% CAGR between 2026-2031.
Note: Market size and forecast figures in this report are generated using Mordor Intelligence’s proprietary estimation framework, updated with the latest available data and insights as of January 2026.
United States Freight And Logistics Market Trends and Insights
Drivers Impact Analysis
| Driver | (~) % Impact on CAGR Forecast | Geographic Relevance | Impact Timeline |
|---|---|---|---|
| Explosive B2C E-Commerce parcel volumes | +0.8% | National, metro centers | Short term (≤ 2 years) |
| Reshoring-driven domestic manufacturing freight flows | +0.6% | Great Lakes, Southeast, Southwest | Medium term (2-4 years) |
| Expansion of 3PL/4PL outsourcing across mid-market shippers | +0.4% | National, tier-2 metros | Medium term (2-4 years) |
| Federal Infrastructure Investment and Jobs Act (IIJA) funding | +0.3% | National freight corridors | Long term (≥ 4 years) |
| Digital freight marketplaces and API-based capacity aggregation | +0.2% | National, dense lanes | Short term (≤ 2 years) |
| Zero-emission truck corridor pilots (hydrogen / BEV) | +0.1% | CA, TX, Northeast | Long term (≥ 4 years) |
| Source: Mordor Intelligence | |||
Understand The Key Trends Shaping This Market
Download PDF
Explosive B2C E-Commerce Parcel Volumes
Domestic parcel shipments increased in 2024, intensifying demand for high-frequency, short-haul movements. Amazon’s February 2025 collaboration with FedEx on large packages reinforces distributed fulfillment models that blur lines between retailers and carriers. Consumers expect same-day and next-day delivery, compelling providers to hold reserve capacity during off-peak periods. Regional carriers and last-mile specialists gain share as incumbents manage margin pressure from the groundification of formerly premium air services. The shift toward direct-to-consumer channels reroutes freight from palletized to parcel flows, reshaping lane density and asset utilization requirements.
Reshoring-Driven Domestic Manufacturing Freight Flows
Supply-chain localization accelerates, supported by the CHIPS Act and the Inflation Reduction Act incentives totaling USD 280 billion[1]White House, “Implementation of the CHIPS and Science Act,” whitehouse.gov. Semiconductor, automotive, and pharmaceutical projects concentrate freight demand in the Great Lakes and Southeast corridors. Shorter domestic routes increase reliance on trucking for time-critical components while competing for limited long-haul capacity. Rate premiums emerge on dense manufacturing lanes as reshored volumes stress existing networks, despite ongoing rail and port expansions. State-level incentives amplify regional freight nodes, reinforcing multimodal connectivity priorities.
Expansion of 3PL/4PL Outsourcing Across Mid-Market Shippers
Mid-sized shippers divest non-core logistics activities to third- and fourth-party providers to access technology platforms and scale economies. Unified control-tower solutions offer end-to-end visibility and modal orchestration without heavy capital outlays. Regional 3PLs win contracts by tailoring services to local regulations and facility footprints, while global providers bundle multimodal offerings for complex supply chains. Service quality, cost transparency, and data integration remain decisive selection criteria, driving investment in API connectivity and predictive analytics. Asset-light models also mitigate balance-sheet risk for shippers facing volatile demand.
Infrastructure Investment and Jobs Act (IIJA) Funding
The IIJA allocates USD 110 billion to roads and bridges, USD 66 billion to rail, USD 25 billion to airports, and USD 17 billion to ports[2]Congressional Budget Office, “Infrastructure Investment and Jobs Act Scorekeeping,” cbo.gov. Projects such as the Howard Street Tunnel expansion unlock double-stack clearance for intermodal trains, enhancing East Coast port competitiveness. Multimodal grants promote seamless truck-rail-port interfaces, cutting dwell times and emissions. Construction activity temporarily restricts capacity in certain corridors, though long-term net throughput gains outweigh near-term slowdowns. Labor shortages in construction trades could delay completion, extending the investment’s demand stimulus.
Restraints Impact Analysis
| Restraint | (~) % Impact on CAGR Forecast | Geographic Relevance | Impact Timeline |
|---|---|---|---|
| Acute long-haul driver shortage and wage inflation | -0.5% | National, long-haul lanes | Short term (≤ 2 years) |
| Port, rail-ramp and urban congestion bottlenecks | -0.3% | West Coast ports, Chicago hub | Medium term (2-4 years) |
| Escalating cyber-risk insurance and compliance costs | -0.2% | National | Short term (≤ 2 years) |
| “Nuclear” jury verdicts driving motor-carrier insurance spikes | -0.2% | Litigation-prone states | Medium term (2-4 years) |
| Source: Mordor Intelligence | |||
Acute Long-Haul Driver Shortage and Wage Inflation
Large carriers continued battling elevated turnover in 2024 as an aging workforce and lifestyle concerns deter new entrants[3]Bureau of Labor Statistics, “Employment Situation in Truck Transportation,” bls.gov. Wage packages climbed as fleets offered signing bonuses, improved home time, and benefit enhancements. Electronic Logging Device mandates and hours-of-service limits reduce effective capacity even when equipment is available. Female and younger worker participation remains low, keeping the labor pool tight. Apprenticeship programs and modernized fleet amenities improve recruitment optics but have yet to close the gap.
Port, Rail-Ramp and Urban Congestion Bottlenecks
Los Angeles/Long Beach port surges pushed rail dwell times higher during the 2024 peak months. Chicago’s rail hub struggles with interchange delays, cascading across transcontinental routes. Urban truck trips lose productivity to congestion, while truck parking scarcity, 1 space per 11 trucks, forces rule violations or extended empty miles[4]Federal Highway Administration, “Freight Performance Measures,” fhwa.dot.gov. Port automation plans face labor resistance, delaying throughput improvements. IIJA projects will ease bottlenecks, yet most come online post-2027.
Segment Analysis
By End User Industry: Manufacturing Leads; Wholesale and Retail Trade Accelerates
Manufacturing contributed 28.54% to the United States freight and logistics market size in 2025 as component inflows and finished-goods distribution multiplied with reshoring incentives. The sector favors multimodal solutions that balance cost and cycle-time, with high-value electronics and pharmaceuticals leaning on expedited services. Wholesale and retail trade, though smaller, posts the fastest 4.05% CAGR (2026-2031) as omnichannel retailing scales micro-fulfillment nodes and parcel density. Construction logistics remain steady on public infrastructure outlays, while oil, gas, mining, and quarrying see volatility tied to commodity pricing and energy policy transitions.
Agriculture, fishing, and forestry maintain a stable baseline of bulk and refrigerated moves, though seasonal variability drives flexible capacity requirements. Emerging verticals, renewable energy components, healthcare devices, and data-center equipment demand specialized handling and regulatory compliance, favoring providers with sector expertise. Across industries, supply-chain localization shifts more volume onto regional trucking lanes, intensifying competition for drivers and warehouse labor in growth corridors.
Note: Segment shares of all individual segments available upon report purchase
Get Detailed Market Forecasts at the Most Granular Levels
Download PDF
By Logistics Function: CEP Growth Outpaces Transport Dominance
Freight transport captured 62.85% of the United States freight and logistics market share in 2025, anchored by trucking, rail, and intermodal networks that serve bulk commodities and manufacturing supply chains. CEP, while smaller, posted the strongest 4.38% CAGR (2026-2031) outlook, fueled by e-commerce parcel density clustering around metropolitan fulfillment hubs. Domestic CEP services held 76.05% share, though international small-parcel flows rise on Cross-Border e-commerce demand, supported by simplified de minimis clearance rules. Warehousing and storage demand remains robust, with non-temperature facilities comprising 92.05% of capacity in 2025, yet temperature-controlled square footage expands faster on pharmaceuticals and fresh-food logistics.
Providers blur functional lines as integrated offerings combine transportation, warehousing, and value-added services to capture deeper wallet share. Digital orchestration platforms enable real-time mode selection and inventory balancing across facility networks. CEP operators deploy automated sortation and AI-driven route optimization to offset labor constraints. In freight transport, zero-emission truck pilots and IIJA-funded corridor upgrades will alter fleet mix and regional efficiencies. The convergence of services positions full-stack providers to capitalize on secular shifts while niche specialists succeed by focusing on speed, compliance, or product integrity.
By Courier, Express, and Parcel: Domestic Density, International Upside
Domestic CEP networks manage 76.05% of parcel flows but face margin compression as “groundification” shifts shipments from air to ground services. Amazon’s renewed FedEx partnership for oversized items expands collaborative yet competitive boundary lines. International CEP posts a 4.65% CAGR (2026-2031), supported by direct-to-consumer marketplaces and streamlined customs for low-value parcels. Automation in sortation and micro-fulfillment improves cost per package, while driver shortages elevate interest in autonomous ground units and drone pilots.
Urban delivery sustainability programs promote electric vans and cargo bikes in congestion zones, reducing emissions and parking fines. Regional carriers leverage localized networks to handle spikes during national carrier capacity caps, winning contracts from niche e-tailers. Technology integration across labeling, tracking, and returns management is now a prerequisite for carrier selection by high-frequency shippers.
By Warehousing and Storage: Cold Chain Premium Expansion
Non-temperature-controlled facilities dominate the market with a 92.05% share in 2025, but temperature-controlled space grows at a 3.64% CAGR (2026-2031) as biologics, fresh food, and vaccine logistics proliferate. Lineage Logistics expands its footprint while deploying energy-efficiency retrofits that cut operating costs and attract ESG-minded customers. Robotics and automated storage systems address labor gaps and improve throughput in both ambient and cold environments.
E-commerce fosters micro-fulfillment nodes nearer to consumers, shortening delivery windows and lowering last-mile costs. IIJA-funded road and utility upgrades lower site-selection barriers for new warehouses along secondary corridors. Sustainability objectives drive solar installations, LED lighting, and advanced insulation that reduce kilowatt-hour per pallet metrics and serve as differentiators in RFP evaluations.
By Freight Transport: Road Dominance Faces Modal Shifts
Road freight held 63.78% of the United States freight and logistics market share in 2025, reflecting unmatched door-to-door capability and time-definite flexibility. Air freight, projected at a 4.28% CAGR (2026-2031), benefits from e-commerce urgency and shippers hedging against ocean disruptions. Rail gains intermodal container volumes aided by IIJA’s USD 66 billion rail allocation, yet suffers near-term constraints at congested hubs. Sea and inland waterways remain vital for bulk and container imports, while the pipeline serves stable petroleum and chemical flows with limited growth upside.
Driver shortages, nuclear verdict risks, and sustainability mandates encourage some shippers to shift dense, predictable freight to rail or intermodal. Meanwhile, electrification corridors in California and Texas position battery-electric trucks for regional hauls, potentially clawing share back from rail on select lanes. Integrated planning tools that factor emissions, dwell times, and total landed cost are reshaping modal decisions in bid events and annual contracts.
Note: Segment shares of all individual segments available upon report purchase
Get Detailed Market Forecasts at the Most Granular Levels
Download PDF
By Freight Forwarding: Sea Leadership Meets Air Momentum
Sea and inland waterways freight forwarding controlled 54.55% forwarding revenue in 2025, leveraging cost efficiencies for containerized imports at West and Gulf Coast ports. Air freight forwarding grows at a 3.84% CAGR (2026-2031) as supply-chain risk mitigation and high-value cargo needs justify premium rates. Road and rail forwarding support integrated door-to-door chains, especially for nearshoring flows from Mexico. Digital platforms standardize booking, documentation, and milestone visibility, lowering barriers for mid-market shippers.
Consolidation accelerates with DSV completing its USD 15.8 billion DB Schenker acquisition in April 2025, redefining global scale advantages. Forwarders differentiate through alternative routings during port congestion and through sector-specific compliance expertise. Growth prospects favor providers that bundle customs brokerage, trade financing, and visibility dashboards into a single operating model.
Geography Analysis
California, Texas, and the Great Lakes together account for the largest share of the United States freight and logistics market activity, thanks to port gateways, cross-border trade, and dense manufacturing ecosystems. Port of Los Angeles/Long Beach anchors Pacific imports, while Texas leverages energy exports and nearshoring flows through Laredo and El Paso crossings. The Southeast posts above-average growth as automotive and aerospace manufacturers cluster around cost-competitive labor markets and multimodal access.
Cross-border truck crossings with Mexico set record highs in 2024 as reshoring shifts component sourcing closer to final assembly lines. IIJA projects such as I-10 corridor upgrades and the Howard Street Tunnel expansion redistribute freight density, offering alternative routings that relieve coastal chokepoints. Rural regions gain parcel volume as e-commerce penetration deepens, requiring investment in regional sort centers and last-mile capacity.
Climate resilience considerations spur route diversification around wildfire-prone Western corridors and hurricane-exposed Gulf nodes. States adopt varied emissions mandates, with California’s zero-emission rules influencing fleet decisions nationwide. Competitive dynamics tilt toward providers that can navigate regulatory patchworks, secure scarce warehouse labor in fast-growing metros, and maintain flexible capacity for weather-related disruptions.
Competitive Landscape
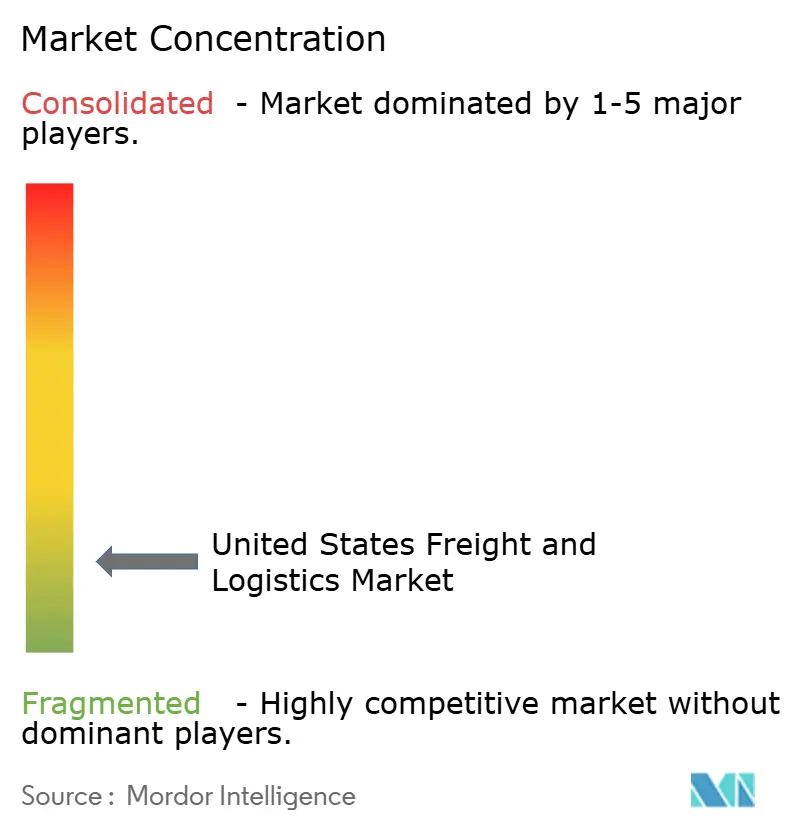
Market is fragmented; however, slight consolidation started with DSV’s acquisition of DB Schenker and Kuehne+Nagel’s purchase of IMC Logistics, expanding network density while prompting divestitures that open space for regional entrants. Scale yields purchasing leverage, multimodal cross-selling, and technology investment capacity. Yet niche players thrive by offering specialized cold chain, heavy-haul, or final-mile services neglected by mega-providers.
Technology remains a primary differentiator. Digital freight brokers aggregate fragmented capacity via APIs, providing shippers with instant quotes and predictive ETAs. Incumbents invest in cloud TMS platforms, telematics-driven driver coaching, and emissions tracking dashboards to meet shipper sustainability criteria. Private fleets at Amazon, Walmart, and Home Depot extend competitive pressure by internalizing high-volume lanes, thereby tightening spot market capacity and influencing contract rates.
Sustainability commitments reshape fleet procurement. UPS’s 10,000-unit electric-vehicle order and FedEx’s carbon-neutral 2040 pledge provoke broader adoption of electric and hydrogen trucks. Providers with transparent decarbonization road maps gain an edge in RFPs from ESG-focused shippers. Driver recruitment programs, tuition reimbursement, modern cabs, and predictable schedules also emerge as brand differentiators in a tight labor market.
United States Freight And Logistics Industry Leaders
United Parcel Service (UPS)
FedEx
Amazon Logistics
C.H. Robinson
J.B. Hunt Transport
- *Disclaimer: Major Players sorted in no particular order
Need More Details on Market Players and Competitors?
Download PDF
Recent Industry Developments
- May 2025: GXO Logistics accelerated expansion in healthcare logistics through specialized temperature-controlled facilities and regulatory compliance services.
- May 2025: Amazon renewed its strategic partnership with FedEx for oversized parcels while expanding its own LTL services.
- April 2025: DSV completed its USD 15.8 billion acquisition of DB Schenker, forming the world’s largest forwarding network.
- April 2024: J.B. Hunt extended a multi-year dedicated transport agreement with Walmart to optimize national store replenishment.
United States Freight And Logistics Market Report Scope
Agriculture, Fishing, and Forestry, Construction, Manufacturing, Oil and Gas, Mining and Quarrying, Wholesale and Retail Trade, Others are covered as segments by End User Industry. Courier, Express, and Parcel (CEP), Freight Forwarding, Freight Transport, Warehousing and Storage are covered as segments by Logistics Function.End User Industry
| Agriculture, Fishing, and Forestry |
| Construction |
| Manufacturing |
| Oil and Gas, Mining and Quarrying |
| Wholesale and Retail Trade |
| Others |
Logistics Function
| Courier, Express, and Parcel (CEP) | By Destination Type | Domestic |
| International | ||
| Freight Forwarding | By Mode of Transport | Air |
| Sea and Inland Waterways | ||
| Others | ||
| Freight Transport | By Mode of Transport | Air |
| Pipelines | ||
| Rail | ||
| Road | ||
| Sea and Inland Waterways | ||
| Warehousing and Storage | By Temperature Control | Non-Temperature Controlled |
| Temperature Controlled | ||
| Other Services | ||
| End User Industry | Agriculture, Fishing, and Forestry | ||
| Construction | |||
| Manufacturing | |||
| Oil and Gas, Mining and Quarrying | |||
| Wholesale and Retail Trade | |||
| Others | |||
| Logistics Function | Courier, Express, and Parcel (CEP) | By Destination Type | Domestic |
| International | |||
| Freight Forwarding | By Mode of Transport | Air | |
| Sea and Inland Waterways | |||
| Others | |||
| Freight Transport | By Mode of Transport | Air | |
| Pipelines | |||
| Rail | |||
| Road | |||
| Sea and Inland Waterways | |||
| Warehousing and Storage | By Temperature Control | Non-Temperature Controlled | |
| Temperature Controlled | |||
| Other Services | |||
Need A Different Region or Segment?
Customize Now
Market Definition
- Agriculture, Fishing, and Forestry (AFF) - This end user industry segment captures the external (outsourced) logistics expenditure incurred by the AFF industry players. The end user players considered are the establishments primarily engaged in growing crops, raising animals, harvesting timber, harvesting fish & other animals from their natural habitats and providing related support activities. Herein, Logistics Service Providers (LSPs) play a crucial role in acquisition, storage, handling, transportation, and distribution activities for the optimal & continuous flow of inputs (seeds, pesticides, fertilizers, equipment, and water) from manufacturers or suppliers to the producers and smooth flow of output (produce, agro-goods) to distributors/ consumers. This includes both termperature controlled and non-temperature controlled logistics, as and when required according to the shelf life of goods being transported or stored.
- Construction - This end user industry segment captures the external (outsourced) logistics expenditure incurred by the construction industry players. The end user players considered are the establishments primarily engaged in constructing, repairing and renovating residential & commercial buildings, infrastructure, engineering works, subdividing and developing land. Logistics Service Providers (LSPs) play a crucial role in increasing profitability of construction projects by maintaing the inventory of raw materials & equipment, time-critical supplies and by providing other value added services for effective project management.
- Courier, Express, and Parcel - The Courier, Express, and Parcel services, often called as CEP Market, refers to the logistics and postal service providers which specialize in moving small goods (parcels/packages). It captures the overall market size (USD) and market volume (number of parcels) of (1) the shipments/parcels/packages which are under 70kgs/ 154lbs weight, (2) Business Customer packages viz. Business-to-Business (B2B) & Business-to-Consumer (B2C) as well as private customer packages (C2C), (3) non-express parcel delivery services (Standard and Deferred) as well as express parcel delivery services (Day-Definite-Express and Time-Definite-Express), (4) domestic as well as international parcels.
- Demographics - To analyse total addressable market demand, population growth & forecasts have been studied and presented in this industry trend. It represents population distribution across categories like gender (male/female), development area (urban/rural), major cities among other key parameters like population density and final consumption expenditure (growth and share % of GDP). This data has been used for assessing the fluctations in demand & consumption expenditure, and the major hotspots (cities) of potential demand.
- Export Trends and Import Trends - Overall logistics performance of an economy is positively and significantly (statistically) correlated to its trade performance (exports and imports). Hence, in this industry trend, total value of trade, major commodities/ commodity groups and the major trade partners, for the studied geography (country or region as per the scope of report) have been analysed alongside the impact of major trade/logistics infrastructure investments & regulatory environment.
- Freight Forwarding - Freight forwarding which herein refers to the freight transportation arrangement (FTA) industry includes establishments primarily engaged in arranging & tracking transportation of freight between shippers and carriers. Logistics Service Providers (LSPs) considered are freight forwarders, NVOCCs, custom brokers and marine shipping agents. Others segment under Freight Forwarding captures the revenue earned through value added services of FTA like custom brokerage/clearance activities, preparation of freight related documentation, consolidation-deconsolidation of goods, cargo insurance & compliance, arrangement of warehousing & storage, liasing with shippers, and freight forwarding through other modes of transport viz. road and rail.
- Freight Pricing Trends - Freight pricing by mode of transport (USD/tonkm), over the review period, has been presented in this industry trend. The data has been used in assessing the inflationary environment, impact on trade, freight turnover (tonkm), freight and logistics market demand by mode of transport segments and hence the overall freight and logistics market size.
- Freight Tonnage Trends - Freight tonnage (weight of goods in tons) handled by mode of transport, over the review period, has been presented in this industry trend. The data has been used as one of the parameters apart from average distance per shipment (km), freight volume (tonkm), and freight pricing (USD/tonkm) to assess the freight transport market size.
- Freight Transport - Freight Transport refers to the hiring of a logistics service provider (outsourced logistics) for the transport of commodities (raw materials/final/intermediate/finished goods including both solids and fluids) from the origin to a destination within the country (domestic) or cross-border (international).
- Freight and Logistics - External expenditure on (or outsourced) facilitation of freight transport (freight transportation), arrangement of freight transport through an agent (freight forwarding), warehousing and storage (temperature controlled or non-temperature controlled), CEP (domestic or international courier, express and parcel) and other value-added logistics services involved in the transportation of commodities (raw materials or finished goods including both solids and fluids) from the origin to a destination within the country (domestic) or cross-border (international), through one or more modes of transportation viz. road, rail, sea, air and pipelines constitute freight and logistics market.
- Fuel Price - Fuel price spikes can cause delays and diruption for logistics service providers (LSPs), while drops in the same can result in higher short-term profitability and increased market rivalry to offer consumers with the best deals. Hence, the fuel price variations have been studied over the review period and presented along with the causes as well as market impacts.
- GDP Distribution by Economic Activity - Nominal Gross Domestic Product and distribution of the same, across major economic sectors in the geography studied (country or region as per scope of the report) have been studied and presented in this industry trend. As GDP is positively related to the profitability and growth of logistics industry, this data has been used in adjunction to the input-output tables/ supply-use tables for analyzing the potential major contributing sectors towards the logistics demand.
- GDP Growth by Economic Activity - Growth of Nominal Gross Domestic Product across major economic sectors, for the geography studied (country or region as per scope of the report) have been presented in this industry trend. This data has been utilized for assessing the growth of logistics demand from all the market end users (economic sectors considered here).
- Inflation - Variations in both Wholesale Price Inflation (YoY change in producer price index) and Consumer Price Inflation have been presented in this industry trend. This data has been used to assess the inflationary environment as it plays a vital role in smooth functioning of the supply chain, directly impacting the logistics operational cost components e.g., pricing of tyres, driver wages & benefits, energy/fuel prices, maintenace costs, toll charges, warehousing rents, custom brokerage, forwarding rates, courier rates etc. hence impacting the overall freight and logistics market.
- Infrastructure - As infrastructure plays a vital role in an economy's logistics performance, variables like length of roads, distribution of road length by surface category (paved v/s unpaved), distribution of road length by road classification (expressways v/s highways v/s other roads), rail length, volume of containers handled by major ports and tonnage handled by major airports have been analysed and presented in this industry trend.
- Key Industry Trends - The report section named "Key Industry Trends" include all the key variables/parameters studied to better analyze the market size estimates and forecasts. All the trends have been presented in the form of data points (time series or latest available data points) along with analysis of the paramter in the form of concise market relevant commentary, for the geography studied (country or region as per the scope of report).
- Key Strategic Moves - The action taken by a company to differentiate from its competitor or used as a general strategy is referred to as a key strategic move (KSM). This includes (1) Agreements (2) Expansions (3) Financial Restructuring (4) Mergers and Acquisitions (5) Partnerships, and (6) Product Innovations. Key players (Logistics Service Providers, LSPs) in the market have been shortlisted, their KSM have been studied and presented in this section.
- Liner Shipping Bilateral Connectivity Index - It indicates a country pair's integration level into global liner shipping networks and plays a crucial role in determining bilateral trade, which in turn potentially contributes toward the prosperity of a country and its surrounding region. Hence the major economies connected to the country/ region as per scope of the report, have been analyzed and presented in "Liner Shipping Connectivity" industry trend.
- Liner Shipping Connectivity - This industry trend analyses the state of connectivity to the global shipping networks based on the status of maritime transport sector. It includes the analysis of liner shipping connectivity, bilateral shipping connectivity, and port liner shipping connectivity indices for the geography (country/ region as per scope of the report) over the review period.
- Liner Shipping Connectivity Index - It indicates how well countries are connected to global shipping networks based on the status of their maritime transport sector. It is based on five components of the maritime transport sector: (1) The number of shipping lines servicing a country, (2) The size of the largest vessel used on these services (in TEUs), (3) The number of services connecting a country to the other countries, (4) The total number of vessels deployed in a country, (5) The total capacity of those vessels (in TEUs).
- Logistics Performance - Logistics Performance and Logistics Costs are the backbone of trade, and influences trade costs, making countries compete globally. Logistics performance is influenced by market wide adopted supply chain management strategies, government services, investments & policies, fuel/ energy costs, inflationary environment etc. Hence, in this industry trend, the logistics performance of the geography studied (country/ region as per the scope of report) has been analysed and presented over the review period.
- Major Truck Suppliers - Market share of truck brands is influenced by factors like geographical preferences, portfolio of truck types, truck prices, local production, truck repair & maintenance service peneteration, customer support, technological innovations (like electric vehicles, digitalization, autonomous trucks), fuel efficiency, financing options, annual maintenance costs, availability of substitutes, marketing startegies etc. Hence, the distribution (share % for base year of the study) of truck sales volume for leading truck brands and commentary on current market scenario & market anticipation over the forecast period have been presented in this industry trend.
- Manufacturing - This end user industry segment captures the external (outsourced) logistics expenditure incurred by the Manufacturing industry players. The end user players considered are the establishments primarily engaged in the chemical, mechanical or physical transformation of materials or substances into new products. Logistics Service Providers (LSPs) play a crucial role in maintaining a smooth flow of raw materials across the supply chain, enabling timely delivery of finished goods to distributors or end customers and storing & supplying the raw materials to clients for just-in-time manufacturing.
- Maritime Fleet Load Carrying Capacity - Maritime fleet load carrying capacity depicts the development state of an economy's maritime infrastructure & trade. It is influenced by factors like volume of production, international trade, major end user industries, maritime connectivity, environmental regulations, investments in port infrastructure development, port container cargo handling capacity etc. This industry trend represents the maritime fleet load carrying capacity by type of ship viz. container ships, oil tankers, bulk carriers, general cargo, among other types alongwith the influencing factors for the geography studied (country/ region as per scope of the report), over the review period.
- Modal Share - Freight Modal Share is influenced by factors like modal productivity, government regulations, containerization, distance of shipment, temperature control requirements, type of goods, international trade, terrain, speed of delivery, shipment weight, bulk shipments, etc. Also, modal share by tonnage (tons) and modal share by freight turnover (ton-km) differ as per average distance of shipments, weight of major commodity groups transported in the economy and number of trips. This industry trend represents the distribution of freight transported by mode of transport (tons as well as ton-km), for the study base year.
- Oil and Gas, Mining and Quarrying - This end user industry segment captures the external (outsourced) logistics expenditure incurred by the extraction industry players. The end user players considered are the establishments that extract naturally occurring mineral solids, such as coal and ores; liquid minerals, such as crude petroleum; and gases, such as natural gas. Logistics Service Providers (LSPs) covers entire phases from upstream to downstream and plays a crucial role in the transportation of machinery, drilling equipments, extracted minerals, crude oil & natural gas and refined/ processed products from one place to another.
- Other End Users - Other end user segment captures the external (outsourced) logistics expenditure incurred by the financial services (BFSI), real estate, educational services, healthcare, and professional services (administrative, waste management, legal, architectural, engineering, design, consulting, scientific R&D). Logistics Service Providers (LSPs) plays a crucial role in the reliable movement of supplies and documents to/from these industries such as transporting any equipment or resources required, shipping confidential documents and files, movement of medical goods & supplies (surgical supplies and instruments, including gloves, masks, syringes, equipment) to name a few.
- Other Services - Other Services segment captures revenue earned through (1) Value added services (VAS) for freight transportation by road, rail, air and sea & inland waterways, (2) VAS for marine cargo transportation (operation of terminal facilities such as harbours and piers, operation of waterway locks, navigation, pilotage and berthing activities, lighterage, salvage activities, lighthouse activities, among other miscellaneous support activities), (3) VAS for land freight transportation (operation of terminal facilities such as railway stations, stations for the handling of goods, operation of railroad infrastructure, switching and shunting, towing and road side assistance, liquefaction of gas for transportation purposes, among other miscellaneous support activities), (4) VAS for air cargo transportation (operation of terminal facilities such as airway terminals, airport and air-traffic-control activities, ground service activities on airfields, runway maintenance, inspection/ ferrying/ maintenance/ testing of aircrafts, aircraft fuelling services, among other miscellaneous support activities), (5) VAS for warehousing and storage service (operation of grain silos, general merchandise warehouses, refrigerated warehouses, storage tanks etc., storage of goods in foreign trade zones, blast freezing, crating goods for shipping, packing and preparing goods for shipping, labelling and/or imprinting the package, kit assembling and packaging services, among other miscellaneous support activities), and (6) VAS for courier, express and parcel service (pickup, sorting).
- Port Calls and Performance - The performance of ports is key to an economy's freight movement, trade, global connectivity, successful growth strategies, investment attractiveness for production & distribution systems, and thus affects GDP, employment, per capita income and industrial growth. Hence, the port perfomance parameters like median time spent by vessels in the ports; average age, size, cargo carrying capacity, container carrying capacity, of vessels entering the ports, port calls, and container port throughput have been analysed and presented in this industry trend.
- Port Liner Shipping Connectivity Index - It reflects a port's position in the global liner shipping network, wherein a higher value of index is associated with better connectivity. Efficient and well-connected ports (1) contribute towards minimizing transport costs, linking supply chains and supporting international trade, (2) pave the way for economies of scale and development of expertise by permitting producers to better exploit possibilities in domestic as well as foreign markets. Hence the major ports of strategic importance, in the country/ region as per scope of the report, have been analyzed and presented in "Liner Shipping Connectivity" industry trend.
- Port Throughput - It reflects the amount of cargo or number of vessels a port handles annually. It can be related to (1) cargo tonnage, (2) container TEU, and (3) vessel calls. Port throughput in terms of total containers handled (TEU's), has been presented in the "Port Calls and Performance" industry trend.
- Producer Price Inflation - It indicates inflation from viewpoint of the producers viz. the average selling price received for their output over a period of time. Annual change (YoY) of producer price index is reported as wholesale price inflation in the "Inflation" industry trend. As WPI captures dynamic price movements in most comprehensive way, it is widely used by governments, banks, industry, business circles and is deemed important in formulation of trade, fiscal and other economic policies. The data has been used in adjunction to consumer price inflation for better understanding the inflationary environment.
- Segmental Revenue - Segmental Revenue has been triangulated or computed and presented for all the major players in the market. It refers to the freight and logistics market specific revenue earned by the company, over the base year of study, in the geography studied (country or region as per the scope of report). It is computed through the study and analysis of major parameters like financials, service portfolio, employee strength, fleet size, investments, number of countries present in, major economies of concern, etc. that have been reported by the company in its annual reports, webpage. For companies having scarce financial disclosures, paid databases like D&B Hoovers, Dow Jones Factiva have been resorted to and verified through industry/expert interactions.
- Transport and Storage Sector GDP - Value and growth of Transport and Storage Sector GDP has a direct relation to the freight and logistics market size. Hence, this variable has been studied and presented over the review period, in value terms (USD) and as share % of total GDP, in this industry trend. The data has been supported by concise and relevant commentary around the investments, developments, and current market scenario.
- Trends in E-Commerce Industry - Enhanced internet connectivity and boom in smartphone penetration, coupled with increasing disposable incomes, has led to a phenomenal growth in the e-commerce market globally. Online shoppers require fast and efficient delivery of their orders leading to an increase in the demand for logistics services especially e-commerce fulfilment services. Hence, the Gross Merchandise Value (GMV), historial and projected growth, breakup of major commodity groups in e-commerce industry for the studied geography (country or region as per scope of the report) have been analysed and presented in this industry trend.
- Trends in Manufacturing Industry - Manufacturing industry involves the transformation of raw materials into finished products, while logistics industry ensures the efficient flow of raw materials to the factory, and the transport of manufactured products to the distributors & consumers. Demand-Supply of both industries are highly cross-linked and critical for a seamless supply chain. Hence, the Gross Value Added (GVA), breakup of GVA into major manufacturing sectors, and growth of manufacturing industry over the review period have been analysed and presented, in this industry trend.
- Trucking Fleet Size By Type - Market share of truck types is influenced by factors like geographical preferences, major end user industries, truck prices, local production, truck repair & maintenance service peneteration, customer support, technological disruptions (like electric vehicles, digitalization, autonomous trucks) etc. Hence, the distribution (share % for base year of study) of truck parc volume by type of truck, market disruptors, truck manufacturing investments, truck specifications, truck use & import regulations, and market anticipation over the forecast period have been presented in this industry trend.
- Trucking Operational Costs - The prime reasons for measuring/ benchmarking logistics performance of any trucking company are to reduce operational costs and increase profitability. On the other hand, measuring operational costs helps to identify whether and where to make operational changes to control expenses and identify areas for improved performance. Hence, in this industry trend, trucking operational costs and the variables involved viz. driver wages & benefits, fuel prices, repairs & maintenance costs, tyre costs etc. have been studied over the base year of study, and presented for the geography studied (country or region as per the scope of report).
- Warehousing and Storage - Warehousing and storage segment captures revenue earned through the operation of general merchandise, refrigerated and other types of warehousing & storage facilities. These establishments take responsibility for storing the goods and keeping them secure in lieu of charges. Value added services (VAS) they may provide are considered to be a part of the "other services" segment. Here VAS refer to a range of services, related to the distribution of a customer's goods and can include labelling, breaking bulk, inventory control & management, light assembly, order entry & fulfillment, packaging, pick & pack, price marking & ticketing and transportation arrangement.
- Wholesale and Retail Trade - This end user industry segment captures the external (outsourced) logistics expenditure incurred by the wholesalers and retailers. The end user players considered are the establishments primarily engaged in wholesaling or retailing merchandise, generally without transformation, and rendering services incidental to the sale of merchandise. Logistics Service Providers (LSPs) plays a crucial role in the reliable movement of supplies to and finished products from production houses to the distributors and finally to the end customer covering activites like material sourcing, transportation, order fulfillment, warehousing & storage, demand forecasting, inventory management etc.
| Keyword | Definition |
|---|---|
| Axle Load | The axle load of a wheeled vehicle is the total weight bearing on the roadway for all wheels connected to a given axle. |
| Back Haul | Backhaul is the return movement of a transport vehicle from its original destination to its original point of departure. |
| Bill of Lading | A bill of lading is a legal document issued by a carrier to a shipper that details the type, quantity, and destination of the goods being carried. |
| Bunkering | Bunkering is the process of supplying fuel and/or gasoil to be used to power the propulsion system of a ship (such fuel is referred to as bunker). It includes the logistics of loading and distributing the fuel among available shipboard tanks. A person dealing in trade of bunker (fuel) is called a bunker trader. |
| Bunkering Service | Bunkering service is the supply of a requested quality and quantity of bunkers to a ship. |
| C-commerce | C-commerce (Collaborative commerce) describes electronically enabled business interactions among an enterprise’s internal personnel, business partners and customers throughout a trading community. The trading community could be an industry, industry segment, supply chain or supply chain segment. |
| Cabotage | Transport by a vehicle registered in a country performed on the national territory of another country. |
| Cartage Agent | A ground transportation service that provides pickup and delivery of freight in locations not served directly by an air or ocean carrier. |
| Contract logistics | Contract logistics refers to the outsourcing of resource management tasks by one company to a third-party company specializing in logistical matters, such as transportation, warehousing, and order fulfillment. |
| Courier | A business that is used to send messages, packages, etc. Courier service refers to the fast or quick, door to door pickup and delivery service for goods or documents. It can be local or international. A company that provides such delivery services is called a courier company. A courier company hires people to provide their services. Such a person hired by the courier service company is called a courier. |
| Cross docking | Cross docking is a practice in logistics management that includes unloading incoming delivery vehicles and loading the materials directly into outbound delivery vehicles, omitting traditional warehouse logistical practices and saving time and money. |
| Cross Trade | International transport between two different countries performed by a vehicle registered in a third country. A third country is a country other than the country of loading/embarkation and than the country of unloading/disembarkation. |
| Customs Clearance | The procedures involved in getting cargo released by Customs through designated formalities such as presenting import license/permit, payment of import duties and other required documentations by the nature of the cargo such as FCC or FDA approval. |
| Customs seal | Customs seal means a seal, stamp or any other preventive means affixed by customs officials to ensure the inviolability of goods, commercial means of transport or warehouses. |
| Dangerous Goods | Dangerous goods (or hazardous materials or HAZMAT) include flammable liquids/solids, gases, compressed, liquified, dissolved under pressure, corrosives, oxidising substances, explosive substances and articles, substances, which on contact with water, emit flammable gasses, organic peroxides, toxic substances, infectious substances, radioactive materials, miscellaneous dangerous goods and articles. |
| Direct Shipment | Direct shipment is a method of delivering goods from the supplier or the product owner to the customer directly. In most cases, the customer orders the goods from the product owner. This delivery scheme reduces transportation and storage costs, but requires additional planning and administration. |
| Drayage | A drayage is a form of trucking service that connects the different modes of shipping (intermodal), such as ocean freight or air freight. It’s a short-haul trip that transports goods from one place to another, usually before or after its long-haul shipping process. Drayage trucks move cargo to and from various destinations, such as container ships, storage lots, order fulfillment warehouses, and rail yards. Typically, drayage only transports goods in short distances and operates only in one metropolitan area. It also requires only one trucker in a single shift. |
| Dry Docking | Dry docking is a term used for repairs or when a ship is taken to the service yard. During dry docking, the whole ship is brought to a dry land so that the submerged portions of the hull can be cleaned or inspected. |
| Dry van | A dry van is a type of semi-trailer that's fully enclosed to protect shipments from outside elements. Designed to carry palletized, boxed or loose freight, dry vans aren't temperature-controlled (unlike refrigerated “reefer” units) and can't carry oversized shipments (unlike flatbed trailers). |
| Feedering | Transport service whereby loaded or empty containers in a regional are transferred to a “mother ship” for a long-haul ocean voyage. |
| Final Demand | Final demand includes all types of commodities (goods as well as services) consumed as final use and might include personal consumption, or consumption by government, by businesses as capital investment, and as exports. includes all types of commodities (goods as well as services) consumed as final use and might include personal consumption, or consumption by government, by businesses as capital investment, and as exports. |
| First mile Delivery | First mile delivery refers to the first stage of the transportation. This is when the parcel leaves the seller’s warehouse and is taken by the courier pick up agent to process it or take it to the warehouse. Once the package reaches the post office or the courier’s hub, it is then sorted and transported further until it reaches the customer’s doorstep. |
| Fiscal storage services | It means a facility, clearly separated from other premises, where the excise goods are produced, processed, held, received or dispatched under a duty suspension arrangement by an authorized depositor, in the course of his business, under conditions laid down by the customs authorities. |
| Flat Bed | It has a back body that is flatly shaped for easy loading and unloading of goods. The flatbed truck is mostly used to transport heavy, oversized, wide and indelicate goods. |
| Flatbed Truck | A flatbed truck is a type of truck with rigid design. It has a back body that is flatly shaped for easy loading and unloading of goods. The flatbed truck is mostly used to transport heavy, oversized, wide and indelicate goods such as machinery, building supplies or equipment. Due to the truck open body, the goods transported with it must not be vulnerable to rain. By functionality, the flatbed truck is comparable to a flatbed trailer. |
| Freight Transit Time | Transit time is how long it takes for a shipment to be delivered to its final destination after being picked up from a designated pick up point. |
| Halal Logistics | It refers to the process of managing the logistics operations such as fleet management, storage/warehousing, and materials handling according to the principles of Shariah law in ensuring the integrity of the halal products at the point of consumption. |
| Haulage | The commercial transport of goods. |
| Inbound Logistics | Inbound logistics is the way materials and other goods are brought into a company. This process includes the steps to order, receive, store, transport and manage incoming supplies. Inbound logistics focuses on the supply part of the supply-demand equation. |
| Intermediate Demand | Intermediate demand includes goods, services, and maintenance and repair construction sold to businesses, excluding capital investment. |
| International Loaded | Place of loading of goods in reporting country (i.e., country in which the vehicle performing the transport is registered) and place of unloading in a different country. |
| International Unloaded | Place of unloading of goods in reporting country (i.e., country in which the vehicle performing the transport is registered) and place of loading in a different country. |
| Last Mile Delivery | Last mile delivery refers to the very last step of the delivery process when a parcel is moved from a transportation hub to its final destination—which, usually, is a personal residence or retail store. |
| Less than-Truck-Load (LTL) | Less-than-truckload, also known as less-than-load (LTL), is a shipping service for relatively small loads or quantities of freight. An LTL provider combines the loads and shipping requirements of several different companies on their trucks, using a hub-and-spoke system to get goods to their destinations. |
| Locomotives Haluage | The transport of coal, ore, workers, and materials underground by means of locomotive-hauled mine cars. The locomotive may be powered by battery, diesel, compressed air, trolley, or some combination such as battery-trolley or trolley-cable reel. |
| Milkrun | A Milk Run is a delivery method used to transport mixed loads from various suppliers to one customer. Instead of each supplier sending a truck every week to meet the needs of one customer, one truck (or vehicle) visits the suppliers to pick up the loads for that customer. This method of transport got its name from the dairy industry practice, where one tanker used to collect milk from several dairy farms for delivery to a milk processing company. |
| Multi country consolidation | Multi-Country Consolidation (MCC) is a cost-effective solution that consolidates ones cargo from different countries of origin to build Full Container Loads (FCL). MCC is most suitable for companies that import light volumes of goods from multiple countries but want to take advantage of the more economic FCL freight rates. |
| Multi-Modal Logistics | Multimodal transportation or multimodal shipping refers to logistics and freight processes that require multiple modes of transportation. |
| Omni Channel Logistics | Omnichannel distribution is a multichannel approach taken by companies to give customers a way to purchase and receive orders from several sales channels with one-touch seamless integration. Some of the ways include- 1. Buy online, then pick-up at the brick and mortar store; 2. Buy online, then have it delivered to the home or another location; 3.In store purchase, with the delivery either to the home or another location; 4. Drop ship from a warehouse or manufacturing center to store, home or other location; 5.Buy online, then return at store or online; 6. Buy online, then return online. |
| OOG cargo | Out of Gauge (OOG) cargo is any cargo that can not be loaded into six-sided shipping containers simply because it is too large. The term is a very loose classification of all cargo with dimensions beyond the maximum 40HC container dimensions. That is a length beyond 12.05 meters – a width beyond 2.33 meters – or a height beyond 2.59 meters. |
| Other ships | Other ships include: Liquefied petroleum gas carriers, liquefied natural gas carriers, parcel (chemical) tankers, specialized tankers, reefers, offshore supply vessels, tugboats, dredgers, cruise, ferries, other non-cargo ships |
| Other Specialised Cargo | Other specialised goods include pre-slung goods (Goods, one or more items, supplied with a sling or slings), mobile units (Mobile Self Propelled Units, Non Self Propelled Units, unrolled vehicles), oversized equipment load (light and heavy machinery that is often too big or too heavy), high value freight that needs extra protection like electronics, financial services road freight. |
| Outsourced Freight Transport | Transport for hire or reward; The carriage for remuneration of goods. |
| Pallets | Raised platform, intended to facilitate the lifting and stacking of goods. |
| Part load | A part load describes goods which only fills a truck partially. In essence, the quantity of the shipment is bigger than the Less Than Truckload (LTL) shipment. Also, the shipment cannot fully occupy a truck i.e. its capacity is much lower than a Full Truckload (FTL) shipment. |
| Paved Road | Road surfaced with crushed stone (macadam) with hydrocarbon binder or bituminized agents, with concrete or with cobblestone. |
| Q-commerce | Q-commerce, also referred to as quick commerce, is a type of e-commerce where emphasis is on quick deliveries, typically in less than an hour. |
| Quay | A stone or metal platform lying alongside or projecting into water for loading and unloading ships. |
| Recommerce | Recommerce is the selling of previously owned items through online marketplaces to buyers who reuse, recycle or resell them. |
| ReverseLogistics | Reverse logistics is a type of supply chain management that moves goods from customers back to the sellers or manufacturers. |
| Road Freight Transport Service | Hiring a trucking agency for transport of commodities (raw materials or manufactured goods including both solids and liquids) form the origin to a destination within the country (domestic) or cross-border (international) constitutes road freight transport market. The service might be Full-Truck-Load or Less than-Truck-Load, containerized or non-containerized, temperature controlled or non temperature controlled, short haul or long haul. |
| Roll-on/roll-off cargo | Roll-on/roll-off (RORO or ro-ro) ships are cargo ships designed to carry wheeled cargo, such as cars, motorcycles, trucks, semi-trailer trucks, buses, trailers, and railroad cars, that are driven on and off the ship on their own wheels or using a platform vehicle, such as a self-propelled modular transporter. |
| Swap bodies | A swap body, swop body, exchangeable container or interchangeable unit, is one of the types of standard freight containers for road and rail transport. |
| Tank Barge | A non-self-propelled vessel constructed or adapted primarily to carry liquid, solid or gaseous commodities or cargos in bulk in cargo spaces (or tanks) through rivers and inland waterways, and may occasionally carry commodities or cargos through oceans and seas when in transit from one inland waterway to another. The commodities or cargos transported are in direct contact with the tank interior. |
| Tautliner vehicle | Tautliner and curtainsider are used as generic names for curtain sided trucks/trailers. The curtains are permanently fixed to a runner at the top and detachable rails/poles at front and rear, allowing the curtains to be drawn open and forklifts used all along the sides for easy and efficient loading and unloading. When closed for travel, vertical load restraint straps are attached to a rope rail beneath the truck bed, connecting the truck bed and curtain along both sides. Winches at either end of the curtain tension it, hence the 'Tautliner' name. This stops the curtain from flapping or drumming in the wind and can also help retain light loads from slipping sideways. |
| Transloading | Transloading is a shipping term that refers to the transfer of goods from one mode of transportation to another en route to their ultimate destination. |
| Tsubo | A Japanese unit of area equal to 35.58 square feet. |
| Unpaved Road | Road with a stabilized base not surfaced with crushed stone, hydrocarbon binder or bituminized agents, concrete or cobblestone. |
| Vessel Husbandry Services | It includes ship maintenance, repairs, cleaning, upkeep of the hull and rigging and equipment. |
Need More Details on Market Definition?
Ask a Question
Research Methodology
Mordor Intelligence follows a four-step methodology in all our reports.
- Step-1: Identify Key Variables: In order to build a robust forecasting methodology, the variables and factors identified in Step-1 are tested against available historical market numbers. Through an iterative process, the variables required for market forecast are set and the model is built on the basis of these variables.
- Step-2: Build a Market Model: Market-size estimations for the forecast years are in nominal terms. Inflation is not a part of the pricing, and the average selling price (ASP) is kept constant throughout the forecast period for each country.
- Step-3: Validate and Finalize: In this important step, all market numbers, variables and analyst calls are validated through an extensive network of primary research experts from the market studied. The respondents are selected across levels and functions to generate a holistic picture of the market studied.
- Step-4: Research Outputs: Syndicated Reports, Custom Consulting Assignments, Databases & Subscription Platforms

Get More Details On Research Methodology
Download PDF


