United States Freight Brokerage Market Size and Share
Market Overview
| Study Period | 2020 - 2031 |
|---|---|
| Forecast Data Period | 2026 - 2031 |
| Historical Data Period | 2020 - 2024 |
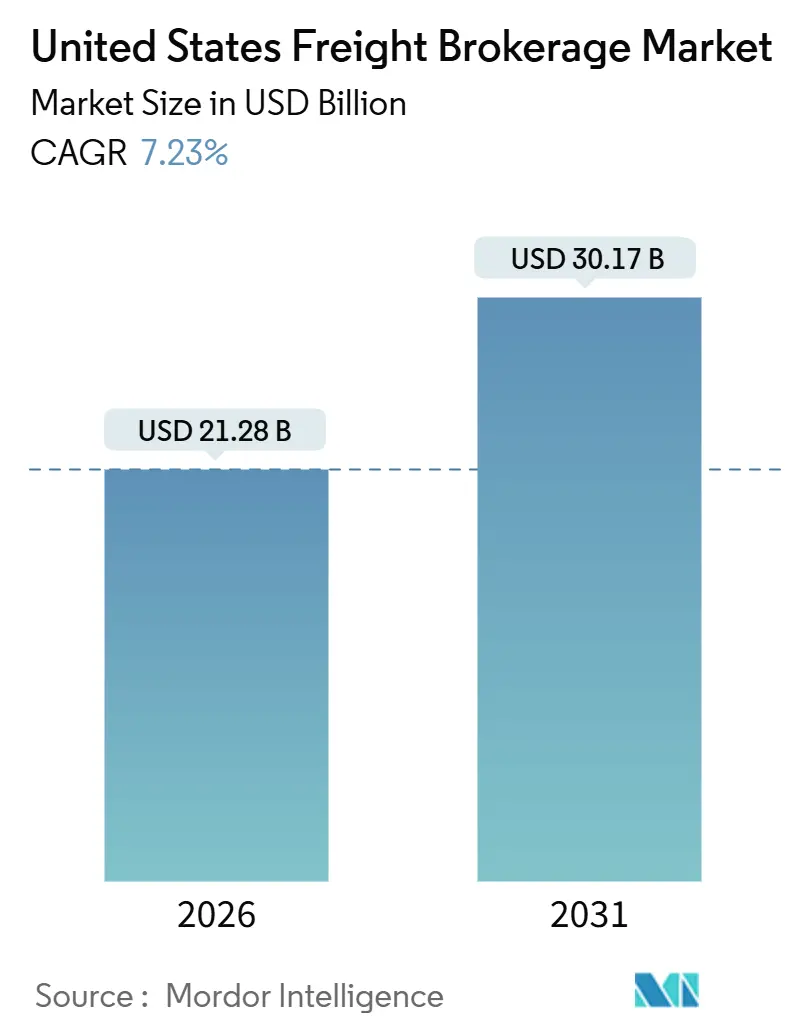
| Market Size (2026) | USD 21.28 Billion |
| Market Size (2031) | USD 30.17 Billion |
| Growth Rate (2026 - 2031) | 7.23% CAGR |
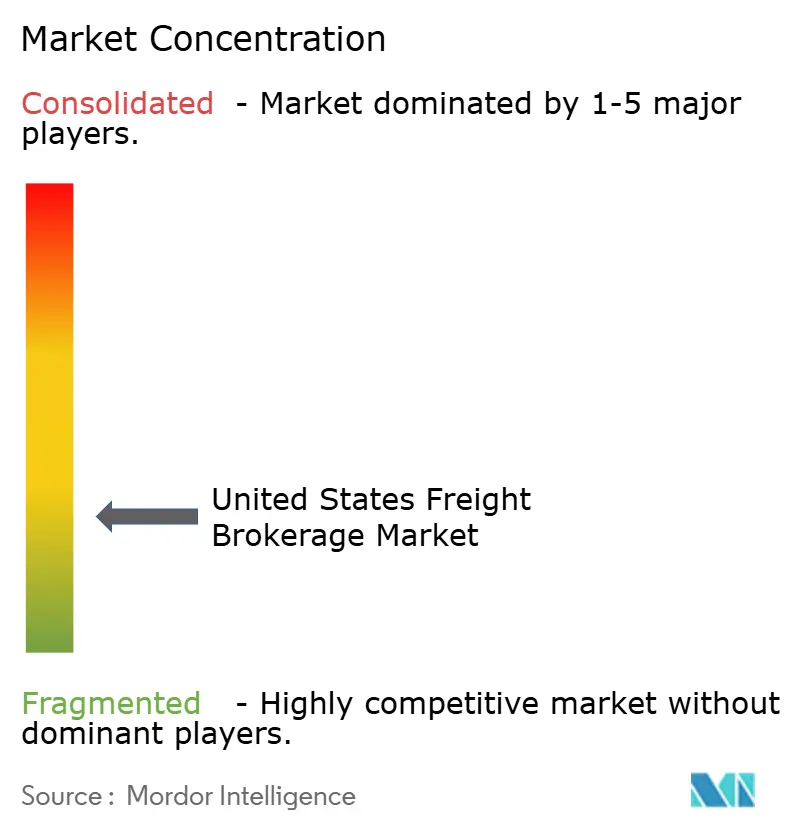
| Market Concentration | Low |
Major Players *Disclaimer: Major Players sorted in no particular order Image © Mordor Intelligence. Reuse requires attribution under CC BY 4.0. | |
United States Freight Brokerage Market Analysis by Mordor Intelligence
The United States freight brokerage market size is estimated at USD 21.28 billion in 2026, and is expected to reach USD 30.17 billion by 2031, at a CAGR of 7.23% during the forecast period (2026-2031). E-commerce retailers, 3PL fulfillment specialists, and nearshoring manufacturers are reshaping network design, accelerating demand for brokers able to deliver sub-24-hour coverage through real-time carrier connectivity. Southwest cross-border volumes have overtaken many West Coast imports, channeling freight toward Texas, Arizona, and New Mexico border crossings. Large shippers are consolidating procurement through a smaller group of tech-enabled partners that embed carbon-tracking APIs directly into transportation-management systems. Amid persistent spot-rate swings, brokers with data-science engines that blend contract and spot capacity outperform fixed-fleet carriers. Regulatory headwinds, notably California’s AB5 contractor test and potential federal speed limiters, increase compliance costs in ways that reward scaled platforms with robust legal and telematics resources.
Key Report Takeaways
- By service, full-truckload captured 63.63% of 2025 revenue, while less-than-truckload is advancing at an 8.79% CAGR between 2026-2031.
- By equipment, dry van held 44.57% of the United States freight brokerage market share in 2025; refrigerated van capacity is forecast to expand at a 9.89% CAGR between 2026-2031.
- By haul length, long-haul moves represented 53.05% of the 2025 value; regional lanes are projected to grow at an 8.14% CAGR between 2026-2031.
- By business model, traditional brokerage retained a 54.20% share in 2025; digital freight brokerage is projected to post a 16.75% CAGR between 2026-2031.
- By end user, retail, FMCG, and wholesale distribution represented 29.54% of 2025 demand; E-commerce and 3PL fulfillment are expected to grow at a 13.27% CAGR between 2026-2031.
- By customer size, large enterprise shippers accounted for 56.20% of the United States freight brokerage market size in 2025; small businesses are forecast to rise at a 10.19% CAGR between 2026-2031.
- By geography, the Midwest commanded 26.55% of 2025 revenue, while the Southwest region is projected to advance at a 7.94% CAGR between 2026-2031.
Note: Market size and forecast figures in this report are generated using Mordor Intelligence’s proprietary estimation framework, updated with the latest available data and insights as of January 2026.
United States Freight Brokerage Market Trends and Insights
Drivers Impact Analysis
| Driver | (~) % Impact on CAGR Forecast | Geographic Relevance | Impact Timeline |
|---|---|---|---|
| E-commerce volume surge and next-day delivery expectations | +1.8% | National, with highest intensity in West, Southeast urban corridors | Short term (≤ 2 years) |
| Highly fragmented carrier base boosts broker relevance | +1.2% | National, particularly acute in Midwest, Southeast industrial lanes | Medium term (2-4 years) |
| Rapid digitisation of TMS / API integrations | +1.5% | National, early adoption by large enterprises in Northeast, West | Medium term (2-4 years) |
| Shipper demand for carbon-footprint-optimised routing | +0.6% | National, led by California, Northeast ESG mandates | Long term (≥ 4 years) |
| PE-backed shipper consolidation outsourcing to brokers | +0.8% | National, concentrated in Midwest manufacturing, Southeast distribution | Medium term (2-4 years) |
| Nearshoring and US-Mexico cross-border expansion | +1.4% | Southwest border states (Texas, Arizona, New Mexico), spill-over to Midwest | Short term (≤ 2 years) |
| Source: Mordor Intelligence | |||
E-Commerce Volume Surge and Next-Day Delivery Expectations
United States e-commerce sales exceeded USD 1.1 trillion in 2024, and fulfillment centers now sit within 50 miles of 90% of the population. These dense networks compress delivery windows to a single day, prompting shippers to engage brokers that aggregate regional carriers and can guarantee capacity in real time. Amazon added 1,000 last-mile delivery stations, spawning short shuttle runs that brokers match against backhaul capacity. Traditional retailers such as Walmart accelerated last-mile technology adoption, broadening demand for brokers able to orchestrate multi-leg, time-sensitive flows. Order cycles have shifted from weekly to daily replenishment, requiring live truck-location data and mobile integrations rather than phone-based dispatch. Platforms delivering rate quotes in under 30 seconds continue to win bids in this fast-turn environment[1]“Quarterly E-Commerce Report,” U.S. Census Bureau, census.gov .
Highly Fragmented Carrier Base Increases Broker Relevance
More than 1.2 million active motor carriers operate in the United States, and 97% run fleets smaller than 20 trucks. The long tail of micro-fleets lacks the balance sheets and back-office systems to bid on enterprise freight, creating an information asymmetry that brokers monetize through load aggregation and faster payment cycles. Driver turnover at small carriers exceeded 90% in 2024, and many owner-operators rely on brokers for fuel advances and same-day pay. This fragmentation protects shippers from single-carrier failure because brokers can reroute cargo within hours. It also shields brokers from default risk and stabilizes service levels despite frequent carrier exits[2]“Freight Analysis Framework,” U.S. Department of Transportation, transportation.gov.
Rapid Digitization of TMS And API Integrations
API-enabled transportation-management systems penetrated 62% of Fortune 500 shippers by 2025, up from 35% two years earlier. C.H. Robinson’s Navisphere processed more than 20 million API transactions in 2024, cutting tender-acceptance times from hours to minutes and reducing procurement costs by as much as 12%. Brokers now embed live truck tracking, delivery ETA, and emissions metrics directly into shipper dashboards. J.B. Hunt’s 360box platform reported 45% year-over-year growth in API-connected shippers, citing automated exception management as a leading driver. Machine-learning engines capable of instant rate generation have become table stakes for brokers pursuing high-velocity retail and e-commerce cargo.
Shipper Demand for Carbon-Optimized Routing
Proposed Securities and Exchange Commission rules will obligate public companies to disclose Scope 3 emissions, pushing logistics teams to quantify transport-related CO₂. Brokers that couple EPA SmartWay data with carrier performance history allow shippers to select routes based on grams of CO₂ per ton-mile. Walmart has pledged net-zero logistics emissions by 2040, incentivizing brokers to model electric trucks and intermodal rail in standard quotes. Convoy reports a 15% reduction in empty miles after automating backhaul matching, translating into measurable carbon savings that appear in shipper sustainability reports. These capabilities require data-science talent and robust telematics, creating a high barrier for analog brokers.
Restraints Impact Analysis
| Restraint | (~) % Impact on CAGR Forecast | Geographic Relevance | Impact Timeline |
|---|---|---|---|
| Spot-rate volatility compressing brokerage margins | -0.9% | National, most acute in West coast import lanes, Southeast consumer corridors | Short term (≤ 2 years) |
| Driver shortage and capacity unpredictability | -1.1% | National, severe in Midwest long-haul, Southwest cross-border lanes | Medium term (2-4 years) |
| Compliance costs from AB5, speed-limiter proposals | -0.5% | California (AB5), potential federal expansion; speed limiters national if enacted | Medium term (2-4 years) |
| Shipper direct contracting via digital load boards | -0.7% | National, highest adoption among large enterprises in Northeast, West | Short term (≤ 2 years) |
| Source: Mordor Intelligence | |||
Spot-Rate Volatility Compresses Brokerage Margins
Dry-van spot rates fluctuated between USD 1.45 and USD 2.10 per mile during 2024, a 45% swing that quickly erodes broker margins when contract pricing lags by several months. As shippers resist mid-cycle rate resets, brokers either absorb losses or exit unprofitable lanes, as evidenced by a 280-basis-point margin decline reported by C.H. Robinson in Q2 2024. Echo Global Logistics responded with dynamic pricing that re-quotes monthly, lowering margin volatility but creating forecasting challenges for procurement teams. Asset-heavy brokers can cushion swings with their own equipment, but pure intermediaries remain fully exposed[3]“Carrier Registration Statistics,” Federal Motor Carrier Safety Administration, fmcsa.dot.gov.
Driver Shortage and Capacity Unpredictability
The industry faced an 80,000-driver deficit in 2024, and projections show the gap doubling by 2031 without significant new entrants. Peak-season freight frequently goes untendered because brokers cannot secure power at contract rates, forcing expensive spot buys or service failures. Average driver age has climbed to 49 years, and younger cohorts cite lifestyle concerns for avoiding over-the-road work, shrinking the long-haul labor pool. Autonomous-truck pilots offer a distant remedy, but regulatory approval remains years away. Until then, carriers leverage scarcity to demand higher rates, tightening broker spreads[4]“Driver Shortage Update 2025,” American Trucking Associations, trucking.org.
Segment Analysis
By Service: LTL Expansion Tracks Order Fragmentation
Full-Truckload occupied 63.63% of the United States freight brokerage market in 2025, reflecting its primacy in high-volume automotive and retail shipments. Yet Less-than-Truckload is set to grow at an 8.79% CAGR between 2026-2031 as retailers split loads into smaller, daily shipments to cut inventory carrying costs. The United States freight brokerage market size for LTL is projected to expand steadily as brokers integrate multi-stop routing algorithms and consolidate partial loads across shippers. FedEx Freight recorded 12% LTL volume growth in Q3 2024, highlighting how fragmented demand favors brokers who can orchestrate dock schedules efficiently. FTL brokers, meanwhile, rely on digital boards to match backhauls and curb empty miles. Yellow Corporation’s exit removed 12% of national LTL capacity, pushing brokers to pay premium rates but also opening a service gap that tech-savvy intermediaries have begun to fill.
LTL growth is also propelled by regional distribution strategies that position stock closer to consumers. Brokers offering hybrid FTL–LTL consolidation services capture incremental margin on both sides of the transaction. Damage-claim risk is higher on multi-stop moves, so brokers with automated claims handling and enhanced cargo insurance policies gain competitive traction. FTL remains indispensable for long-haul replenishment but is maturing, whereas LTL offers outsized upside as e-commerce order sizes shrink.
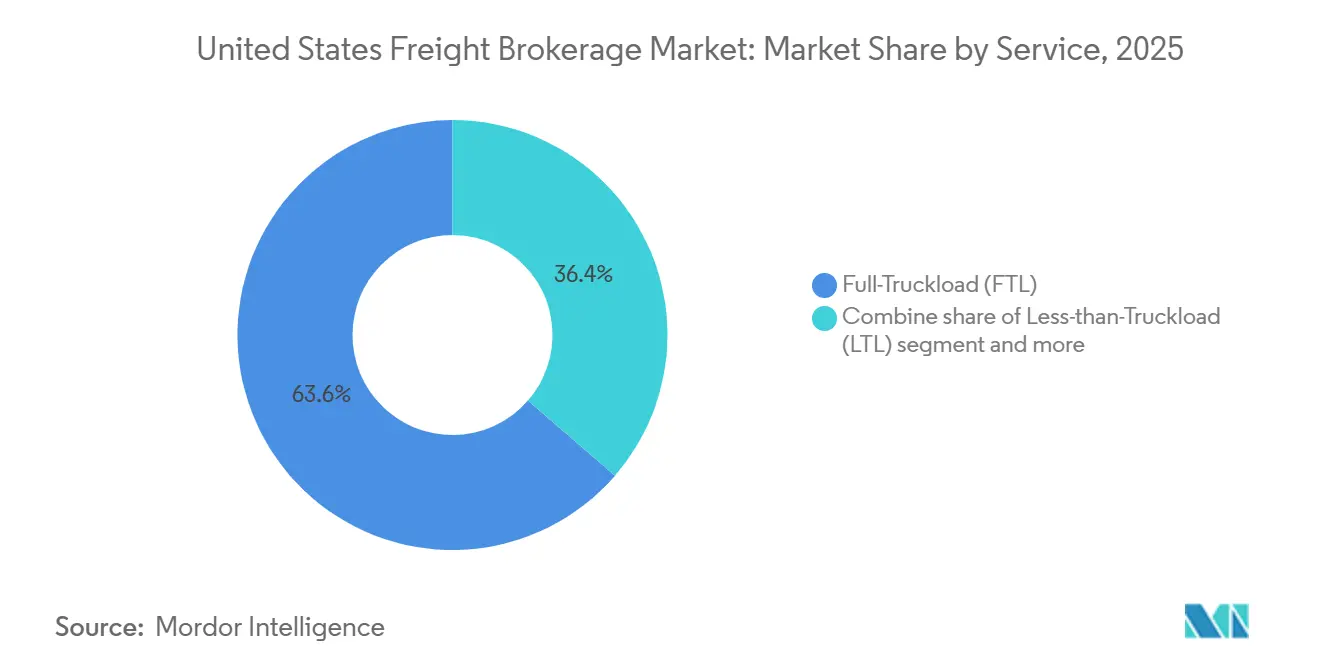
Note: Segment shares of all individual segments available upon report purchase
By Equipment/Trailer Type: Reefer Capacity Tightens
Dry Van accounted for 44.57% of 2025 equipment revenue, but Refrigerated Van tonnage is projected to outpace all other trailer types at a 9.89% CAGR between 2026-2031. Pharmaceutical Good Distribution Practice rules and grocery e-commerce growth require continuous temperature control and sensor-based monitoring, services that command 20-30% rate premiums. The United States freight brokerage market size for reefer freight is therefore rising faster than underlying volume as brokers pass through compliance-related surcharges. Flatbed and step-deck equipment enjoy steady demand from infrastructure projects funded under the USD 110 billion roads-and-bridges program. Tanker trailers retain a niche around chemicals and bulk liquids but face stricter EPA oversight, limiting brokerage participation.
Dry Van utilization slipped to 92% in 2024 as capacity outstripped demand, suppressing margins. Conversely, the reefer fleet grew only 2% annually versus 6-8% demand, tightening supply. Brokers that invest in temperature-tracking telematics differentiate themselves and can mitigate spoilage risk, especially in high-value pharmaceutical lanes. Specialized trailers - car carriers, livestock haulers, pneumatic tanks - remain small but profitable sectors where deep carrier relationships provide defensible earnings.
By Haul Length: Regional Freight Surges on Nearshoring
Long-Haul shipments exceeding 500 miles comprised 53.05% of the 2025 value, yet Regional hauls between 100 and 500 miles will expand at an 8.14% CAGR (2026-2031) as nearshoring compresses supply chains. Mexico-origin automotive parts travel roughly 300-500 miles to United States assembly plants, a distance ideally suited for regional carriers. Brokers fluent in bilingual dispatch and customs procedures secure premium rates on these shuttles. The United States freight brokerage market for local hauls under 100 miles grows in tandem with urban last-mile demand, but higher per-load handling costs temper profit potential.
Driver lifestyle preferences also favor regional work that allows nightly home time, pulling capacity out of long-haul pools, and increasing broker reliance on rail intermodal for distances beyond 750 miles. Intermodal can cut shipper cost by up to 20% but extends transit by one to two days, forcing brokers to balance savings against service levels. Local freight growth remains constrained by metropolitan congestion and limited dock availability, requiring sophisticated route-optimization tools.
By Business Model: Digital Platforms Accelerate Share Gains
Traditional brokers retained 54.20% of 2025 revenue, but Digital Freight Brokerage is projected to post a 16.75% CAGR between 2026-2031, more than double the broader United States freight brokerage market trend. API-first platforms reduce manual labor, letting them underprice analog competitors by 200–300 basis points while preserving margin. Asset-based hybrid brokers benefit from captive fleets during capacity crunches but incur higher fixed costs in downturns. Agent-model operators remain relevant in niche lanes, though many agents now demand technology parity and higher commission splits.
Incumbents have responded with acquisitions and platform rollouts: Navisphere, 360box, and similar tools together processed more than 50 million digital transactions in 2024, demonstrating that scale players can close the technology gap. Yet operating-cost differentials persist, and venture-backed digital entrants continue to claim high-velocity retail and spot loads. Asset-light brokers backed by private equity invest heavily in AI-driven pricing to defend gross profit per load.
By End-User Industry: E-Commerce Races Ahead
Retail, FMCG, and wholesale distribution produced 29.54% of 2025 demand, but e-commerce and fulfillment centers are on pace for a 13.27% CAGR (2026-2031) far higher than brick-and-mortar channels as Amazon and Walmart push next-day delivery into mid-tier cities. Returns logistics amplify freight intensity: e-commerce return rates average 25%, doubling transport cycles. Manufacturing and automotive shipments remain solid owing to nearshoring of vehicle and electronics production, while infrastructure spending fuels flatbed demand in construction. Healthcare and pharmaceuticals are small in volume yet carry outsized margins due to GDP and temperature requirements. Oil, gas, and chemicals traffic faces heightened EPA compliance costs but still delivers steady, contract-heavy freight.
Brokers serving e-commerce shuttle networks must optimize load sequencing for rapid fulfillment and returns consolidation. Retailers are destocking to free working capital, which suppresses traditional replenishment but enlarges drop-and-hook programs that favor agile brokerage models. Manufacturing clients increasingly request bilingual support and customs expertise for U.S.–Mexico corridors, elevating service complexity and pricing power.

Note: Segment shares of all individual segments available upon report purchase
By Customer Size: Digitalization Opens the Door for Small Businesses
Large enterprises captured 56.20% of 2025 brokerage spend, yet Small Businesses under USD 10 million revenue are forecast to rise at 10.19% CAGR (2026-2031) as self-service portals eliminate booking minimums. Two-thirds of small firms used digital freight tools in 2024, up from 42% in 2022, seeking transparent pricing and instant carrier vetting. Mid-market shippers weigh the cost of internal transportation teams versus broker fees; many adopt hybrid models that rely on brokers for overflow or specialized lanes. Brokers mitigate small-business credit risk by requiring prepayment or offering insurance-backed terms, improving access while protecting working capital.
Large enterprises demand API connectivity, emissions reporting, and dedicated account teams. Digital platforms have begun meeting these needs, threatening traditional brokers’ historic advantage in service depth. To defend share, incumbents offer tiered solutions: self-service for small shippers, semi-dedicated support for mid-market, and high-touch integration for Fortune 500 clients.
Geography Analysis
The Midwest controlled 26.55% of 2025 revenue, anchored by automotive, food processing, and diversified industrial production. Chicago handles more than half of U.S. intermodal rail traffic, and brokers orchestrate drayage and cross-dock moves to manage congestion. However, the Southwest is projected to post the fastest regional CAGR at 7.94% between 2026-2031, powered by surging cross-border volumes at Laredo and El Paso and by relocated manufacturing in Texas and Arizona. Brokers with bilingual personnel and customs brokerage licenses capture high-margin northbound loads that require tight compliance.
The Southeast benefits from distribution-center clusters in Atlanta, Charlotte, and Memphis. Savannah and Charleston ports invested USD 5 billion in terminal capacity by 2025, driving dray demand that brokers fulfill with local and regional carriers. Infrastructure Act funding steers additional flatbed volume into the region, while population migration supports sustained consumption freight.
The West faces slower growth as congestion and labor disputes at Los Angeles–Long Beach diverted cargo to Gulf and East Coast gateways, shrinking 2024 West Coast volumes by nearly 10%. AB5 tightened available owner-operator capacity in California lanes, forcing brokers to source trucks from neighboring states at premium rates. The Northeast maintains steady share thanks to dense population centers and last-mile parcel flows, although urban congestion drives higher per-mile rates and driver scarcity.
Competitive Landscape
Roughly 25 leading brokers account for about 40% of total revenue, leaving thousands of small and mid-tier firms to compete on relationships, specialization, or geography. Digital entrants wield machine-learning price engines, self-service portals, and automated carrier payments that trim overhead, enabling them to underprice analog competitors while keeping margins intact. Incumbents are countering through technology acquisitions, internal platform upgrades, and expanded managed-services bundles.
C.H. Robinson secured multiple AI patents in 2024 aimed at predictive load-matching. J.B. Hunt’s 360box integrated rail, dray, and truck capacity into a unified bid environment, driving 20% modal conversion for key customers. Private-equity capital exceeding USD 10 billion has flowed into broker roll-ups over the past two years, funding rapid systems modernization and heightening the bar for independent operators. Regulatory complexity - AB5, speed-limiter proposals, and looming emissions disclosures - further accelerates consolidation because smaller brokers lack the compliance bandwidth.
White-space opportunities remain in cold chain, hazardous materials, and oversized project cargo, where technical requirements shield margins. Autonomous-truck networks represent a potential medium-term disruptor, but pilot programs remain limited and have yet to dent broker relevance.
United States Freight Brokerage Industry Leaders
Total Quality Logistics (TQL)
Echo Global Logistics
C.H. Robinson
United Parcel Service of America, Inc. (UPS)
XPO, Inc.
- *Disclaimer: Major Players sorted in no particular order
Recent Industry Developments
- December 2025: XPO expanded its North American LTL network with five new terminals, raising capacity for 25% more parcel-integrated shipments.
- November 2025: Uber Freight signed a multi-year Amazon Logistics overflow agreement, handling over 1 million parcels monthly via API integration.
- October 2025: C.H. Robinson unveiled Navisphere Carrier 2.0, matching more than 500,000 weekly loads with vetted capacity for faster last-mile hand-offs.
- September 2025: J.B. Hunt 360º and UPS partnered on intermodal parcel services, reducing long-haul delivery cost by 20% on bulk e-commerce lanes.
Research Methodology Framework and Report Scope
Market Definitions and Key Coverage
Our study defines the United States freight brokerage market as the gross revenue earned by licensed intermediaries that arrange domestic or cross-border surface freight moves for shippers, negotiate rates, and tender loads to for-hire motor carriers while holding neither the freight nor the rolling stock in their own name. According to Mordor Intelligence, the definition covers stand-alone traditional, asset-light, and digital brokerage operations across full-truckload, less-than-truckload, and other specialized truck services.
Scope Exclusions: Pure freight forwarding, asset-based trucking revenue, parcel integrators, customs brokerage only services, and maritime or air forwarders are left outside this market boundary.
Segmentation Overview
- By Service
- Full-Truckload (FTL)
- Less-than-Truckload (LTL)
- Others
- By Equipment / Trailer Type
- Dry Van
- Refrigerated Van
- Flatbed / Step-Deck
- Tanker (Bulk Liquid and Chemical)
- Others
- By Haul Length
- Long-Haul (More than 500 miles)
- Regional (100-500 miles)
- Local (Lesser than 100 miles)
- By Business Model
- Traditional Freight Brokerage
- Asset-Based Freight Brokerage
- Agent Model Freight Brokerage
- Digital Freight Brokerage
- By End-User Industry
- Manufacturing and Automotive
- Construction and Infrastructure Projects
- Oil, Gas, Mining and Chemicals
- Agriculture and Food / Beverage
- Retail, FMCG and Wholesale Distribution
- Healthcare and Pharmaceuticals
- E-commerce and 3PL Fulfilment
- Other End-User Industry
- By Customer Size
- Large Enterprise Shippers (Greater than USD 100 M)
- Mid-Market Shippers (USD 10-100 M)
- Small Businesses (Lesser than USD 10 M)
- By Geography
- Northeast
- Midwest
- Southeast
- Southwest
- West
Detailed Research Methodology and Data Validation
Primary Research
Telephone interviews and online surveys with shipper logistics managers, carrier sales directors, and independent freight agents across all five U.S. regions helped us validate average load volumes, broker margin ranges, digital adoption rates, and service-mix shifts that are scarcely published, thereby tightening our model's assumptions around revenue pools and price realizations.
Desk Research
We first assembled a foundational view using open data from tier-one sources such as the U.S. Department of Transportation Freight Analysis Framework, Federal Motor Carrier Safety Administration carrier counts, Bureau of Transportation Statistics ton-mile series, the Commodity Flow Survey, and annual State of Logistics reports. Macroeconomic anchors, including the industrial production index, retail sales, and diesel price trends, came from the Federal Reserve and the U.S. Energy Information Administration. Company filings mined through D&B Hoovers and news archives on Dow Jones Factiva supplemented market share and rate movement clues. This illustrative list is not exhaustive; many additional public and subscription sources informed interim checks and clarifications.
Market-Sizing & Forecasting
A top-down reconstruction began with 2024 domestic trucking spend, filtered by the historical brokerage penetration rate derived from shipper interviews, and then benchmarked against FMCSA broker license counts. Select bottom-up roll-ups, including sampled large-broker gross revenue and average commission multiplied by active agent counts, served as a reasonableness check. Key variables feeding the forecast include truckload spot-to-contract rate differentials, e-commerce retail sales, carrier capacity exits, diesel price expectations, regulation-driven digital load-board uptake, and near-shoring freight corridor growth. A multivariate regression linked these drivers to brokerage penetration, while an ARIMA overlay smoothed cyclical rate swings. Data gaps in agent model revenue were bridged with weighted averages from margin disclosures shared confidentially during interviews.
Data Validation & Update Cycle
Model outputs pass three layers of analyst review: variance tests versus ATA tonnage, anomaly scans against quarterly public earnings, and peer corroboration inside Mordor's freight team. We refresh every twelve months and trigger interim revisions when fuel or spot rates deviate by more than ten percent. A final sign-off occurs immediately before publication.
Why Our United States Freight Brokerage Baseline Commands Reliability
Published estimates often differ because each firm selects unique service scopes, revenue measures, or refresh cadences.
Key gap drivers include (1) whether gross or net commission is counted, (2) inclusion of forwarding or parcel activity, (3) differing views on digital broker ramp-up speed, and (4) model refresh timing that may miss rapid spot-rate moves.
Benchmark comparison
| Market Size | Anonymized source | Primary gap driver |
|---|---|---|
| USD 19.68 B (2025) | Mordor Intelligence | - |
| USD 3.53 B (2024) | Regional Consultancy A | Uses net revenue only; omits LTL brokerage |
| USD 12.67 B (2024) | Industry Association B | Excludes digital-only platforms and cross-border loads |
| USD 164.3 B (2025) | Global Consultancy C | Broad NAICS scope adds forwarding, customs, and warehousing |
The comparison shows how Mordor's disciplined service boundary, annually refreshed variables, and dual-check model present a balanced, transparent baseline that decision-makers can trace back to published series and repeatable steps. We believe this provides clients with the most dependable starting point for strategic planning.
Key Questions Answered in the Report
How big is the United States freight brokerage market today?
How big is the United States freight brokerage market today?
Which segment is growing fastest within U.S. freight brokerage?
Which segment is growing fastest within U.S. freight brokerage?
What is driving demand for refrigerated brokerage capacity?
What is driving demand for refrigerated brokerage capacity?
How are cross-border volumes affecting brokers?
How are cross-border volumes affecting brokers?
Are small businesses using freight brokers more often?
Are small businesses using freight brokers more often?
What regulatory issues should brokers monitor?
What regulatory issues should brokers monitor?


