
Market Overview
| Study Period | 2021 - 2031 |
|---|---|
| Forecast Data Period | 2026 - 2031 |
| Base Year Market Size (2025) | USD 315.4 Million |
| Market Size (2026) | USD 333.63 Million |
| Market Size (2031) | USD 441.86 Million |
| Growth Rate (2026 - 2031) | 5.78 % |
| Market Concentration | Medium |
Major Players *Disclaimer: Major Players sorted in no particular order Image © Mordor Intelligence. Reuse requires attribution under CC BY 4.0. | |
US Food Allergen Testing Market Analysis by Mordor Intelligence
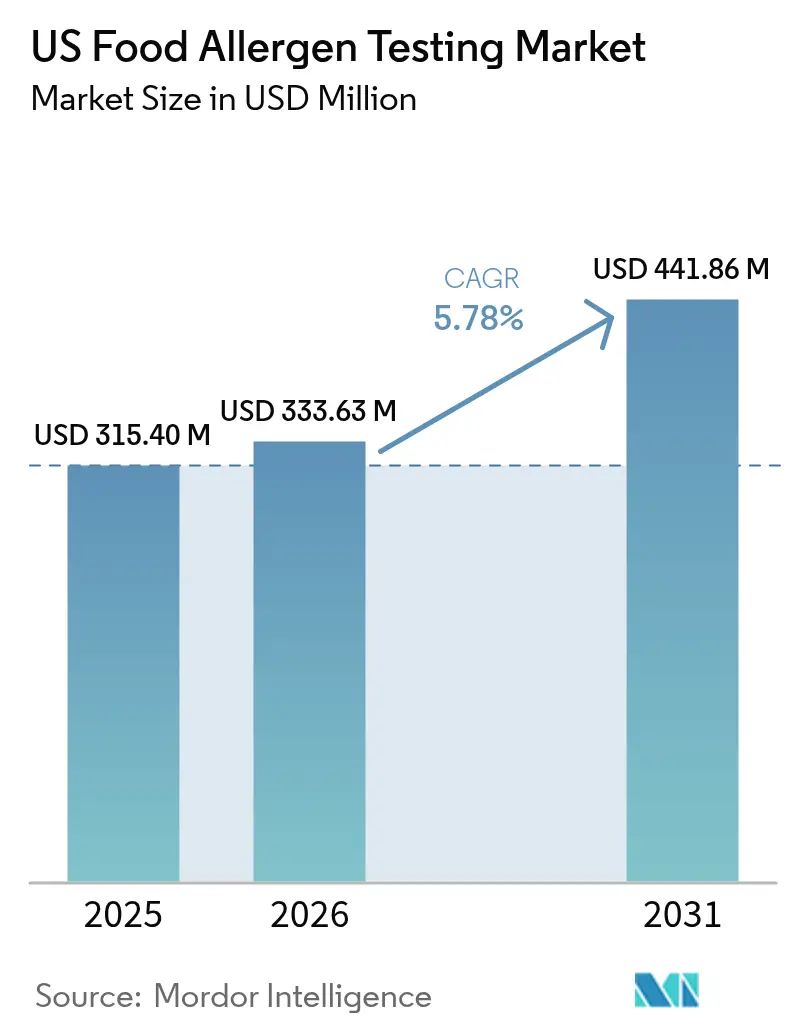
The United States food allergen testing market size in 2026 is estimated at USD 333.63 million, growing from 2025 value of USD 315.4 million with 2031 projections showing USD 441.86 million, growing at 5.78% CAGR over 2026-2031. This growth trajectory reflects the market's response to heightened regulatory scrutiny following the Food Allergy Safety, Treatment, Education, and Research (FASTER) Act, which designated sesame as the ninth major food allergen effective January 2023 [1]. The growth reflects stricter enforcement following the FASTER Act, a rising incidence of food allergies, and a shift toward rapid, cost-effective testing solutions. Immunoassay/ELISA platforms continue to dominate because of validated methods and favorable economics, yet next-generation sequencing (NGS) is gaining notice for detecting multiple allergens in highly processed foods. Regionally, the South holds the largest share, while the West registers the strongest expansion, helped by its plant-based innovation ecosystem. The competitive intensity remains moderate; acquisitions and large-scale capital programs illustrate a race to broaden service portfolios, integrate technology, and secure regulatory credentials.
Key Report Takeaways
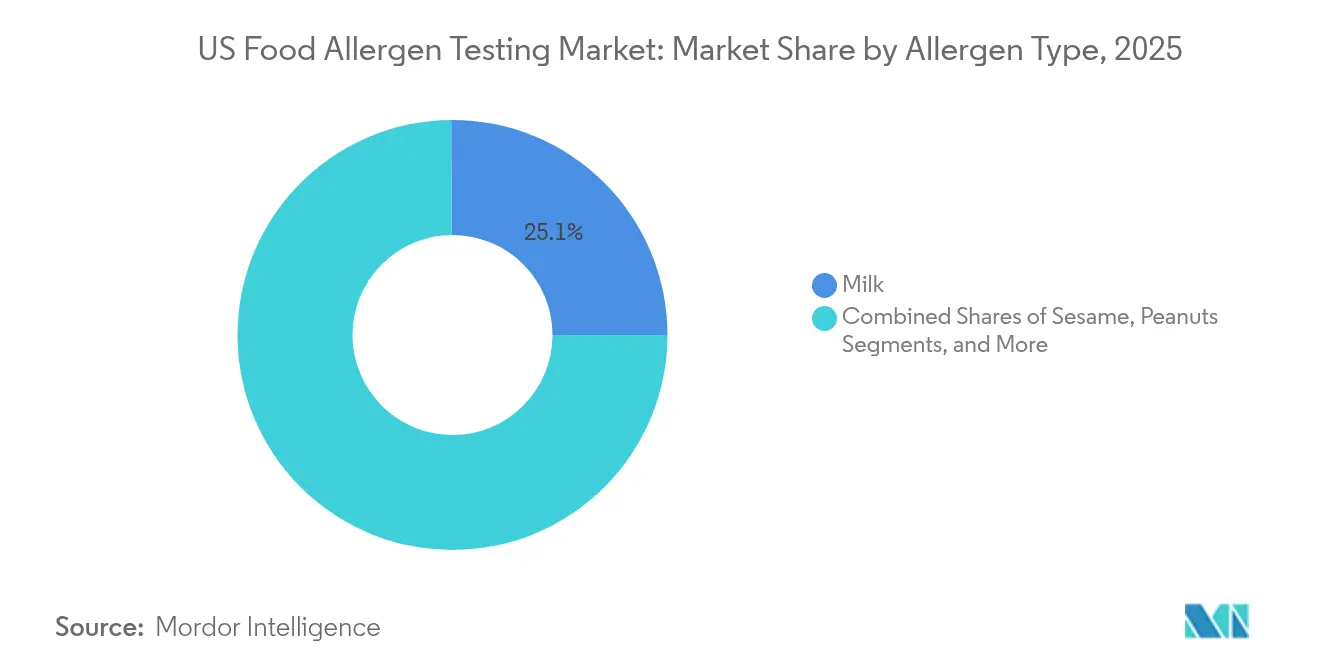
- By allergen type, milk led with 25.10% revenue share in 2025, while sesame testing is forecast to rise at an 7.84% CAGR.
- By technology, immunoassay/ELISA maintained 45.85% of the food allergen testing market share in 2025; NGS is projected to post a 6.55% CAGR through 2031.
- By food tested, dairy products accounted for a 32.85% share of the food allergen testing market size in 2025, whereas plant-based and novel proteins are on track to expand at a 7.42% CAGR to 2031.
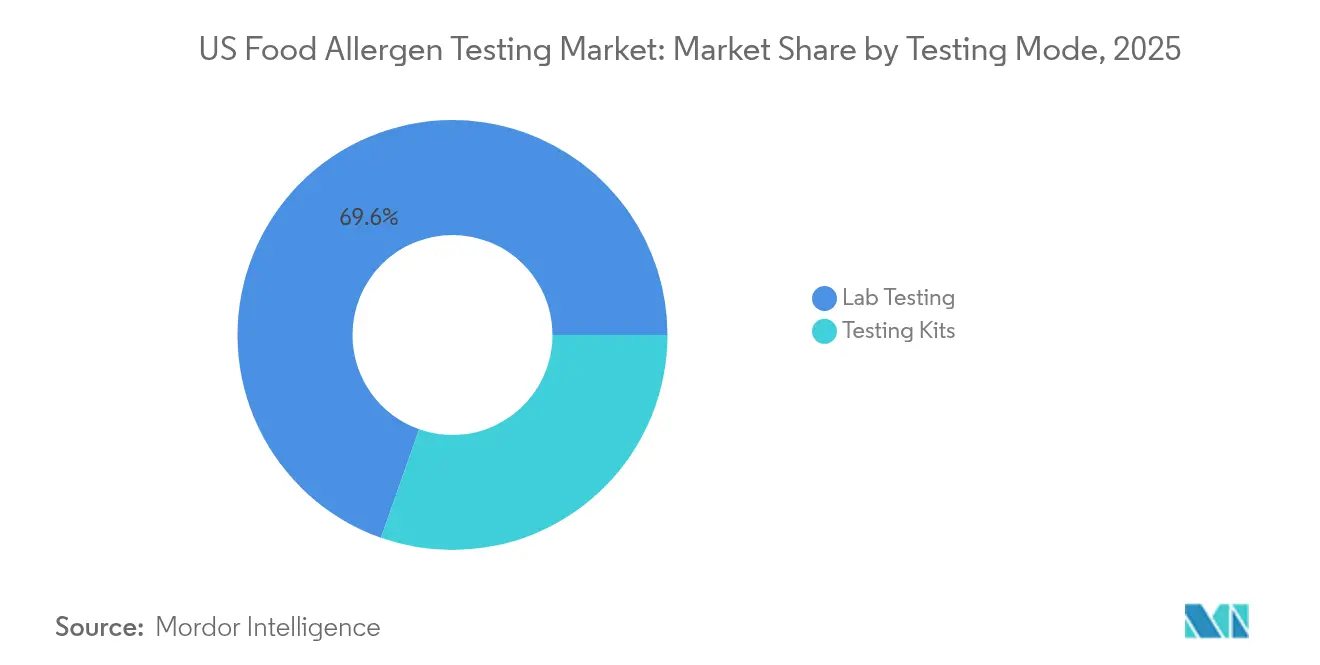
- By testing mode, laboratory services dominated with 69.60% of the food allergen testing market share in 2025; kits are growing the fastest at 7.25% CAGR.
- By geography, the South held 28.40% of the food allergen testing market share in 2025; the West is expected to register a 6.85% CAGR through 2031.
Note: Market size and forecast figures in this report are generated using Mordor Intelligence’s proprietary estimation framework, updated with the latest available data and insights as of 2026.
US Food Allergen Testing Market Trends and Insights
Drivers Impact Analysis*
| Driver | (~) % Impact on CAGR Forecast | Geographic Relevance | Impact Timeline |
|---|---|---|---|
| Rising food allergy incidence | +1.2% | National (urban focus) | Long term (≥ 4 years) |
| Stringent food safety regulations | +1.8% | National (state nuances) | Medium term (2-4 years) |
| Growth in packaged and processed foods | +0.9% | National (processing hubs) | Long term (≥ 4 years) |
| Technological advances in testing methods | +1.1% | Northeast, West early use | Medium term (2-4 years) |
| Consumer demand for transparency | +0.7% | Premium market segments | Long term (≥ 4 years) |
| Increase in allergen-related recalls | +0.4% | Supply-chain clusters | Short term (≤ 2 years) |
| Source: Mordor Intelligence | |||
Increasing Incidence of Food Allergies in the United States
The increasing incidence of food allergies in the United States is a major driver for the growth of the food allergen testing market. As more consumers become aware of severe allergic reactions, including anaphylaxis, there is heightened demand for transparency and safety in food production. This has prompted food manufacturers to implement comprehensive allergen testing to prevent cross-contamination and protect brand reputation. Regulatory bodies like the FDA have also tightened labeling and compliance requirements, making allergen testing a critical step in meeting safety standards. Additionally, the surge in popularity of “free-from” foods—such as gluten-free, nut-free, and dairy-free products—has created a need for accurate verification through testing. Retailers and foodservice providers increasingly require documentation of allergen controls from suppliers to protect sensitive consumers. Technological advancements in testing methods, such as PCR and ELISA, have also made allergen detection faster and more reliable, further supporting market growth. Overall, rising allergy prevalence is reshaping industry practices, placing allergen testing at the core of food safety strategies.
Stringent Food Safety Regulations
The FASTER Act's designation of sesame as the ninth major allergen triggered comprehensive labeling and testing requirement updates across the food industry, with compliance enforcement intensifying throughout 2024. The FDA's warning letter to Bimbo Bakeries in June 2024 for allergen mislabeling demonstrates the agency's aggressive enforcement posture, signaling heightened compliance risks for manufacturers. The USDA's expanded Allergen Verification Sampling Program, effective September 2024, now covers 14 allergens including the 'Big 9' for ready-to-eat products, substantially broadening testing requirements[2] . State-level variations in enforcement create compliance complexity, particularly for multi-state food processors who must navigate differing interpretation standards and inspection frequencies. The FDA's Laboratory Accreditation for Analyses of Foods program establishes mandatory third-party testing requirements for specific import scenarios, driving demand for accredited testing services. Regulatory uncertainty around emerging allergens beyond the major nine creates strategic testing challenges, as manufacturers must balance comprehensive protection against cost optimization in an evolving regulatory landscape.
Technological Advancements in Testing Methods
Nanobody technology from camelid antibodies offers superior stability and specificity compared to traditional antibodies, with research demonstrating effective detection of macadamia, peanut, lupin, and milk proteins with minimized cross-reactions. Next-generation sequencing platforms enable simultaneous detection of multiple allergens with enhanced sensitivity, though adoption remains limited by cost considerations and technical complexity in routine testing environments. Artificial intelligence integration in allergen prediction models, such as AllergenAI, demonstrates potential for identifying novel allergenic proteins based on sequence analysis, though regulatory acceptance for these predictive tools remains uncertain. Biosensor technology advances, including smartphone-based detection systems and electrochemical methods, promise point-of-use testing capabilities that could revolutionize supply chain allergen monitoring. The integration of mass spectrometry with liquid chromatography provides enhanced specificity for processed foods where traditional immunoassays may fail, though equipment costs limit widespread adoption to larger testing facilities.
Growing Consumer Awareness and Demand for Transparency
Consumer litigation risks have intensified following high-profile allergen-related lawsuits, compelling manufacturers to adopt more comprehensive testing protocols as legal protection strategies. Social media amplification of allergen-related incidents creates reputational risks that extend beyond immediate health concerns, driving demand for third-party testing verification to support marketing claims. The rise of specialty diet segments, including gluten-free, dairy-free, and plant-based categories, requires dedicated testing protocols to validate allergen-free claims that command premium pricing. Consumer education initiatives by organizations like Food Allergy Research and Education create more informed buyers who actively scrutinize ingredient labels and testing certifications. The emergence of allergen-free certification programs creates competitive differentiation opportunities, though the proliferation of different standards creates confusion and compliance complexity. Direct-to-consumer food brands face unique testing challenges, as they lack the infrastructure of established manufacturers but must meet identical safety standards to access mainstream distribution channels.
Restraints Impact Analysis*
| Restraint | (~) % Impact on CAGR Forecast | Geographic Relevance | Impact Timeline |
|---|---|---|---|
| High cost of advanced testing technologies | -0.8% | National, with greater pressure on small and mid-size plants | Medium term (2-4 years) |
| Lack of standardized testing protocols across facilities | -0.6% | National, with region-to-region implementation disparities | Long term (≥ 4 years) |
| Complexity of allergen detection in processed foods | -0.5% | National, acute in multi-ingredient production clusters | Medium term (2-4 years) |
| Evolving allergen regulations | -0.7% | National, intensified in states with stricter enforcement | Short term (≤ 2 years) |
| Source: Mordor Intelligence | |||
High Cost of Advanced Testing Technologies
Advanced testing equipment, including LC-MS/HPLC-MS systems and next-generation sequencing platforms, requires capital huge investments, creating barriers for smaller food processors and regional testing laboratories. The Bureau of Labor Statistics [3]reports median wages of USD 28.79 per hour for testing laboratory personnel, with specialized technicians commanding premium salaries that compound operational cost pressures. FARRP's (Food Allergy Research and Resource Program) testing services range from USD 55 to USD 205 per allergen test, with rush processing commanding additional premiums, illustrating the cost sensitivity that drives many manufacturers toward less comprehensive testing protocols. Maintenance and calibration costs for sophisticated testing equipment can go high, creating ongoing financial pressure that may discourage technology upgrades. The geographic concentration of advanced testing capabilities in major metropolitan areas creates logistical costs and time delays for manufacturers in rural regions, particularly affecting agricultural processors with seasonal testing demands.
Lack of Standardized Testing Protocols Across Facilities
The absence of harmonized testing methodologies creates validation challenges when manufacturers work with multiple testing laboratories, as different analytical approaches may yield inconsistent results for identical samples. Cross-reactivity issues in immunoassay-based testing, particularly for closely related proteins, require facility-specific validation studies that increase implementation costs and complexity. The proliferation of testing kit manufacturers, each with proprietary methodologies and sensitivity thresholds, creates procurement complexity and results interpretation challenges for quality assurance teams. International supply chain integration requires reconciliation of different national testing standards, creating compliance complexity for manufacturers serving both domestic and export markets. The evolution of food processing techniques, including novel thermal treatments and ingredient modifications, outpaces standardization efforts, leaving manufacturers to develop proprietary testing protocols without regulatory guidance. Training standardization across testing personnel remains inconsistent, as different laboratories may emphasize different aspects of testing procedures, creating variability in results quality and interpretation.
*Our forecasts treat driver/restraint impacts as directional, not additive. The impact forecasts reflect baseline growth, mix effects, and variable interactions.
Segment Analysis
By Allergen Type: Sesame Drives Regulatory Compliance
Milk allergens command the largest market share at 25.10% in 2025, reflecting their ubiquity in processed foods and the complexity of dairy-derived ingredients that require comprehensive testing across multiple protein fractions. The sesame allergen segment demonstrates the fastest growth at 7.84% CAGR through 2031, driven by the FASTER Act's January 2023 implementation that mandated sesame labeling as the ninth major allergen according to FDA (Food and Drug Administration). Tree nuts maintain significant testing demand due to cross-contamination risks in shared processing facilities, while peanut testing remains critical given the severity of allergic reactions and legal liability concerns. Egg allergens present unique challenges in processed foods where protein modifications during cooking may affect detectability, requiring specialized testing protocols for heat-treated products.
Wheat and soy allergens benefit from established testing methodologies, though the rise of alternative grain processing creates new contamination pathways that traditional protocols may not adequately address. Fish and shellfish allergens face increasing complexity as aquaculture practices diversify and processing facilities handle multiple species simultaneously. The "Others" category encompasses emerging allergens like mustard and celery that lack standardized testing protocols, creating market opportunities for specialized testing service providers. Aptamer-based detection systems, such as AYA22AR321 for peanut allergens, demonstrate potential for enhanced specificity and reduced cross-reactivity compared to traditional antibody-based methods

By Technology: NGS Emerges Despite ELISA Dominance
Immunoassay/ELISA technology maintains market leadership with 45.85% share in 2025, supported by established validation protocols, cost-effectiveness, and widespread laboratory familiarity that enables rapid implementation across diverse testing environments. Next-generation sequencing represents the fastest-growing segment at 6.55% CAGR through 2031, driven by its ability to simultaneously detect multiple allergens and provide definitive identification even in highly processed foods where protein structures may be altered. PCR-based methods offer enhanced sensitivity for detecting allergenic DNA sequences, particularly valuable for processed foods where protein-based detection may fail due to thermal degradation or chemical modification. Lateral-flow and biosensor technologies gain traction for point-of-use applications, enabling real-time testing in production environments though sensitivity limitations restrict their use to screening applications.
LC-MS/HPLC-MS systems provide superior specificity for complex food matrices, with university research demonstrating their effectiveness in analyzing processed foods' allergenic potential, though high equipment costs limit adoption to larger testing facilities. Other rapid methods, including nanobody-based assays, offer enhanced stability and reduced cross-reactivity compared to traditional antibodies, with research demonstrating effective detection of macadamia, peanut, and milk proteins. The integration of artificial intelligence in testing interpretation, exemplified by AllergenAI's protein sequence analysis capabilities, suggests future automation potential though regulatory acceptance remains uncertain. Technology selection increasingly depends on food matrix complexity, with highly processed foods requiring more sophisticated analytical approaches than raw ingredients.
By Food Tested: Plant-Based Innovation Drives Growth
Dairy products command the largest testing market share at 32.85% in 2025, reflecting both the prevalence of milk allergens and the complexity of dairy-derived ingredients that require testing across multiple processing stages and product formulations. Plant-based and novel proteins emerge as the fastest-growing segment at 7.42% CAGR through 2031, driven by consumer adoption of alternative proteins and the associated cross-contamination risks that require specialized testing protocols for emerging food categories. Bakery and confectionery products maintain substantial testing demand due to the common use of multiple allergenic ingredients and shared processing equipment that creates cross-contamination risks. Meat and seafood testing faces increasing complexity as processing facilities diversify protein sources and implement novel preservation techniques that may affect allergen detectability.
Baby food and infant formula represent a critical testing segment where regulatory requirements are most stringent, given the vulnerability of the target population and the potential severity of allergic reactions in infants. Beverage testing encompasses both traditional dairy-based products and emerging plant-based alternatives, with the latter requiring validation of allergen-free claims that command premium pricing. Other processed foods encompass specialty diet products and ethnic foods that may contain non-traditional allergens requiring customized testing approaches. The emergence of precision fermentation and cellular agriculture introduces novel protein sources with unknown allergenic profiles, creating demand for comprehensive safety assessment protocols.
By Testing Mode: Kits Gain Ground on Laboratory Dominance
Laboratory testing maintains dominance with 69.60% market share in 2025, supported by regulatory requirements for third-party validation and the analytical complexity required for definitive allergen identification in processed foods. Testing kits demonstrate the fastest growth at 7.25% CAGR through 2031, driven by manufacturers' desire for rapid, cost-effective screening capabilities that enable immediate production decisions without laboratory turnaround delays. Rapid testing adoption for pathogen analysis, suggesting similar growth potential for allergen testing kits as technology improves and regulatory acceptance increases.
Laboratory testing provides the analytical rigor required for regulatory compliance and legal protection, particularly for products entering interstate commerce or export markets where documentation requirements are stringent. Testing kits offer operational advantages including reduced sample handling, faster results, and lower per-test costs, though sensitivity limitations may restrict their use to screening applications rather than definitive analysis. The integration of smartphone-based readers and cloud connectivity in testing kits enables real-time data collection and trend analysis that supports continuous improvement in allergen control programs. Hybrid approaches combining kit-based screening with laboratory confirmation for positive results optimize both cost and analytical confidence, particularly for high-volume production environments where comprehensive testing would be prohibitively expensive.
Geography Analysis
The South region's market leadership at 28.40% share in 2025 stems from its concentration of food processing infrastructure, particularly in states like Texas, Georgia, and North Carolina, where major food manufacturers maintain production facilities that require comprehensive allergen testing protocols. The region benefits from established agricultural supply chains and ingredient processing facilities that create natural clusters of testing demand, supported by universities with food science programs that provide technical expertise and workforce development.
The South's growth trajectory benefits from continued food manufacturing investment and the expansion of plant-based protein production facilities that require specialized allergen testing protocols. However, the region faces challenges from seasonal agricultural production variations that create testing demand fluctuations and capacity constraints during peak processing periods. The West region's fastest growth at 6.85% CAGR through 2031 reflects its leadership in food innovation, particularly in plant-based and alternative protein categories that require novel testing approaches and specialized analytical capabilities. California's stringent food safety regulations often exceed federal requirements, creating demand for enhanced testing protocols that other states subsequently adopt, positioning Western laboratories as early adopters of advanced testing technologies.
The Northeast and Midwest regions maintain steady market positions, with the Northeast benefiting from dense population centers with high food allergy awareness and proximity to regulatory agencies that drive compliance requirements, while the Midwest leverages its agricultural processing infrastructure and established food manufacturing base. The FDA's Laboratory Flexible Funding Model allocated USD 23.2 million across 55 state programs in 2024, with significant investments in Northeastern and Midwestern laboratories that enhance regional testing capacity. Regional testing capacity distribution reflects historical food industry development patterns, though emerging food categories and changing consumer preferences are driving geographic shifts in testing demand that favor regions with innovation ecosystems and regulatory leadership.
Regulatory Landscape
US food allergen testing demand is shaped by FDA allergen labeling requirements under FALCPA and the FASTER Act, with sesame recognized as a major allergen (the "Big 9") and enforced through labeling and preventive controls expectations across packaged foods. In January 2025, FDA updated its "Questions and Answers Regarding Food Allergens" (Edition 5), consolidating practical interpretation points for major allergen declaration and handling, which increases the compliance value of validated analytical methods (ELISA, PCR, LC-MS) and defensible verification records.
For meat, poultry, and egg products, USDA-FSIS oversight adds an additional verification layer, shifting emphasis from label review toward sampling-based monitoring. FSIS announced an Allergen Verification Sampling Program for ready-to-eat products effective September 1, 2024, and supported laboratory-based screening and confirmation approaches for multiple allergens (including milk, egg, peanut, soy, tree nuts, crustacean shellfish, and gluten), reinforcing the need for accredited laboratory capability and harmonized methods across multi-category processors. A related FDA labeling policy anchor is the FDA-announced uniform compliance date of January 1, 2028 for new food labeling regulations issued on or before December 31, 2026, which informs how manufacturers plan changeovers and verification testing cycles.
Competitive Landscape
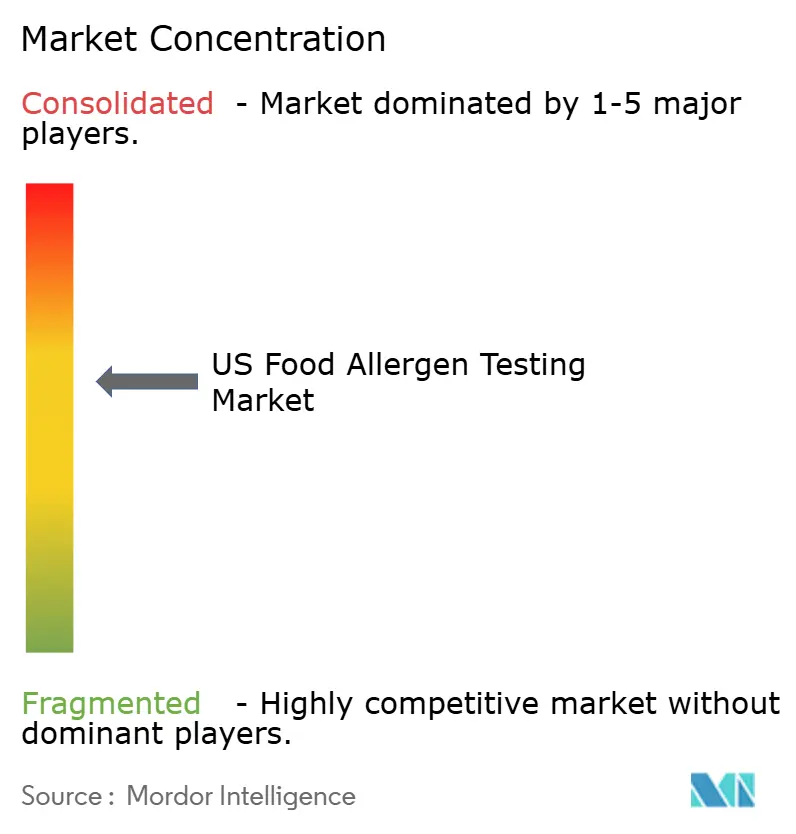
The food allergen testing market exhibits moderate consolidation, indicating substantial opportunities for both established players and specialized service providers to capture market share through technological differentiation and service innovation. Major players pursue vertical integration strategies, combining laboratory services with testing kit manufacturing and regulatory consulting to create comprehensive solutions that address the full spectrum of allergen control requirements. The competitive landscape increasingly favors companies that can provide rapid turnaround times, regulatory expertise, and technology integration capabilities that enable real-time monitoring and data analytics for continuous improvement in allergen control programs.
Emerging disruptors focus on technology innovation, particularly in rapid testing solutions and AI-enhanced analytical capabilities that promise to reduce costs and improve accuracy compared to traditional laboratory methods. In April 2025, Thermo Fisher Scientific's USD 2 billion U.S. investment commitment over four years signals the industry's confidence in sustained growth and the importance of domestic manufacturing capabilities for analytical instruments and diagnostics.
Strategic partnerships between testing service providers and food manufacturers create integrated solutions that embed allergen monitoring throughout the production process, from ingredient sourcing through final product validation. The market's moderate concentration creates opportunities for niche players specializing in specific allergens, food categories, or analytical techniques, particularly as regulatory requirements evolve and new food technologies emerge that require specialized testing approaches.
US Food Allergen Testing Industry Leaders
-
Eurofins Scientific
-
SGS Société Générale de Surveillance SA.
-
Mérieux NutriSciences Corporation
-
BeaconPoint Labs, LLC
-
DSM-Firmenich AG (Romer Labs Division Holding)
- *Disclaimer: Major Players sorted in no particular order
Market Opportunities and Future Outlook
Opportunities center on compliance-driven verification and faster decision-making in complex, multi-ingredient production and import supply chains. FDA requirements for the major allergens, together with FDA enforcement posture, keep demand anchored in routine verification, while the FSMA Foreign Supplier Verification Programs (FSVP) rule pushes importers to show that foreign suppliers control allergen hazards through verification activities that can include sampling and testing. This creates openings for laboratories and kit providers to deliver documented, auditable allergen programs that cover supplier qualification, incoming ingredient checks, and finished-product release, particularly for brands with multi-site production and mixed USDA-FSIS and FDA oversight.
Technology development is also creating room for suppliers where conventional immunoassays face challenges, especially in highly processed matrices and multi-allergen screening. Academic work published in 2025-2026 points to multiplex sensing and integrated microfluidic qPCR for on-site analysis, while mass spectrometry methods continue to show robust performance in complex processed foods by targeting stable peptide markers. As manufacturers expand plant-based and novel-protein portfolios and manage cross-contact risk, demand increases for multi-analyte workflows that pair rapid screening (kits or on-site molecular tools) with confirmatory, high-specificity methods (LC-MS/MS, advanced PCR), along with standardization tools such as matrix-matched reference materials and more interpretable, explainable analytics for routine quality operations.
Recent Industry Developments
- June 2026: Me9rieux NutriSciences published technical guidance on trace allergen detection and control, describing how ELISA, PCR, and LC-MS/MS fit into risk-based allergen programs. The update emphasizes multi-method workflows, encouraging manufacturers to pair rapid screening with confirmatory approaches in complex matrices.
- September 2025: Me9rieux NutriSciences closed its acquisition of Bureau Veritas' food testing business. The combination expanded global laboratory footprint and service breadth, strengthening the company's ability to support multi-site food manufacturers that require consistent allergen testing and documentation across regions.
- October 2024: SGS North America announced expansion of its food and nutraceutical testing capacity by moving into a larger facility in Fairfield, New Jersey. The additional capacity supports higher sample throughput and broader analytical coverage for food safety programs, including allergen verification needed by packaged food and ingredient customers.
Research Methodology Framework and Report Scope
Market Definition and Coverage
This market covers revenue generated in the United States from testing that detects and measures allergens in food and beverage products, using lab services and test kits for screening and confirmation. The scope is commercial food safety and compliance testing linked to routine production and supplier controls.
The market scope excludes consumer self-test products and clinical allergy diagnostics for patients. It also excludes broader microbiology and contaminant testing when the work is not allergen-specific.
Segmentation Overview
- By Allergen Type
- Peanuts
- Tree Nuts
- Milk
- Eggs
- Wheat
- Soy
- Sesame
- Fish
- Shellfish
- Others
- By Technology
- Immunoassay/ELISA
- PCR
- Lateral-flow and Biosensors
- LC-MS/HPLC-MS
- Next-Generation Sequencing (NGS)
- Other Rapid Methods
- By Food Tested
- Dairy Products
- Bakery and Confectionery
- Meat and Seafood
- Baby Food and Infant Formula
- Beverages
- Plant-based/Novel Proteins
- Other Processed Foods
- By Testing Mode
- Lab Testing
- Testing Kits
- By Geography
- Northeast
- Midwest
- South
- West
Data Sources, Market Sizing, and Validation
Desk Research
For desk work, we map the rulebook and the demand triggers that make allergen testing a repeat activity for US food producers. Public sources such as FDA food labeling and allergen guidance, USDA food safety references, CDC food allergy statistics, and AOAC method information help us set boundaries on what counts as allergen testing and where it is used.
We then build the commercial picture using company annual reports and investor presentations, accredited laboratory directories, and university and peer-reviewed method studies (including ELISA, PCR, and LC-MS). We also review reputable coverage of recalls and enforcement actions to understand how testing practices show up operationally. Where it helps, paid subscriptions for company financials and intelligence, patent databases, and shipment-level trade data are used to sanity-check supplier activity and equipment and kit movement. These sources are not exhaustive, and we also reviewed other public materials to collect market inputs, validate assumptions, and clarify open questions.
Primary Interviews and Surveys
Primary work is used to stress-test what we saw in desk research, especially on how often plants run allergen panels, which allergen panels are most routinely screened, and how pricing differs between in-house kit use and outsourced laboratory testing. We spoke with food manufacturers, contract labs, kit and instrument stakeholders, and quality and regulatory professionals across the United States so the model reflects practical testing behavior, not only stated policies.
Distribution of primary research fieldwork respondents
| Company type | Respondent position |
|---|---|
| Top tier: 38% | CXOs: 16% |
| Mid tier: 45% | Functional/Unit leaders: 33% |
| Smaller Players: 17% | Managers: 51% |
Market-Sizing & Forecasting
Sizing starts with a top-down approach where the total demand pool is reconstructed from US packaged and processed food activity, plant-level quality control intensity, and how frequently allergen panels are run for high-risk categories. Into that logic, we incorporate practical inputs like recall and undeclared-allergen incident patterns, adoption of multi-allergen screening, the split between lab services and kits, typical test volumes per facility, and average prices by method (for example, ELISA versus PCR versus confirmatory mass spectrometry).
After the first pass is built, we use selective bottom-up approximations to corroborate the totals, including sampled lab revenue ranges, channel checks on kit movement, and a volume times ASP cross-check for a few common workflows. Where small labs or in-house testing may be under-reported, the gap is handled using penetration assumptions tied to facility counts and category risk, and these assumptions are then rechecked in interviews.
For forecasting, we use scenario analysis so growth can be tied to a short list of drivers that stakeholders consistently point to, such as labeling enforcement intensity, inclusion of additional allergens in routine programs, the speed of rapid testing adoption, and input cost movement that shifts testing frequency. The scenarios are kept simple and are reviewed against consensus expectations from industry practitioners before finalizing the outlook.
Data Validation & Update Cycle
Validation is done through step-by-step triangulation where model totals are compared with independent signals like recall trends, lab accreditation footprints, and method adoption direction shared in interviews. If a number looks off, we reopen the relevant inputs and trigger follow-up outreach to confirm whether the issue is pricing, test frequency, or a scope mismatch.
Before sign-off, the build is reviewed across more than one analyst pass so calculation logic and assumptions stay consistent across years and categories. The report is refreshed annually, and interim updates are added when material events occur, such as major rule changes or sharp shifts in food recall dynamics. Right before delivery, we run a final check so clients receive the latest updated view.
Mordor Intelligence's United States Food Allergen Testing Market Estimate Compared With Other Published Estimates
It is normal to see different market sizes for US food allergen testing because publishers may count different revenue streams, use different base years, and apply different pricing logic for lab services versus kits. Differences can also come from how each study treats confirmatory testing, and whether recalls and regulatory changes are translated into testing frequency in a consistent way.
By tracking routine test frequency by food category and updating method-mix pricing each year, Mordor Intelligence keeps the estimate aligned to repeatable quality-control demand rather than one-time compliance spikes. Some published estimates appear to lean more heavily on broad food testing totals or faster growth assumptions without the same checks on what share is truly allergen-specific, which can shift the base year materially.
Benchmark comparison
| Source | Market Size | Gaps in Research Methodology |
|---|---|---|
| Mordor Intelligence | USD 315.40 M (2025) | |
| Industry Data Publisher A | USD 229.90 M (2024) | Uses an earlier base year and appears to weight the market more toward kit-driven screening volumes, which can undercount outsourced lab service revenue in categories with heavy third-party testing. |
| Trade Outlet B | USD 245.63 M (2024) | The estimate is tied to a different time window and is presented with a higher-growth arc, with limited clarity on whether confirmatory methods and multi-allergen panels are fully included in the value definition. |
The spread across the three numbers is mainly explained by year selection and what is included inside allergen testing revenue, especially the balance between lab services, kits, and confirmatory workflows. Using clearly stated scope rules and a few repeatable demand indicators makes the market value easier to reconcile and update when testing behavior changes.
Key Questions Answered in the Report
What is the current value of the U.S. food allergen testing market?
The food allergen testing market reached USD 333.63 million in 2026.
Which allergen category is growing the fastest?
Sesame testing is projected to expand at an 7.84% CAGR through 2031 following its inclusion as the ninth major allergen.
Why are testing kits gaining popularity?
Kits deliver rapid, on-site screening with a 7.25% CAGR, helping processors make immediate line decisions before confirmatory laboratory analysis.
What technology is currently dominant in allergen testing?
Immunoassay/ELISA holds the lead with a 45.85% market share due to cost-effectiveness and validated protocols, although NGS is rising steadily.