
| Study Period | 2017 - 2030 |
| Base Year For Estimation | 2024 |
| Forecast Data Period | 2025 - 2030 |
| Market Size (2025) | USD 0.83 Billion |
| Market Size (2030) | USD 1.11 Billion |
| CAGR (2025 - 2030) | 5.93 % |
| Market Concentration | Medium |
Major Players*Disclaimer: Major Players sorted in no particular order |


United States Feed Minerals Market Analysis
The United States Feed Minerals Market size is estimated at 0.83 billion USD in 2025, and is expected to reach 1.11 billion USD by 2030, growing at a CAGR of 5.93% during the forecast period (2025-2030).
The U.S. feed minerals industry is experiencing significant transformation driven by evolving consumer preferences and an increasing focus on livestock health and productivity. The industry has witnessed substantial consolidation, with 6,232 feed mills across the country in 2022, enabling better quality control and standardization of mineral supplementation practices. This consolidation has led to improved efficiency in production and distribution channels, while also facilitating the adoption of advanced technologies in mineral formulation and delivery systems. The trend towards precision nutrition has become particularly prominent, with feed manufacturers investing in research and development to optimize mineral bioavailability and absorption rates.
The market structure continues to evolve with a clear distinction between macro and micromineral segments, where macrominerals dominate with an 89.1% share of the total feed minerals market in 2022. This dominance reflects the industry's response to the growing understanding of mineral nutrition's role in animal health and performance. Feed manufacturers are increasingly focusing on developing innovative mineral premix formulations that enhance feed efficiency and animal productivity while reducing environmental impact. The industry has also witnessed a surge in the adoption of organic mineral compounds, which offer improved bioavailability compared to traditional inorganic sources.
Technological advancement in feed processing and mineral supplementation has become a defining characteristic of the industry. Companies are investing in sophisticated analytical tools and quality control systems to ensure precise mineral inclusion rates and uniform distribution in feed products. The integration of digital technologies in feed formulation and production processes has enabled manufacturers to respond more effectively to changing market demands and regulatory requirements. This technological evolution has been accompanied by increased attention to sustainability practices, with manufacturers exploring ways to reduce mineral waste and environmental impact while maintaining optimal animal nutrition minerals levels.
The industry is witnessing a shift in demand patterns influenced by changing consumer preferences for high-quality animal products. This is reflected in the growing emphasis on mineral nutrition in poultry production, where micromineral usage accounts for 42.5% of the total market value in 2022. Feed manufacturers are responding by developing specialized feed additives tailored to specific production stages and animal species. The trend towards sustainable and responsible production practices has also led to an increased focus on reducing mineral excretion through improved formulation strategies and the use of highly bioavailable mineral sources. These developments are reshaping the competitive landscape and driving innovation in product development and delivery systems.
United States Feed Minerals Market Trends
The United States poultry industry is one of the largest commercial food industry and increased consumption of meats and eggs is increasing the poultry production
- The US poultry industry is thriving due to the increasing demand for eggs and poultry meat in the commercial food industry and growing exports. The country is one of the largest egg producers and exporters globally, with the total egg exports in 2020 increasing by 9.3% to 3.5 billion eggs from the previous year and the export value growing by 2.4% to USD 189 million.
- The consumption of poultry meat in the United States has improved due to favorable prices, a rise in awareness of a high-protein diet, and the increasing demand for poultry meat. As a result, the poultry bird's headcount increased by 17.6 million in 2022 compared to the previous year. Raising chickens in small spaces and different environments makes poultry production more feasible and less expensive than beef and pork, attracting animal farmers with limited rearing areas to invest in poultry farms.
- However, the share of the United States is expected to decrease from 26% in 2021 to 24% in 2031 in terms of imports, which can affect the growth of the poultry feed market. The swine flu and trade disputes with China between 2018 and 2019 also contributed to the steady poultry population during the historical period, as animal farmers were reluctant to increase rearing.
- Despite these challenges, the increasing consumption of meat and eggs and rising exports, combined with the growing poultry population, are expected to drive the growth of the US feed additives market during the forecast period.

Understand The Key Trends Shaping This Market
Download PDF
Presence of a large number of fish farms and feed mills is contributing to increasing feed production for aquaculture
- The aquaculture feed production in the United States increased by 4.1% in 2022 compared to 2017. The presence of a large number of feed mills, which totaled 6,232 in the United States, contributed to this increase. The per capita consumption of seafood also increased from 21.88 kg in 2018 to 22.26 kg in 2022.
- Fish has a major share among the various aquaculture feed, accounting for 83.2% in 2022. This increasing share can be attributed to the rising awareness about the benefits of fish in the human diet, high demand in the international market, expansion of the retail sector, and the presence of a large number of fish farms in the country. The majority of fish farms are located in Ohio, and the most consumed fish is catfish. This is because catfish can convert pellet feed into fish pounds.
- Shrimp accounted for 7.5% of the aquaculture feed market in 2022, as it is the other most consumed aquatic animal due to the rise in demand for seafood and its high protein content. However, the country depends on other countries for shrimp, which has affected its growth during the study period. On the other hand, other aquatic species have witnessed high growth in demand, as the demand for bivalves from restaurants has increased after COVID-19 due to their popularity as a main cuisine. The high number of feed mills and rising demand for fish and seafood with increasing feed production of aquaculture are expected to drive the growth of the US feed additives market during the forecast period.

OTHER KEY INDUSTRY TRENDS COVERED IN THE REPORT
- United States-Mexico-Canada Agreement (USMCA) to export meat products and high demand for milk and dairy products for consumption and exports is increasing the demand for ruminants production
- Broiler feed accounted for 70.4% and high demand for high-quality meat products with country being largest exporter of poultry products in region is driving the growth of poultry feed production
- High number of pig farms, rising per capita consumption of pork, and increasing hogs in the the United States is increasing the production demand for swine feed
- The high demand for pork and expansion of contract operations for rearing hogs in the country is driving the swine production
- Ruminants feed production especially beef cattle feed is increasing due to high demand for high-quality beef meat in the food industry and home consumption
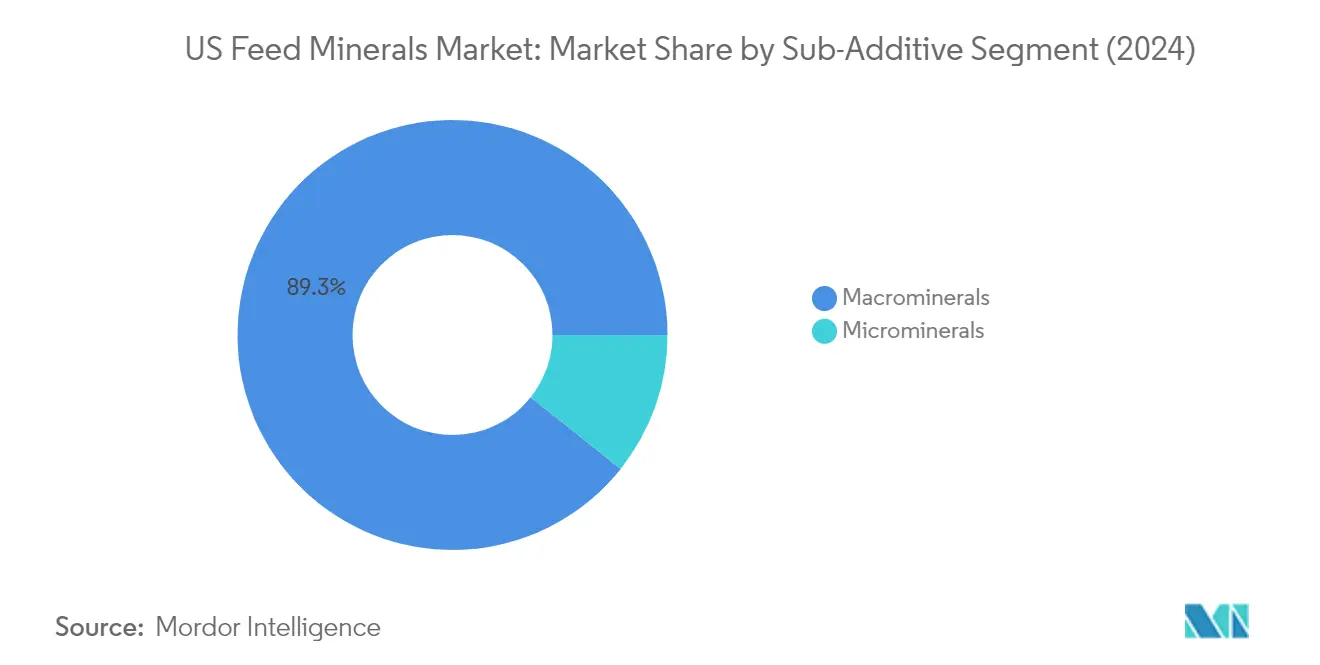
Segment Analysis: Sub Additive
Macrominerals Segment in US Feed Minerals Market
Macrominerals dominate the United States feed minerals market, commanding approximately 89% of the total market value in 2024. These essential nutrients, including calcium, chlorine, magnesium, potassium, and sulfur, are consumed in large quantities by livestock as they play a vital role in their metabolic processes. The segment's prominence is primarily driven by the growing demand for high-quality meat from the meat processing industry, particularly in the beef cattle sector, where macrominerals are crucial for skeletal development and maintenance. Additionally, macrominerals are experiencing the fastest growth trajectory in the market, projected to grow at nearly 6% during 2024-2029, supported by their essential role in supporting immune system function, reproductive health, and overall growth and development of livestock. The increasing awareness among farmers about the benefits of livestock mineral supplements in animal feed, coupled with the rising demand for premium meat products, continues to drive the segment's expansion in the United States.
Microminerals Segment in US Feed Minerals Market
The microminerals segment, while smaller in market share, plays a crucial role in livestock nutrition by preventing health problems such as anemia and increasing resistance to illnesses. These minerals are particularly important in the poultry segment, where they account for a significant portion of mineral supplementation. The segment is projected to demonstrate steady growth at approximately 5% during 2024-2029, driven by increasing awareness of their importance in animal health and productivity. Environmental and water quality fluctuations, along with modern husbandry practices, are creating situations that alter the physiological requirements for microminerals in livestock, thereby driving demand. The development of new mineral premix products by companies to meet these specific requirements, particularly in the poultry, ruminants, and swine segments, is further supporting the growth of this segment. The increasing focus on preventive health measures in livestock farming and the growing understanding of the role of microminerals in stress management and disease resistance continue to drive innovation and adoption in this segment.
Segment Analysis: Animal
Ruminants Segment in US Feed Minerals Market
The ruminants segment maintains its dominant position in the United States feed minerals market, accounting for approximately 56% of the total market value in 2024. This substantial market share is primarily driven by the segment's crucial role in both the meat and dairy industries, along with the country's large ruminant population. The segment's strength is particularly evident in beef cattle, which represents about 81% of the ruminant animal mineral supplements market, followed by dairy cattle and other ruminants. The segment's robust performance is supported by the increasing demand for high-quality meat products, growing awareness about animal nutrition, and the essential role of minerals in supporting metabolic processes, immune system function, and reproductive health in ruminants. Additionally, this segment is experiencing the fastest growth trajectory with a projected growth rate of nearly 7% from 2024 to 2029, driven by the rising demand for meat food products, the expanding ruminant population, and increasing awareness about the benefits of mineral consumption in animal feed.
Remaining Segments in Animal Segmentation
The remaining segments in the US feed minerals market include poultry, swine, aquaculture, and other animals, each serving distinct roles in the market landscape. The poultry segment represents the second-largest share, with broilers dominating the segment due to the increasing demand for chicken meat and the growing awareness of poultry nutrition. The swine segment maintains significant importance in the market, particularly due to the country's position as a major pork producer and the essential role of minerals in swine development. The aquaculture segment, though smaller in market share, demonstrates growing potential as the demand for seafood products increases. The other animals segment, including horses and various livestock species, contributes to the market's diversity by addressing specialized nutritional needs across different animal categories. The development of animal nutrition minerals and feed premix solutions tailored to these segments is crucial for meeting the diverse nutritional requirements of various animal species.
United States Feed Minerals Industry Overview
Top Companies in United States Feed Minerals Market
The feed minerals market in the United States is characterized by continuous product innovation and strategic expansion initiatives by major players. Companies are heavily investing in research and development to create new mineral formulations that enhance animal health and productivity while meeting stringent regulatory requirements. Operational agility is demonstrated through the establishment of local manufacturing facilities and distribution networks to ensure reliable supply chains and quick responses to market demands. Strategic moves in the industry primarily revolve around acquisitions of smaller specialty producers and partnerships with research institutions to enhance product portfolios and technological capabilities. Market leaders are also focusing on expanding their production capacities and geographical presence through new facility investments and upgrades to existing infrastructure, particularly in key agricultural regions across the United States.
Consolidated Market Led By Global Players
The United States feed minerals market exhibits a consolidated structure dominated by large multinational corporations with diverse product portfolios and extensive distribution networks. These global players leverage their substantial research capabilities, established brand reputation, and economies of scale to maintain their market positions. The market is characterized by a mix of agricultural conglomerates and specialized animal nutrition companies, with the former having advantages in terms of vertical integration and raw material access. Local players maintain their presence through specialized product offerings and strong regional distribution networks, though their market share remains limited compared to global leaders.
The industry has witnessed significant merger and acquisition activity, primarily driven by larger companies seeking to expand their product portfolios and geographical reach. Global players are particularly active in acquiring regional companies with a strong local presence or unique technological capabilities. This consolidation trend has led to increased market concentration, with major players strengthening their positions through strategic acquisitions. The presence of well-established distribution channels and long-term relationships with key customers creates significant barriers to entry for new market participants.
Innovation and Distribution Key to Growth
Success in the animal feed additives market increasingly depends on companies' ability to innovate and develop specialized products that address specific animal nutrition needs while improving production efficiency. Market leaders are focusing on developing premium products with enhanced bioavailability and absorption rates, while also investing in sustainable production methods to meet growing environmental concerns. Building strong relationships with feed manufacturers and large-scale farming operations through technical support and customized solutions has become crucial for maintaining market share. Companies are also investing in digital technologies and data analytics to provide value-added services and improve customer engagement.
For contenders looking to gain market share, focusing on niche segments and developing specialized products for specific animal species or regional requirements offers opportunities for growth. Success factors include establishing efficient distribution networks, maintaining competitive pricing strategies, and developing strong technical support capabilities. The increasing focus on animal welfare and sustainable production practices presents opportunities for companies to differentiate themselves through innovative products and solutions. Regulatory compliance and quality certifications remain critical factors for success, particularly as end-users become more conscious about feed safety and traceability. Building strategic partnerships with research institutions and technology providers can help companies stay competitive in an evolving market landscape. Additionally, the development of mineral premix solutions tailored to specific nutritional needs can provide a competitive edge.
United States Feed Minerals Market Leaders
-
Alltech, Inc.
-
Land O'Lakes
-
Phibro Animal Health Corporation
-
SHV (Nutreco NV)
-
Solvay S.A.
- *Disclaimer: Major Players sorted in no particular order

Need More Details on Market Players and Competiters?
Download PDF
United States Feed Minerals Market News
- April 2022: Cargill expanded its Global Animal Nutrition Center in the United States with an investment of USD 50 million to develop a new dairy innovation unit and a Research and Development (R&D) center.
- February 2021: Kemin Industries has introduced Kemtrace chromium-OR, an organic-compliant chromium propionate feed ingredient for use in swine, cattle, broiler, and horse diets.
- November 2020: Adisseo acquired Framelco Group, a Dutch feed additive company. This allowed the company to provide value-added, innovative livestock and aqua specialty products.
Free With This Report
We provide a complimentary and exhaustive set of data points on regional and country-level metrics that present the fundamental structure of the industry. Presented in the form of 35+ free charts, the section covers difficult-to-find data of various regions on feed production through various animal categories such as Ruminants, Poultry, Swine, and Aquaculture.


United States Feed Minerals Market Report - Table of Contents
1. EXECUTIVE SUMMARY & KEY FINDINGS
2. REPORT OFFERS
3. INTRODUCTION
- 3.1 Study Assumptions & Market Definition
- 3.2 Scope of the Study
- 3.3 Research Methodology
4. KEY INDUSTRY TRENDS
-
4.1 Animal Headcount
- 4.1.1 Poultry
- 4.1.2 Ruminants
- 4.1.3 Swine
-
4.2 Feed Production
- 4.2.1 Aquaculture
- 4.2.2 Poultry
- 4.2.3 Ruminants
- 4.2.4 Swine
-
4.3 Regulatory Framework
- 4.3.1 United States
- 4.4 Value Chain & Distribution Channel Analysis
5. MARKET SEGMENTATION (includes market size in Value in USD and Volume, Forecasts up to 2030 and analysis of growth prospects)
-
5.1 Sub Additive
- 5.1.1 Macrominerals
- 5.1.2 Microminerals
-
5.2 Animal
- 5.2.1 Aquaculture
- 5.2.1.1 By Sub Animal
- 5.2.1.1.1 Fish
- 5.2.1.1.2 Shrimp
- 5.2.1.1.3 fish
- 5.2.1.1.4 Other Aquaculture Species
- 5.2.2 Poultry
- 5.2.2.1 By Sub Animal
- 5.2.2.1.1 Broiler
- 5.2.2.1.2 Layer
- 5.2.2.1.3 Other Poultry Birds
- 5.2.3 Ruminants
- 5.2.3.1 By Sub Animal
- 5.2.3.1.1 Beef Cattle
- 5.2.3.1.2 Dairy Cattle
- 5.2.3.1.3 Other Ruminants
- 5.2.4 Swine
- 5.2.5 Other Animals
6. COMPETITIVE LANDSCAPE
- 6.1 Key Strategic Moves
- 6.2 Market Share Analysis
- 6.3 Company Landscape
-
6.4 Company Profiles (includes Global Level Overview, Market Level Overview, Core Business Segments, Financials, Headcount, Key Information, Market Rank, Market Share, Products and Services, and Analysis of Recent Developments).
- 6.4.1 Adisseo
- 6.4.2 Alltech, Inc.
- 6.4.3 Archer Daniel Midland Co.
- 6.4.4 BASF SE
- 6.4.5 Cargill Inc.
- 6.4.6 Kemin Industries
- 6.4.7 Land O'Lakes
- 6.4.8 Phibro Animal Health Corporation
- 6.4.9 SHV (Nutreco NV)
- 6.4.10 Solvay S.A.
7. KEY STRATEGIC QUESTIONS FOR FEED ADDITIVE CEOS
8. APPENDIX
-
8.1 Global Overview
- 8.1.1 Overview
- 8.1.2 Porter’s Five Forces Framework
- 8.1.3 Global Value Chain Analysis
- 8.1.4 Global Market Size and DROs
- 8.2 Sources & References
- 8.3 List of Tables & Figures
- 8.4 Primary Insights
- 8.5 Data Pack
- 8.6 Glossary of Terms
You Can Purchase Parts Of This Report. Check Out Prices For Specific Sections
Get Price Break-up Now
List of Tables & Figures
- Figure 1:
- POPULATION OF POULTRY, NUMBER, UNITED STATES, 2017-2022
- Figure 2:
- POPULATION OF RUMINANTS, NUMBER, UNITED STATES, 2017-2022
- Figure 3:
- POPULATION OF SWINE, NUMBER, UNITED STATES, 2017-2022
- Figure 4:
- PRODUCTION VOLUME OF AQUACULTURE FEED, METRIC TON, UNITED STATES, 2017-2022
- Figure 5:
- PRODUCTION VOLUME OF POULTRY FEED, METRIC TON, UNITED STATES, 2017-2022
- Figure 6:
- PRODUCTION VOLUME OF RUMINANTS FEED, METRIC TON, UNITED STATES, 2017-2022
- Figure 7:
- PRODUCTION VOLUME OF SWINE FEED, METRIC TON, UNITED STATES, 2017-2022
- Figure 8:
- VOLUME OF FEED MINERALS, METRIC TON, UNITED STATES, 2017 - 2029
- Figure 9:
- VALUE OF FEED MINERALS, USD, UNITED STATES, 2017 - 2029
- Figure 10:
- VOLUME OF FEED MINERALS BY SUB ADDITIVE CATEGORIES, METRIC TON, UNITED STATES, 2017 - 2029
- Figure 11:
- VALUE OF FEED MINERALS BY SUB ADDITIVE CATEGORIES, USD, UNITED STATES, 2017 - 2029
- Figure 12:
- VOLUME SHARE OF FEED MINERALS BY SUB ADDITIVE CATEGORIES, %, UNITED STATES, 2017,2023 AND 2029
- Figure 13:
- VALUE SHARE OF FEED MINERALS BY SUB ADDITIVE CATEGORIES, %, UNITED STATES, 2017,2023 AND 2029
- Figure 14:
- VOLUME OF MACROMINERALS FEED MINERALS, METRIC TON, UNITED STATES, 2017 - 2029
- Figure 15:
- VALUE OF MACROMINERALS FEED MINERALS, USD, UNITED STATES, 2017 - 2029
- Figure 16:
- VALUE SHARE OF MACROMINERALS FEED MINERALS BY ANIMAL TYPE, %, UNITED STATES, 2022 AND 2029
- Figure 17:
- VOLUME OF MICROMINERALS FEED MINERALS, METRIC TON, UNITED STATES, 2017 - 2029
- Figure 18:
- VALUE OF MICROMINERALS FEED MINERALS, USD, UNITED STATES, 2017 - 2029
- Figure 19:
- VALUE SHARE OF MICROMINERALS FEED MINERALS BY ANIMAL TYPE, %, UNITED STATES, 2022 AND 2029
- Figure 20:
- VOLUME OF FEED MINERALS BY ANIMAL TYPE, METRIC TON, UNITED STATES, 2017 - 2029
- Figure 21:
- VALUE OF FEED MINERALS BY ANIMAL TYPE, USD, UNITED STATES, 2017 - 2029
- Figure 22:
- VOLUME SHARE OF FEED MINERALS BY ANIMAL TYPE, %, UNITED STATES, 2017,2023 AND 2029
- Figure 23:
- VALUE SHARE OF FEED MINERALS BY ANIMAL TYPE, %, UNITED STATES, 2017,2023 AND 2029
- Figure 24:
- VOLUME OF AQUACULTURE FEED MINERALS BY SUB ANIMAL TYPE, METRIC TON, UNITED STATES, 2017 - 2029
- Figure 25:
- VALUE OF AQUACULTURE FEED MINERALS BY SUB ANIMAL TYPE, USD, UNITED STATES, 2017 - 2029
- Figure 26:
- VOLUME SHARE OF AQUACULTURE FEED MINERALS BY SUB ANIMAL TYPE, %, UNITED STATES, 2017,2023 AND 2029
- Figure 27:
- VALUE SHARE OF AQUACULTURE FEED MINERALS BY SUB ANIMAL TYPE, %, UNITED STATES, 2017,2023 AND 2029
- Figure 28:
- VOLUME OF FISH FEED MINERALS, METRIC TON, UNITED STATES, 2017 - 2029
- Figure 29:
- VALUE OF FISH FEED MINERALS, USD, UNITED STATES, 2017 - 2029
- Figure 30:
- VALUE SHARE OF FISH FEED MINERALS BY SUB ADDITIVE CATEGORIES, %, UNITED STATES, 2022 AND 2029
- Figure 31:
- VOLUME OF SHRIMP FEED MINERALS, METRIC TON, UNITED STATES, 2017 - 2029
- Figure 32:
- VALUE OF SHRIMP FEED MINERALS, USD, UNITED STATES, 2017 - 2029
- Figure 33:
- VALUE SHARE OF SHRIMP FEED MINERALS BY SUB ADDITIVE CATEGORIES, %, UNITED STATES, 2022 AND 2029
- Figure 34:
- VOLUME OF OTHER AQUACULTURE SPECIES FEED MINERALS, METRIC TON, UNITED STATES, 2017 - 2029
- Figure 35:
- VALUE OF OTHER AQUACULTURE SPECIES FEED MINERALS, USD, UNITED STATES, 2017 - 2029
- Figure 36:
- VALUE SHARE OF OTHER AQUACULTURE SPECIES FEED MINERALS BY SUB ADDITIVE CATEGORIES, %, UNITED STATES, 2022 AND 2029
- Figure 37:
- VOLUME OF POULTRY FEED MINERALS BY SUB ANIMAL TYPE, METRIC TON, UNITED STATES, 2017 - 2029
- Figure 38:
- VALUE OF POULTRY FEED MINERALS BY SUB ANIMAL TYPE, USD, UNITED STATES, 2017 - 2029
- Figure 39:
- VOLUME SHARE OF POULTRY FEED MINERALS BY SUB ANIMAL TYPE, %, UNITED STATES, 2017,2023 AND 2029
- Figure 40:
- VALUE SHARE OF POULTRY FEED MINERALS BY SUB ANIMAL TYPE, %, UNITED STATES, 2017,2023 AND 2029
- Figure 41:
- VOLUME OF BROILER FEED MINERALS, METRIC TON, UNITED STATES, 2017 - 2029
- Figure 42:
- VALUE OF BROILER FEED MINERALS, USD, UNITED STATES, 2017 - 2029
- Figure 43:
- VALUE SHARE OF BROILER FEED MINERALS BY SUB ADDITIVE CATEGORIES, %, UNITED STATES, 2022 AND 2029
- Figure 44:
- VOLUME OF LAYER FEED MINERALS, METRIC TON, UNITED STATES, 2017 - 2029
- Figure 45:
- VALUE OF LAYER FEED MINERALS, USD, UNITED STATES, 2017 - 2029
- Figure 46:
- VALUE SHARE OF LAYER FEED MINERALS BY SUB ADDITIVE CATEGORIES, %, UNITED STATES, 2022 AND 2029
- Figure 47:
- VOLUME OF OTHER POULTRY BIRDS FEED MINERALS, METRIC TON, UNITED STATES, 2017 - 2029
- Figure 48:
- VALUE OF OTHER POULTRY BIRDS FEED MINERALS, USD, UNITED STATES, 2017 - 2029
- Figure 49:
- VALUE SHARE OF OTHER POULTRY BIRDS FEED MINERALS BY SUB ADDITIVE CATEGORIES, %, UNITED STATES, 2022 AND 2029
- Figure 50:
- VOLUME OF RUMINANTS FEED MINERALS BY SUB ANIMAL TYPE, METRIC TON, UNITED STATES, 2017 - 2029
- Figure 51:
- VALUE OF RUMINANTS FEED MINERALS BY SUB ANIMAL TYPE, USD, UNITED STATES, 2017 - 2029
- Figure 52:
- VOLUME SHARE OF RUMINANTS FEED MINERALS BY SUB ANIMAL TYPE, %, UNITED STATES, 2017,2023 AND 2029
- Figure 53:
- VALUE SHARE OF RUMINANTS FEED MINERALS BY SUB ANIMAL TYPE, %, UNITED STATES, 2017,2023 AND 2029
- Figure 54:
- VOLUME OF BEEF CATTLE FEED MINERALS, METRIC TON, UNITED STATES, 2017 - 2029
- Figure 55:
- VALUE OF BEEF CATTLE FEED MINERALS, USD, UNITED STATES, 2017 - 2029
- Figure 56:
- VALUE SHARE OF BEEF CATTLE FEED MINERALS BY SUB ADDITIVE CATEGORIES, %, UNITED STATES, 2022 AND 2029
- Figure 57:
- VOLUME OF DAIRY CATTLE FEED MINERALS, METRIC TON, UNITED STATES, 2017 - 2029
- Figure 58:
- VALUE OF DAIRY CATTLE FEED MINERALS, USD, UNITED STATES, 2017 - 2029
- Figure 59:
- VALUE SHARE OF DAIRY CATTLE FEED MINERALS BY SUB ADDITIVE CATEGORIES, %, UNITED STATES, 2022 AND 2029
- Figure 60:
- VOLUME OF OTHER RUMINANTS FEED MINERALS, METRIC TON, UNITED STATES, 2017 - 2029
- Figure 61:
- VALUE OF OTHER RUMINANTS FEED MINERALS, USD, UNITED STATES, 2017 - 2029
- Figure 62:
- VALUE SHARE OF OTHER RUMINANTS FEED MINERALS BY SUB ADDITIVE CATEGORIES, %, UNITED STATES, 2022 AND 2029
- Figure 63:
- VOLUME OF SWINE FEED MINERALS, METRIC TON, UNITED STATES, 2017 - 2029
- Figure 64:
- VALUE OF SWINE FEED MINERALS, USD, UNITED STATES, 2017 - 2029
- Figure 65:
- VALUE SHARE OF SWINE FEED MINERALS BY SUB ADDITIVE CATEGORIES, %, UNITED STATES, 2022 AND 2029
- Figure 66:
- VOLUME OF OTHER ANIMALS FEED MINERALS, METRIC TON, UNITED STATES, 2017 - 2029
- Figure 67:
- VALUE OF OTHER ANIMALS FEED MINERALS, USD, UNITED STATES, 2017 - 2029
- Figure 68:
- VALUE SHARE OF OTHER ANIMALS FEED MINERALS BY SUB ADDITIVE CATEGORIES, %, UNITED STATES, 2022 AND 2029
- Figure 69:
- MOST ACTIVE COMPANIES BY NUMBER OF STRATEGIC MOVES, COUNT, UNITED STATES, 2017 - 2023
- Figure 70:
- MOST ADOPTED STRATEGIES, COUNT, UNITED STATES, 2017 - 2023
- Figure 71:
- VALUE SHARE OF MAJOR PLAYERS, %, UNITED STATES
United States Feed Minerals Industry Segmentation
Macrominerals, Microminerals are covered as segments by Sub Additive. Aquaculture, Poultry, Ruminants, Swine are covered as segments by Animal.| Sub Additive | Macrominerals | |||
| Microminerals | ||||
| Animal | Aquaculture | By Sub Animal | Fish | |
| Shrimp | ||||
| fish | ||||
| Other Aquaculture Species | ||||
| Poultry | By Sub Animal | Broiler | ||
| Layer | ||||
| Other Poultry Birds | ||||
| Ruminants | By Sub Animal | Beef Cattle | ||
| Dairy Cattle | ||||
| Other Ruminants | ||||
| Swine | ||||
| Other Animals | ||||
Need A Different Region or Segment?
Customize Now
Market Definition
- FUNCTIONS - For the study, feed additives are considered to be commercially manufactured products that are used to enhance characteristics such as weight gain, feed conversion ratio, and feed intake when fed in appropriate proportions.
- RESELLERS - Companies engaged in reselling feed additives without value addition have been excluded from the market scope, to avoid double counting.
- END CONSUMERS - Compound feed manufacturers are considered to be end-consumers in the market studied. The scope excludes farmers buying feed additives to be used directly as supplements or premixes.
- INTERNAL COMPANY CONSUMPTION - Companies engaged in the production of compound feed as well as the manufacturing of feed additives are part of the study. However, while estimating the market sizes, the internal consumption of feed additives by such companies has been excluded.
| Keyword | Definition |
|---|---|
| Feed additives | Feed additives are products used in animal nutrition for purposes of improving the quality of feed and the quality of food from animal origin, or to improve the animals’ performance and health. |
| Probiotics | Probiotics are microorganisms introduced into the body for their beneficial qualities. (It maintains or restores beneficial bacteria to the gut). |
| Antibiotics | Antibiotic is a drug that is specifically used to inhibit the growth of bacteria. |
| Prebiotics | A non-digestible food ingredient that promotes the growth of beneficial microorganisms in the intestines. |
| Antioxidants | Antioxidants are compounds that inhibit oxidation, a chemical reaction that produces free radicals. |
| Phytogenics | Phytogenics are a group of natural and non-antibiotic growth promoters derived from herbs, spices, essential oils, and oleoresins. |
| Vitamins | Vitamins are organic compounds, which are required for normal growth and maintenance of the body. |
| Metabolism | A chemical process that occurs within a living organism in order to maintain life. |
| Amino acids | Amino acids are the building blocks of proteins and play an important role in metabolic pathways. |
| Enzymes | Enzyme is a substance that acts as a catalyst to bring about a specific biochemical reaction. |
| Anti-microbial resistance | The ability of a microorganism to resist the effects of an antimicrobial agent. |
| Anti-microbial | Destroying or inhibiting the growth of microorganisms. |
| Osmotic balance | It is a process of maintaining salt and water balance across membranes within the body's fluids. |
| Bacteriocin | Bacteriocins are the toxins produced by bacteria to inhibit the growth of similar or closely related bacterial strains. |
| Biohydrogenation | It is a process that occurs in the rumen of an animal in which bacteria convert unsaturated fatty acids (USFA) to saturated fatty acids (SFA). |
| Oxidative rancidity | It is a reaction of fatty acids with oxygen, which generally causes unpleasant odors in animals. To prevent these, antioxidants were added. |
| Mycotoxicosis | Any condition or disease caused by fungal toxins, mainly due to contamination of animal feed with mycotoxins. |
| Mycotoxins | Mycotoxins are toxin compounds that are naturally produced by certain types of molds (fungi). |
| Feed Probiotics | Microbial feed supplements positively affect gastrointestinal microbial balance. |
| Probiotic yeast | Feed yeast (single-cell fungi) and other fungi used as probiotics. |
| Feed enzymes | They are used to supplement digestive enzymes in an animal’s stomach to break down food. Enzymes also ensure that meat and egg production is improved. |
| Mycotoxin detoxifiers | They are used to prevent fungal growth and to stop any harmful mold from being absorbed in the gut and blood. |
| Feed antibiotics | They are used both for the prevention and treatment of diseases but also for rapid growth and development. |
| Feed antioxidants | They are used to protect the deterioration of other feed nutrients in the feed such as fats, vitamins, pigments, and flavoring agents, thus providing nutrient security to the animals. |
| Feed phytogenics | Phytogenics are natural substances, added to livestock feed to promote growth, aid in digestion, and act as anti-microbial agents. |
| Feed vitamins | They are used to maintain the normal physiological function and normal growth and development of animals. |
| Feed flavors and sweetners | These flavors and sweeteners help to mask tastes and odors during changes in additives or medications and make them ideal for animal diets undergoing transition. |
| Feed acidifiers | Animal feed acidifiers are organic acids incorporated into the feed for nutritional or preservative purposes. Acidifiers enhance congestion and microbiological balance in the alimentary and digestive tracts of livestock. |
| Feed minerals | Feed minerals play an important role in the regular dietary requirements of animal feed. |
| Feed binders | Feed binders are the binding agents used in the manufacture of safe animal feed products. It enhances the taste of food and prolongs the storage period of the feed. |
| Key Terms | Abbreviation |
| LSDV | Lumpy Skin Disease Virus |
| ASF | African Swine Fever |
| GPA | Growth Promoter Antibiotics |
| NSP | Non-Starch Polysaccharides |
| PUFA | Polyunsaturated Fatty Acid |
| Afs | Aflatoxins |
| AGP | Antibiotic Growth Promoters |
| FAO | The Food And Agriculture Organization of the United Nations |
| USDA | The United States Department of Agriculture |
Need More Details on Market Definition?
Ask a Question
Research Methodology
Mordor Intelligence follows a four-step methodology in all our reports.
- Step-1: IDENTIFY KEY VARIABLES: In order to build a robust forecasting methodology, the variables and factors identified in Step-1 are tested against available historical market numbers. Through an iterative process, the variables required for market forecast are set and the model is built on the basis of these variables.
- Step-2: Build a Market Model: Market-size estimations for the forecast years are in nominal terms. Inflation is not a part of the pricing, and the average selling price (ASP) is kept constant throughout the forecast period.
- Step-3: Validate and Finalize: In this important step, all market numbers, variables and analyst calls are validated through an extensive network of primary research experts from the market studied. The respondents are selected across levels and functions to generate a holistic picture of the market studied.
- Step-4: Research Outputs: Syndicated Reports, Custom Consulting Assignments, Databases & Subscription Platforms

Get More Details On Research Methodology
Download PDF


