
Market Overview
| Study Period | 2021 - 2031 |
|---|---|
| Forecast Data Period | 2026 - 2031 |
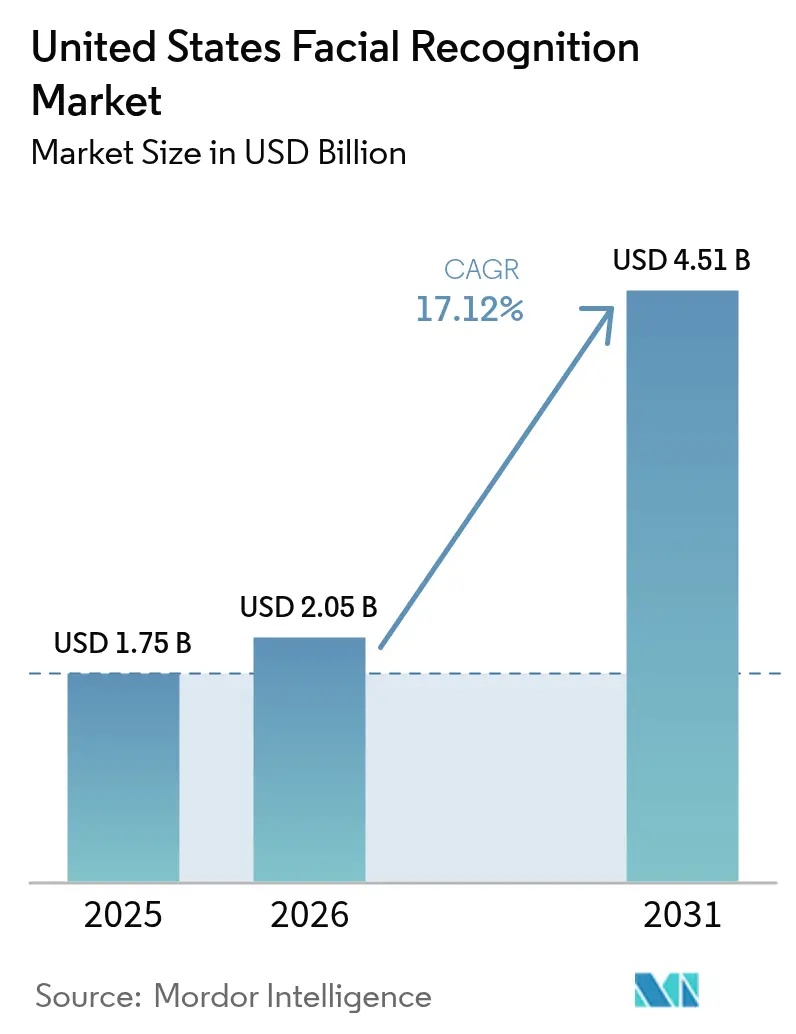
| Base Year Market Size (2025) | USD 1.75 Billion |
| Market Size (2026) | USD 2.05 Billion |
| Market Size (2031) | USD 4.51 Billion |
| Growth Rate (2026 - 2031) | 17.12 % |
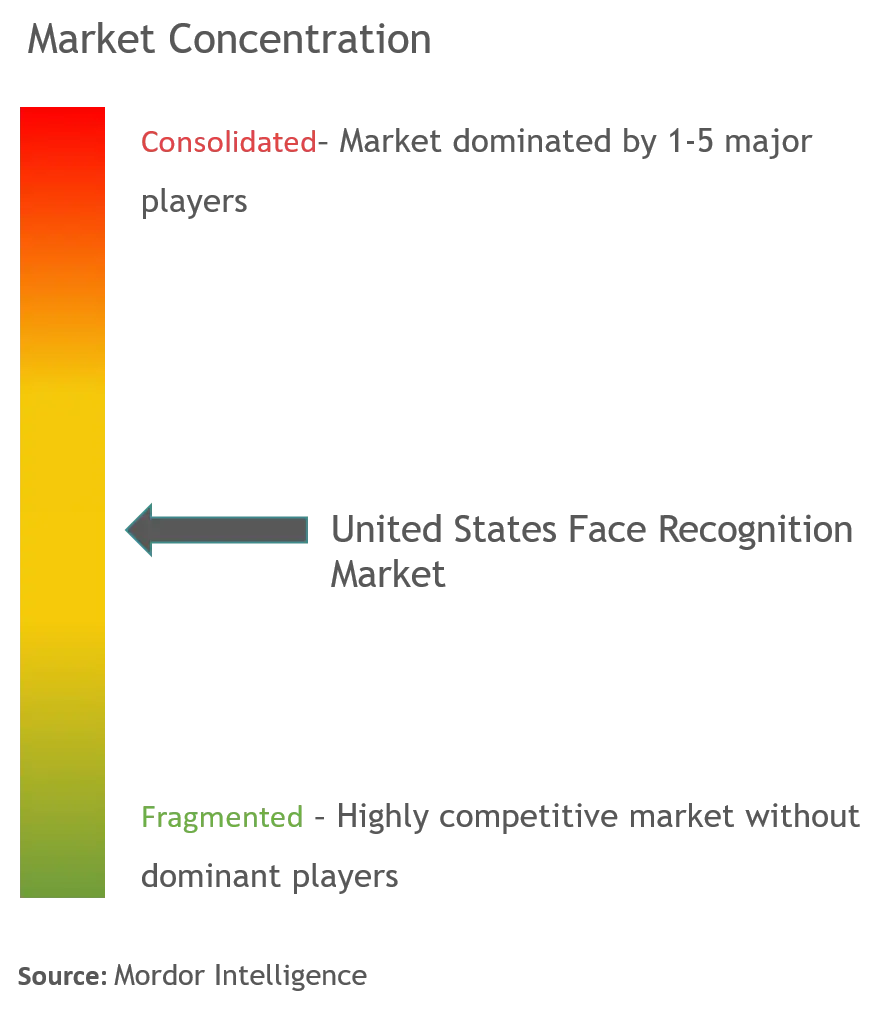
| Market Concentration | Medium |
Major Players *Disclaimer: Major Players sorted in no particular order Image © Mordor Intelligence. Reuse requires attribution under CC BY 4.0. | |
United States Facial Recognition Market Analysis by Mordor Intelligence
The US facial recognition market size is expected to grow from USD 1.75 billion in 2025 to USD 2.05 billion in 2026 and is forecast to reach USD 4.51 billion by 2031 at 17.12% CAGR over 2026-2031. Rapid roll-outs across border control, retail security, digital identity programs, and healthcare authentication are accelerating adoption. Government modernization funds, airline and port digitization, and e-commerce fraud counter-measures continue to anchor demand, while the 3D technology stack pushes accuracy and spoof-resistance higher. Retailers confronting organized crime, hospitals tackling costly patient misidentification, and financial institutions battling deepfake fraud are deploying solutions at scale. At the same time, a fragmented state privacy regime and component cost inflation raise compliance and margin pressures that favor well-capitalized suppliers able to bundle hardware, software, and managed services.
Key Report Takeaways
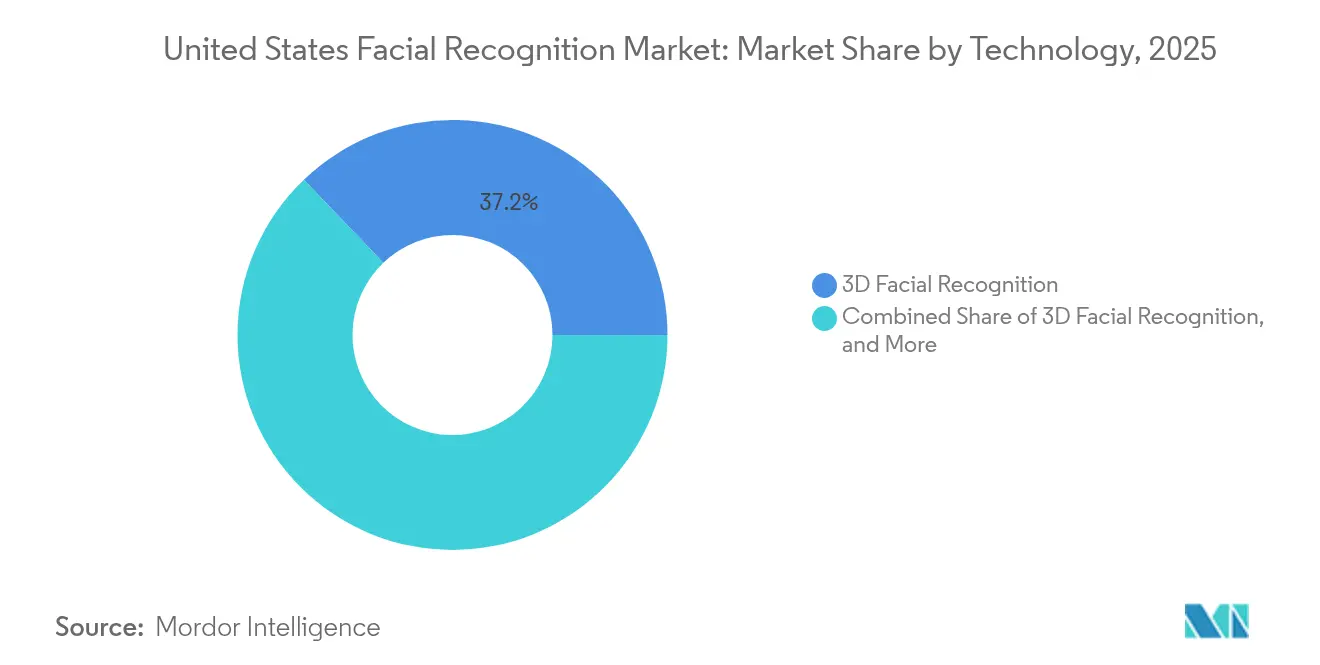
- By technology, 3D facial recognition captured 37.15% of the US facial recognition market share in 2025; facial analytics and emotion detection is forecast to expand at a 19.95% CAGR through 2031.
- By component, hardware held 41.60% of the US facial recognition market size in 2025; the services segment is projected to grow at an 18.15% CAGR between 2026-2031.
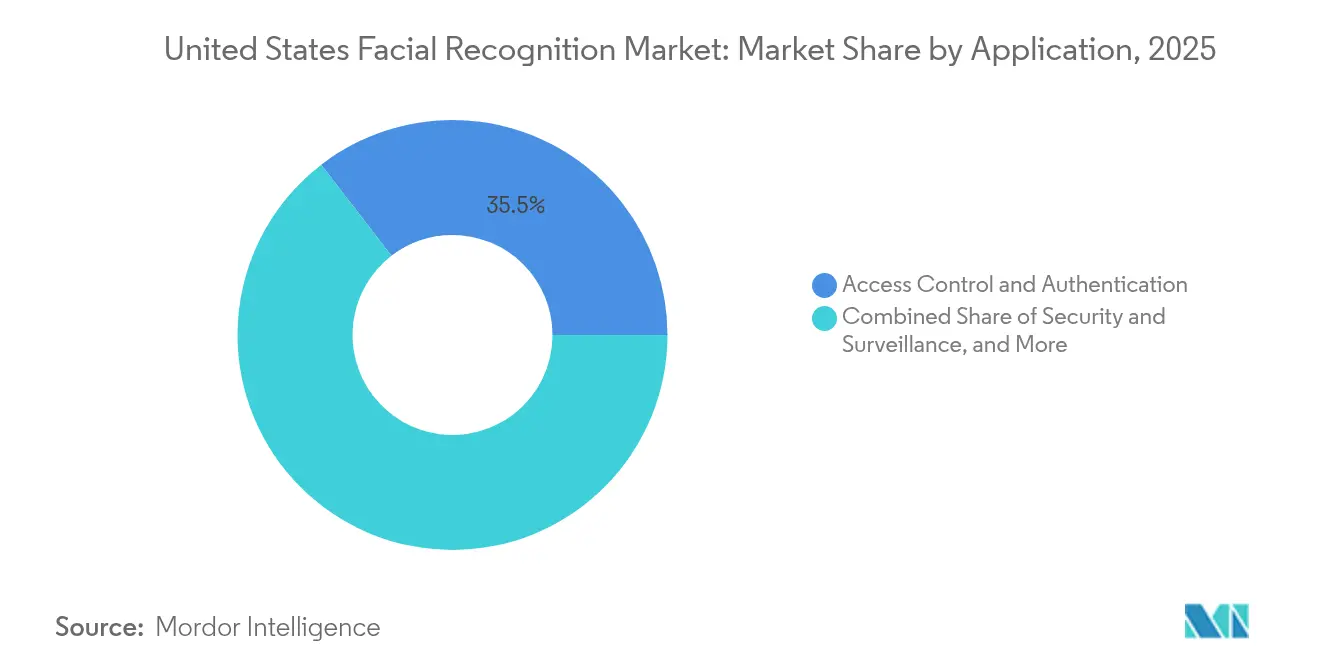
- By application, access control and authentication commanded 35.45% share of the US facial recognition market size in 2025, while security and surveillance is set to advance at a 16.65% CAGR to 2031.
- By end-user industry, government and law enforcement led with 27.90% revenue share in 2025; healthcare and life sciences is positioned to post a 18.95% CAGR through 2031.
Note: Market size and forecast figures in this report are generated using Mordor Intelligence’s proprietary estimation framework, updated with the latest available data and insights as of 2026.
Market Trends and Insights
Drivers Impact Analysis of United States Facial Recognition Market*
| Driver | (~) % Impact on CAGR Forecast | Geographic Relevance | Impact Timeline |
|---|---|---|---|
| Homeland Security modernization funds fueling AI-based border surveillance | +3.2% | National, concentrated at border states and ports | Medium term (2-4 years) |
| REAL-ID deadline driving state DMV facial capture upgrades | +2.5% | National, early adoption in tech-forward states | Short term (≤ 2 years) |
| Retail shrink & organized retail crime pushing loss-prevention deployments | +2.8% | Urban centers with high retail density | Medium term (2-4 years) |
| TSA 2026 road-map for touch-less airport checkpoints | +3.5% | Major transportation hubs | Medium term (2-4 years) |
| FinTech fraud surge & deepfake risk boosting e-KYC face verification | +3.8% | National, financial centers | Short term (≤ 2 years) |
| State-backed digital ID pilots requiring liveness detection | +2.1% | CA, NY, TX | Long term (≥ 4 years) |
| Source: Mordor Intelligence | |||
Homeland Security modernization funds fueling AI-based border surveillance
Fresh federal allocations are expanding autonomous surveillance towers and the Traveler Verification Service, which has already processed more than 300 million travelers and identified 1,800 impostors.[1]Integration with airline and cruise line systems is reshaping traveler journeys, creating a contiguous identity layer from curb to boarding gate. Vendors able to deliver cloud-native, high-accuracy platforms are positioned to win long-term service contracts as coverage extends to 79 airports and 12 seaports.
REAL-ID deadline driving state DMV facial capture upgrades
The May 2025 enforcement date is accelerating DMV investments, with only 61-66% of credentials expected to be compliant at the deadline. [2] Mobile driver’s licenses tied to liveness-verified face biometrics, already piloted by 625,000 Californians, indicate a longer-range pivot toward digital wallets. System integrators linking enrollment, credential issuance, and mobile verification stand to capture a multi-year replacement cycle.
Retail shrink & organized retail crime pushing loss-prevention deployments
Shoplifting incidents rose 24% in 2024, with losses projected to surpass USD 150 billion by 2026. Retailers are deploying real-time offender watch-lists such as SAFR Guard, while New York’s security tax credit offsets capital outlays. Cloud analytics that combine face, gait, and behavioral cues are emerging as a competitive differentiator in high-footfall stores, though privacy optics require opt-in loyalty models.
TSA 2026 road-map for touch-less airport checkpoints
USD 9.3 million in CAT-2 funding is scaling facial-matching kiosks, yet current appropriations could push full deployment to 2049 if not accelerated.[3] Suppliers offering modular upgrades and privacy-preserving inference on devices help mitigate the budget bottleneck and align with TSA’s digital ID roadmap.
Restraints Impact Analysis of United States Facial Recognition Market*
| Restraint | (~) % Impact on CAGR Forecast | Geographic Relevance | Impact Timeline |
|---|---|---|---|
| Patchwork of state biometric privacy laws escalating litigation risk | −2.7% | IL, TX, WA, other strict states | Medium term (2-4 years) |
| Municipal moratoriums on police use reducing public-sector demand | −1.9% | Progressive urban centers | Short term (≤ 2 years) |
| Algorithmic bias scrutiny triggering federal procurement delays | −2.3% | Federal agencies | Medium term (2-4 years) |
| Edge-AI chip cost inflation from US–China trade controls | −1.5% | National | Short term (≤ 2 years) |
| Source: Mordor Intelligence | |||
FinTech fraud surge & deepfake risk boosting e-KYC face verification
Deepfakes caused USD 158 billion in financial losses in 2023, with 40% of attacks aimed at banks. Liveness-assured facial verification, combined with voice or behavioral biometrics, is fast becoming the default e-KYC standard. Vendors embedding spoof-resistant AI in low-latency APIs are gaining wallet share as traditional video-ID workflows phase out.
State-backed digital ID pilots requiring liveness detection
California, New York, and Texas are piloting digital wallets that mandate liveness-verified facial enrollment. Legislative guidance is now aligning state pilots with federal interoperability, setting the stage for nationwide credential portability and annual refresh revenue for certifying providers.
*Our forecasts treat driver/restraint impacts as directional, not additive. The impact forecasts reflect baseline growth, mix effects, and variable interactions.
United States Facial Recognition Market Segment Analysis
By Technology:
3D precision widens the performance gap3D recognition accounted for 37.15% of the US facial recognition market share in 2025, underscoring its superiority in accuracy and spoof resistance. The segment’s depth mapping allows consistent matches across lighting variables and partial occlusions, making it the benchmark in border, airport, and high-security enterprise use cases. Texture-rich deep-learning algorithms are further raising accuracy; NIST tracked 1,149 algorithms from 378 developers in its latest evaluation.At the same time, facial analytics and emotion detection are the fastest-growing niche, projected at a 19.95% CAGR, as retailers and clinicians mine sentiment for merchandising and diagnostics. Thermal imaging maintains relevance for low-light installations such as critical infrastructure, while 2D remains in budget-constrained deployments.
Developers are iterating on transformer architectures that process multi-spectral inputs, shortening inference latency at edge nodes. This technical evolution reinforces a tiered pricing model that packages premium 3D or thermal hardware with subscription analytics services. Over the forecast horizon, vendors able to combine on-device privacy with cloud retraining will capture outsized cross-sell in analytics-driven verticals of the US facial recognition market.

By Component:
hardware dominance meets service-centric growthHardware secured 41.60% of the US facial recognition market size in 2025, driven by camera modules and edge AI chipsets. Yet services, covering integration, cloud APIs, and managed monitoring, are advancing at an 18.15% CAGR as buyers shift to operating-expense models. US-China trade controls are inflating chip prices and prompting buyers to evaluate domestic silicon, creating openings for fabless startups specializing in low-power vision neural processors.
Service providers are differentiating through rapid deployment toolkits, zero-trust data governance, and outcome-based service-level guarantees. Their recurring revenue stabilizes margins, offsetting hardware cyclicality. This blended delivery strategy underscores a broader movement toward end-to-end stacks that lock in lifetime value across the US facial recognition market.
By Application:
authentication scale leads, surveillance momentum buildsAccess control and authentication represented 35.45% of the US facial recognition market size in 2025, reflecting embedded sensors in mobile devices and corporate entry systems. Security and surveillance is primed for the quickest advance at 16.65% CAGR, propelled by organized retail crime counter-measures and smart-city programs. Compliance mandates in finance and healthcare push e-KYC and patient ID workflows into mainstream adoption, with liveness detection now table stakes.
Vendors integrating multimodal biometrics and contextual analytics drive higher conversion in unattended scenarios. Emotion recognition pilots in telehealth and customer experience illustrate the breadth of emerging use cases. Together, these vectors reinforce the widening footprint of facial recognition across enterprise applications in the US facial recognition market.
By End-user Industry:
public sector scale, healthcare breakoutGovernment and law enforcement commanded 27.90% of 2025 revenue, anchored by border, aviation, and DMV deployments. Healthcare is forecast as the fastest-rising customer group, expanding at a 18.95% CAGR as hospitals combat the 24% patient misidentification rate. Retail chains, airports, and financial institutions round out demand, each seeking frictionless yet auditable identity frameworks.
Hospital systems integrating facial biometrics with electronic health records report lower duplicate charts and streamlined patient check-in, driving strong return on investment. Meanwhile, transportation hubs endorse touchless passenger flows as competitive differentiators. Such sector-specific imperatives sustain broad-based momentum throughout the US facial recognition market.
Geography Analysis
California, New York, and Texas form the core triad of high-adoption states, each blending tech ecosystems with large consumer bases. California’s mobile driver’s license pilot, executed through Apple Wallet, signals institutional readiness for biometric wallets at scale and sets a regulatory benchmark other states are likely to follow. The Northeast corridor adds a potent mix of federal procurement and Wall Street e-KYC demand, although algorithmic bias reviews are lengthening agency procurement cycles.
Southern border states are intensifying deployments in land ports and airports, urged by Customs and Border Protection’s expansion of Simplified Arrival facial matching. Retail corridors in Florida and Texas equally invest in loss-prevention analytics, even as state privacy statutes introduce nuanced compliance clauses. The Midwest lags on account of more conservative privacy sentiment but shows upside as digital ID pilots mature.
Across all regions, municipal moratoriums introduce a checkerboard of permissible uses, compelling vendors to design geo-fenced feature toggles. Such configurability is fast becoming a pre-requisite for scalable roll-outs, reinforcing the premium on vendors with agile compliance engineering inside the US facial recognition market.
Regulatory Landscape
The United States continues to operate under a fragmented facial recognition policy environment, with no single comprehensive federal law governing facial recognition across all sectors as of July 2026. Federal use is shaped by agency-level guardrails and procurement requirements, alongside technical and identity assurance guidance such as NIST programs (including FRVT benchmarking) and NIST Digital Identity Guidelines (SP 800-63), while oversight pressure has been reinforced by public-sector reviews such as the U.S. Commission on Civil Rights 2024 report on federal facial recognition use.
Congressional activity remains active rather than settled, with proposals such as H.R. 4695 (Facial Recognition Act of 2025) and H.R. 7363 (2026) illustrating ongoing attempts to standardize transparency, limits, and accountability for federal deployments. In parallel, performance scrutiny continues to concentrate on demographic differential accuracy and disclosure practices, which elevates the importance of vendor testing results, documentation, and auditability in government and regulated-industry procurements.
Value Chain Analysis
The value chain spans sensor and edge-compute hardware (cameras, depth/3D modules, and edge AI chipsets), core algorithms and model development (matching, liveness detection, and quality assessment), and platform layers delivered through on-premise systems and government-approved cloud environments. NIST benchmarking (FRVT) and identity assurance guidance influence product validation and procurement checklists, while public-safety and federal workflows commonly require interoperability with established biometric transaction formats and processes such as FBI-aligned EBTS-style exchanges.
Downstream, system integrators and managed service providers connect facial recognition to access control, border and aviation identity layers, e-KYC onboarding, and healthcare patient identity systems, with deployments often bundled into multi-year support and maintenance. In the public sector, procurement frequently runs through enterprise-wide licensing and maintenance arrangements and may include sole-source pathways for continuity and certification reasons, concentrating advantage among suppliers that can provide an end-to-end stack (hardware, software, integration, and compliance engineering) and sustain long lifecycle support.
Competitive Landscape
The supplier field spans major cloud platforms, dedicated biometric specialists, and niche AI hardware startups. Consolidation accelerated when BigBear.ai acquired Pangiam, adding advanced vision analytics to a defense-focused portfolio. Amadeus’s purchase of Vision-Box and Entrust’s acquisition of Onfido further illustrate the trend toward integrated identity stacks that cover enrollment through real-time verification.
Product differentiation now revolves around liveness accuracy, privacy-preserving architectures, and modular deployment models that lower integration friction. Clear Secure operates at 58 airports and logged 235 million platform uses by December 2024, validating subscription throughput economics. In parallel, chip suppliers compete on TOPS-per-watt metrics that reduce edge-node thermal envelopes. Startups with diverse training datasets and transparent model cards target enterprise buyers wary of algorithmic bias litigation.
United States Facial Recognition Industry Leaders
-
Amazon Web Services (Rekognition)
-
Microsoft Corp. (Azure Face)
-
NEC Corporation
-
Thales Group (Idemia)
-
Clearview AI Inc.
- *Disclaimer: Major Players sorted in no particular order
United States Facial Recognition Market Companies Covered in this Report
- Amazon Web Services (Rekognition)
- Microsoft Corp. (Azure Face)
- NEC Corporation
- Thales Group (Idemia)
- Clearview AI Inc.
- Cognitec Systems GmbH
- Aware Inc.
- FaceFirst Inc.
- Panasonic Connect North America
- Google Cloud Vision
- Apple Inc. (FaceID Ecosystem)
- Meta Platforms (DeepFace Research)
- Veritone Inc.
- Daon Inc.
- BioID GmbH
- AnyVision (Oosto)
- Intel (RealSense)
- Snap Inc. (Cameos and AR Lenses)
- Rank One Computing
- Onfido
Market Opportunities and Future Outlook
Airports, border workflows, and digital identity initiatives continue to create whitespace for integrated, privacy-aware facial recognition stacks that combine liveness, matching, and audit controls across channels. Programs and platforms such as CBP traveler verification deployments, TSA touchless checkpoint modernization, and state digital ID pilots in California, New York, and Texas have pulled vendors toward modular architectures that can operate in constrained budgets and still meet disclosure and performance scrutiny; these conditions favor suppliers that can offer device-side inference options, configurable retention policies, and documented performance claims aligned with NIST evaluation culture.
Two nearer-term opportunity areas are visible from current adoption patterns and policy direction. First, agency modernization and mobile field use cases have accelerated demand for portable capture and matching workflows (for example, ICE Mobile Fortify using NEC NeoFace), expanding requirements for ruggedized capture, fast matching, and governance-ready logging. Second, enterprises facing fraud and compliance pressure are standardizing on liveness-assured e-KYC and authentication, which increases demand for low-latency APIs, multimodal checks, and secure cloud routing options in environments such as Microsoft Azure Government; vendors that can translate changing policy and documentation requirements into deployable controls can shorten procurement cycles in both government and regulated industries.
Recent Industry Developments in United States Facial Recognition Market
- March 2026: NEC Corporation - Western Identification Network (WIN) upgrade to Integra-ID 7 biometric workstation for law enforcement identification
- February 2026: Immigration and Customs Enforcement (ICE) utilizes NEC NeoFace facial recognition technology via the Mobile Fortify application
- September 2024: Department of Homeland Security Office of Biometric Identity Management (OBIM) signaled intent to procure NEC face biometrics software licenses to support the Homeland Advanced Recognition Technology transition
United States Facial Recognition Market Report Scope and Research Methodology
Market Definition and Coverage
This market covers revenues generated in the United States from facial recognition solutions used to detect, match, or verify a person based on facial images or video, including supporting software, hardware, and related implementation services used in real deployments.
Scope exclusions: We exclude general video surveillance equipment that does not run facial recognition, and we exclude broader biometric modalities like fingerprint or iris unless bundled and priced as part of a facial recognition offer.
Segments Covered in This Report
- By Technology
- 2D Facial Recognition
- 3D Facial Recognition
- Thermal/Infra-red Facial Recognition
- Facial Analytics and Emotion Detection
- By Component
- Hardware (Cameras, Edge AI Chipsets)
- Software/Algorithms
- Services (Integration, Managed, Cloud API)
- By Application
- Access Control and Authentication
- Security and Surveillance
- Identity Verification / e-KYC
- Attendance and Workforce Management
- Emotion Recognition and Customer Insights
- By End-user Industry
- Government and Law Enforcement
- Transportation (Airports, Ports, Public Transit)
- BFSI
- Healthcare and Life Sciences
- Retail and E-commerce
- Travel and Hospitality
- Automotive and Smart Mobility
- Education
- Energy and Utilities
Data Sources, Market Sizing, and Validation
Desk Research
Desk research was used to lock the market boundary and build the first set of demand signals that can be checked year over year. We relied on public sources such as NIST Face Recognition Vendor Test (FRVT) publications, U.S. Census Bureau establishment data for key end markets, Bureau of Economic Analysis digital economy series for spending context, and Federal Register updates that help interpret rule changes that can speed up or slow down deployments.
We also reviewed company filings, earnings call notes, investor presentations, and reputable press coverage to understand how facial recognition is packaged and priced (license, subscription, or service), and where budgets are actually being allocated. To reduce blind spots, we cross-checked public narratives with paid subscriptions focused on company financials and intelligence, news and financials, and patent databases, mainly to confirm product activity and commercialization timing. These examples are not exhaustive, and many other sources were used for data collection, validation, and research clarification.
Primary Interviews and Surveys
Primary work centered on interviews and structured surveys with solution providers, system integrators, and buyers who manage identity, security, or customer verification programs. This helped us verify what is actually being deployed versus what is only piloted. We also discussed pricing behavior, renewal patterns, and attach rates for implementation services so the value model reflects real contract behavior, not just installed base assumptions.
Distribution of primary research fieldwork respondents
| Company type | Respondent position |
|---|---|
| Top tier: 32% | CXOs: 12% |
| Mid tier: 52% | Functional/Unit leaders: 37% |
| Smaller Players: 16% | Managers: 51% |
Market-Sizing & Forecasting
Sizing starts with a top-down build where U.S. demand is reconstructed from adoption by key use cases, followed by applying realistic price points that buyers reported paying. What matters most for facial recognition is the mix between one-to-one verification and one-to-many identification, the share of cloud API versus on-prem deployments, and the pacing of public sector programs, since these drivers change how spend shows up across software, hardware, and services.
We then corroborate totals using selective bottom-up checks, such as supplier revenue exposure to U.S. facial recognition, sampled contract values observed through public awards, and simple volume by ASP logic for camera or edge inference upgrades where relevant. Typical inputs used in the model include NIST FRVT performance trend signals (which influence procurement willingness), device and camera refresh cycles in security environments, digital identity and KYC onboarding volumes in regulated industries, and the share of projects moving from pilot to scaled rollouts. For forecasting, scenario analysis was used so adoption paths can be flexed based on policy shifts and buyer risk tolerance, and assumptions were validated with primary respondents before finalizing growth curves. When a bottom-up check is incomplete for smaller suppliers, we apply conservative gap fills using peer averages by offering type and then re-test the implied totals against buyer-side spend expectations.
Data Validation & Update Cycle
Validation is done through multiple passes, where model outputs are compared against independent signals like procurement activity, reported revenue mixes, and the observable shift from legacy access control toward identity-led authentication. If an estimate creates an unusual jump in ASP, adoption, or service attachment, we re-check the driver assumptions and, when needed, re-contact sources to confirm whether the change is real or a data artifact.
Before sign-off, the work is reviewed by another analyst to confirm that the scope boundary stayed consistent and that currency and timing choices did not distort year-on-year comparisons. Reports are refreshed annually, and interim updates are triggered when there are material events such as major regulatory actions, meaningful changes in procurement patterns, or sharp pricing shifts. Right before delivery, a final pass is completed so clients receive the latest updated view.
Mordor Intelligence's United States Facial Recognition Market Size Compared With Other Published Estimates
Published market sizes for U.S. facial recognition often differ because the underlying timing and pricing logic is not handled the same way, even when the topic name looks identical. Differences in base year choice, whether the estimate is built around contract value versus recognized revenue, and how multi-year subscriptions are annualized can all shift the headline number.
A practical gap driver is how frequently assumptions get refreshed for ASP progression, cloud versus on-prem mix, and the rate at which pilots convert into scaled deployments, since these move quickly in this market. Currency timing also matters when suppliers report in different fiscal calendars, and validation depth can vary when public evidence is limited for smaller contracts. In our workflow, the cadence of refreshing ASP and deployment-mix assumptions, followed by re-checking them against buyer feedback, is what keeps the published figure current, a discipline applied by Mordor Intelligence.
Benchmark comparison
| Source | Market Size | Gaps in Research Methodology |
|---|---|---|
| Mordor Intelligence | USD 1.75 B (2025) | |
| Trade Press Release A | USD 1.45 B (2023) | Uses an earlier base year and typically reflects a different revenue timing approach, where multi-year deals and subscription ramps can be treated differently, which can understate later-year ASP changes and cloud mix shifts. |
| Regional Consultancy B | USD 1.69 B (2024) | Uses a broader regional boundary (North America) and may include cross-border demand and offering scope that is not strictly U.S.-only, which can lift totals depending on how deployments and services are attributed. |
The spread across sources mainly comes from timing choices, geography boundaries, and how pricing is rolled forward as deployments shift toward subscription models. By keeping the scope tightly U.S.-specific and by repeatedly re-validating price and mix assumptions against field inputs, the resulting number stays traceable to clear demand drivers and repeatable checks.
Key Questions Answered in the Report
What is the projected growth of the US facial recognition market through 2031?
The US facial recognition market is forecast to grow from USD 2.05 billion in 2026 to USD 4.51 billion by 2031 at a 17.12% CAGR.
Which technology segment currently holds the largest share?
3D facial recognition leads with 37.15% of market share on account of its superior accuracy and anti-spoofing performance.
Why is healthcare the fastest-growing end-user industry?
Hospitals are adopting biometric patient ID systems to curb misidentification, driving a 18.95% CAGR for healthcare deployments.
How do state privacy laws affect vendors?
Strict statutes such as Illinois’s BIPA increase litigation exposure, trimming the market CAGR by an estimated 2.7 percentage points.
What is driving demand in security and surveillance applications?
Rising organized retail crime and airport modernization plans are propelling surveillance deployments at a 16.65% CAGR.
How will chip export policy shifts influence component costs?
Easing export restrictions like the US–UAE chip deal improves supply, while ongoing US–China trade controls may keep edge-AI chip prices elevated.