
Market Overview
| Study Period | 2021 - 2031 |
|---|---|
| Forecast Data Period | 2026 - 2031 |
| Base Year Market Size (2025) | USD 278.58 Million |
| Market Size (2026) | USD 301.92 Million |
| Market Size (2031) | USD 451.33 Million |
| Growth Rate (2026 - 2031) | 8.38 % |
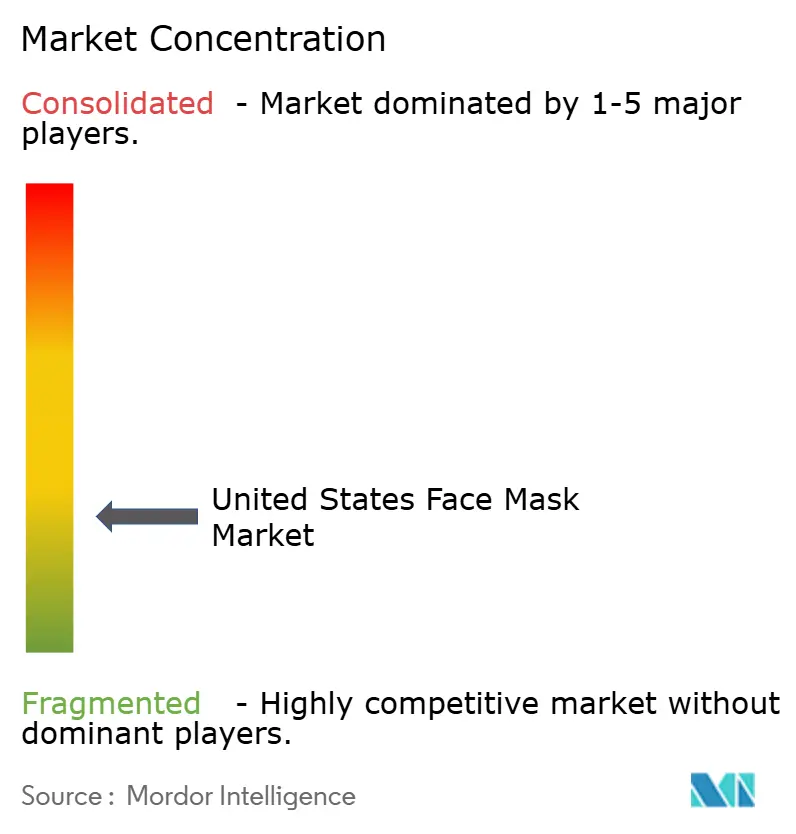
| Market Concentration | Low |
Major Players *Disclaimer: Major Players sorted in no particular order Image © Mordor Intelligence. Reuse requires attribution under CC BY 4.0. | |
US Face Mask Market Analysis by Mordor Intelligence
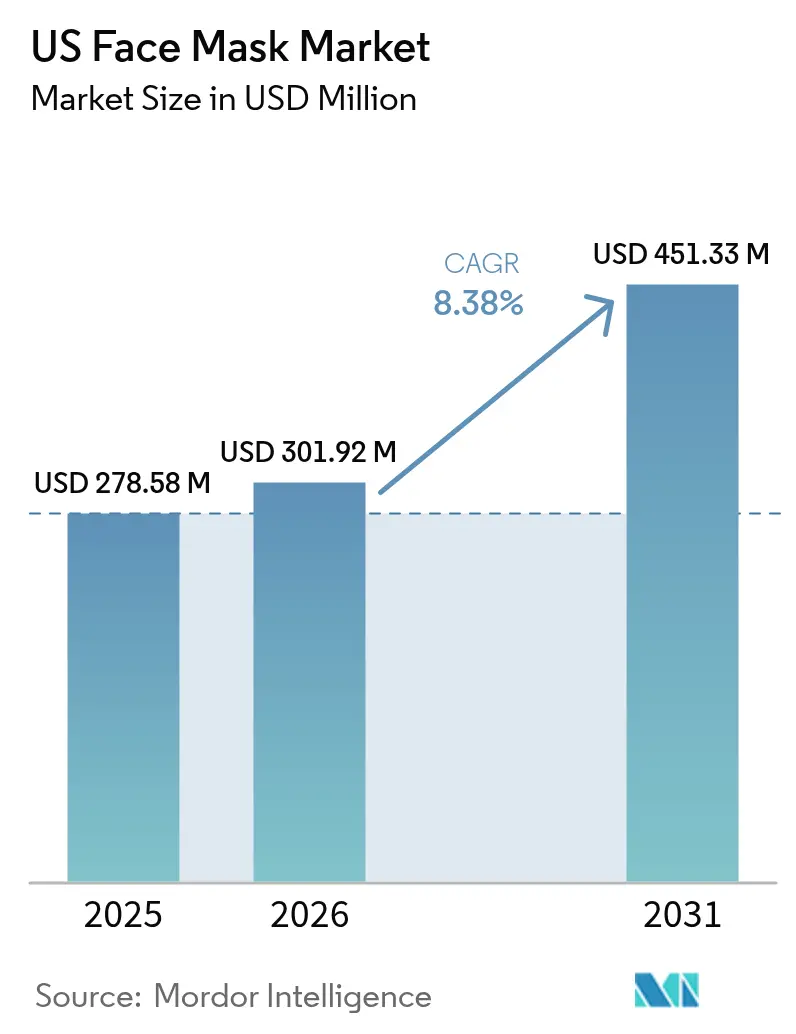
The US face mask market size is expected to grow from USD 278.58 million in 2025 to USD 301.92 million in 2026 and is forecast to reach USD 451.33 million by 2031 at 8.38% CAGR over 2026-2031. The market expansion is driven by increased retail availability of diverse face mask products and the growing influence of Asian skincare culture in the United States. Social media platforms have emerged as effective marketing channels for face mask manufacturers, enhancing product visibility and consumer engagement. Consumer behavior analysis indicates that users who have incorporated face masks into their skincare routines during recent years intend to maintain these practices, suggesting a sustainable demand pattern. This market evolution reflects the convergence of technological advancement and environmental awareness in product development and distribution strategies. With increasing consumer awareness about skincare benefits and the continuous innovation in product formulations, the US face mask market is positioned for sustained growth in the coming years.
Key Report Takeaways
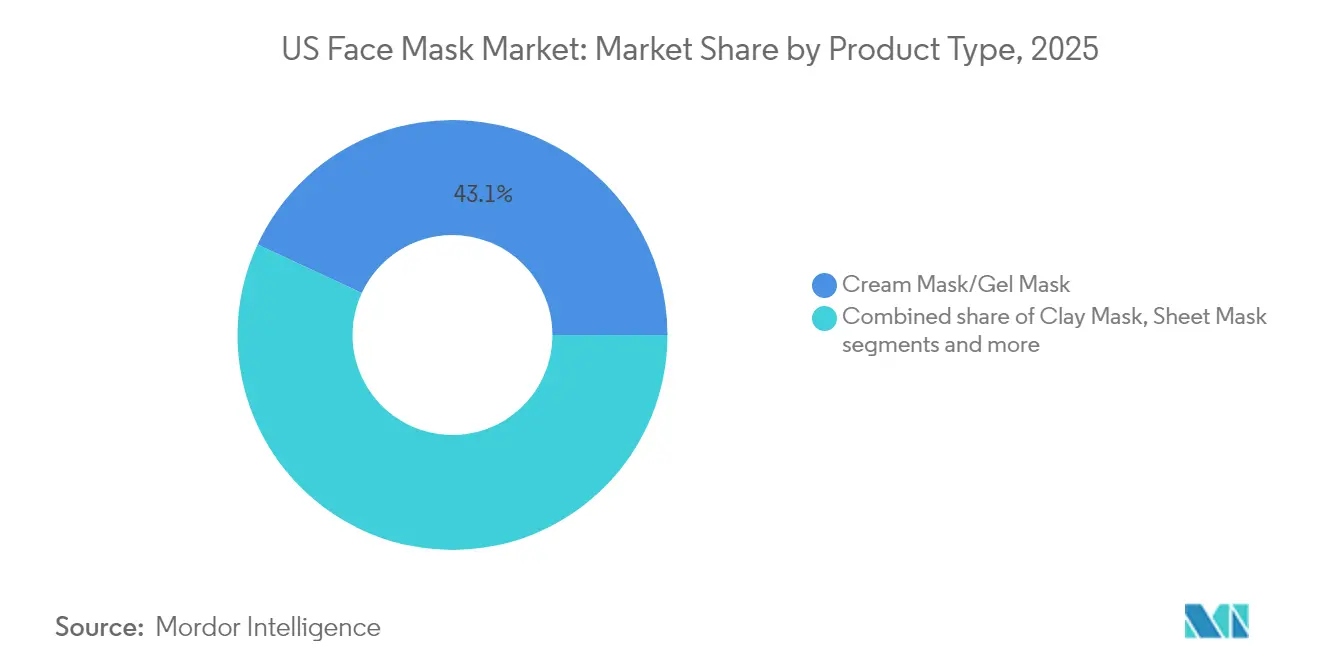
- By product type, cream/gel masks led with 43.08% of the US face mask market share in 2025, whereas clay masks are on track to expand at an 8.69% CAGR through 2031.
- By end user, women retained 57.32% of the market size in 2025, yet men are forecast to grow at a 9.11% CAGR on rising grooming adoption.
- By ingredient, conventional formulations commanded 67.21% of the US face mask market size in 2025; natural and organic variants record the fastest 9.47% CAGR through 2031.
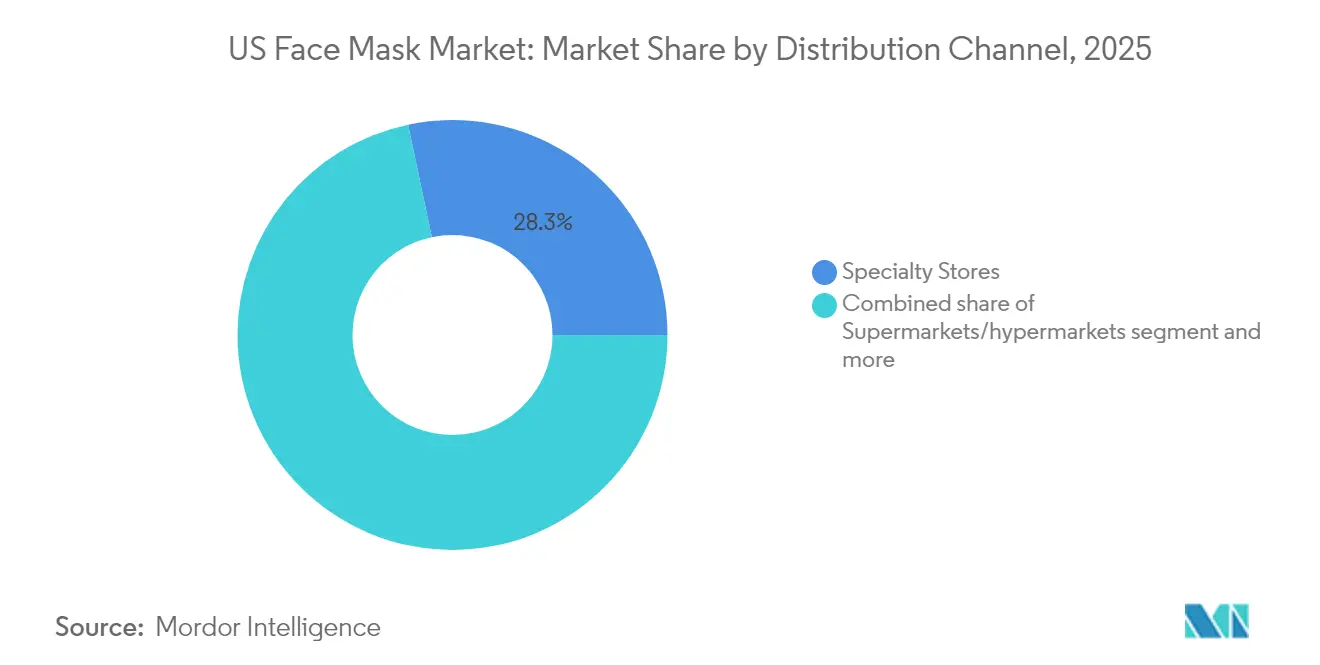
- By distribution channel, specialty stores captured 28.31% of the market share in 2025, while online retail is advancing at a 9.72% CAGR to 2031.
- By region, the South held 37.22% revenue share in 2025, whereas the Northeast is projected to log a 10.12% CAGR through 2031.
Note: Market size and forecast figures in this report are generated using Mordor Intelligence’s proprietary estimation framework, updated with the latest available data and insights as of 2026.
US Face Mask Market Trends and Insights
Drivers Impact Analysis*
| Driver | (~) % Impact on CAGR Forecast | Geographic Relevance | Impact Timeline |
|---|---|---|---|
| Technological innovations in ingredient and functionality | +2.1% | Global, with concentration in urban centers | Medium term (2-4 years) |
| Increased air pollution and environmental concerns | +1.8% | Northeast, West Coast metropolitan areas | Long term (≥ 4 years) |
| Rising consumer spending on skincare products | +1.5% | South, West regions with higher disposable income | Short term (≤ 2 years) |
| Influence of social media and celebrity endorsements | +1.3% | National, with early gains in the Northeast and West | Short term (≤ 2 years) |
| Surge in men’s skincare adoption | +1.0% | National, accelerated in urban markets | Medium term (2-4 years) |
| Demand for natural, organic, and clean facial care | +0.8% | Northeast, West Coast, educated demographics | Long term (≥ 4 years) |
| Source: Mordor Intelligence | |||
Technological Innovations in Terms of Ingredient and Functionality
Technological advancements in ingredient formulations and functionality drive the US face mask market growth. Manufacturers incorporate innovative ingredients such as hyaluronic acid, peptides, and natural botanicals while developing smart masks with targeted delivery systems. The integration of biotechnology enables masks with enhanced penetration capabilities and time-release properties. Additionally, personalized face masks utilizing artificial intelligence and skin diagnostic tools allow consumers to address specific skincare concerns effectively. For instance, in December 2024, CosRx launched two new face masks - the Advanced Snail Mucin Glass Glow Hydrogel Mask and Peptide Collagen Hydrogel Eye Patch for Youthful Glow, demonstrating the market's continuous innovation in ingredient formulations.
Increased Air Pollution and Environmental Concerns
Environmental degradation in the United States has transformed face masks from luxury beauty products into essential preventive healthcare tools. The increasing air pollution levels in major US cities, combined with environmental challenges such as wildfires and dust storms, have prompted residents to use face masks during outdoor activities and daily commutes. This shift in consumer behavior stems from growing awareness of airborne pollutants and their health impacts, effectively expanding the addressable market beyond traditional cosmetics consumers. According to the American Lung Association's State of the Air 2025 report, 156.1 million Americans, 46% of the population, live in areas with failing grades for unhealthy levels of ozone or particle pollution [1]Source: American Lung Association, “State of the Air 2025 Key Findings,” lung.org. These environmental factors continue to drive the growth of the US face mask market as consumers prioritize skin health and protection against air pollution.
Rising Consumer Spending on Skincare Products
Consumer spending on skincare and facial care products in the United States has increased significantly, driven by continuous product innovation and new launches in the market. The broader beauty industry's resilience during economic uncertainty and consumers' prioritization of self-care investments have contributed to increased discretionary spending on skincare products. American consumers demonstrate growing consciousness about skin health and show a willingness to invest in premium skincare solutions, including face masks. According to Advanced Dermatology's 2024 survey, Americans spend an average of USD 897 per year on their appearance [2]Source: Advanced Dermatology, “America’s Beauty Budgets,” advdermatology.com. The rise in disposable income, combined with the growing influence of social media and beauty influencers, has encouraged consumers to experiment with various face mask products, although economic headwinds may influence value-conscious purchasing decisions in the near term.
Surge in Men's Skincare Adoption
Male consumers in the United States are driving significant growth in the face mask market through increased adoption of skincare products. The normalization of male grooming practices beyond basic cleansing and moisturizing, coupled with reduced social stigma around appearance-focused self-care, has expanded the market potential. According to Advanced Dermatology's 2024 survey, American men spend an average of USD 728 per year on their appearance. This trend is further supported by many brands introducing male-specific face mask products and implementing targeted marketing campaigns. The combination of growing skincare awareness among men, particularly in urban areas, and rising disposable income continues to drive the expansion of the face mask market in the United States.
Restraints Impact Analysis*
| Restraint | (~) % Impact on CAGR Forecast | Geographic Relevance | Impact Timeline |
|---|---|---|---|
| Health concerns over chemical ingredients | -1.2% | National, concentrated in educated demographics | Medium term (2-4 years) |
| Alternative and traditional skincare methods | -0.8% | Rural areas, older demographics | Long term (≥ 4 years) |
| Skin sensitivity and allergic reactions | -0.6% | National, particularly sensitive skin populations | Short term (≤ 2 years) |
| Supply chain and raw material constraints | -0.5% | Global impact, regional manufacturing dependencies | Medium term (2-4 years) |
| Source: Mordor Intelligence | |||
Health Concerns Over Chemical Ingredients
Consumer awareness regarding potentially harmful chemicals in face masks, such as synthetic fragrances, parabens, and artificial dyes, has become a significant market restraint. The presence of chemical preservatives, phthalates, formaldehyde-releasing preservatives, and synthetic colors has raised concerns among regulatory bodies and consumer advocacy groups due to their association with skin irritation and allergic reactions. This heightened awareness, coupled with the implementation of the Modernization of Cosmetics Regulation Act (MoCRA), which expanded FDA authority over cosmetics safety and labeling requirements, has created regulatory challenges for manufacturers [3]Source: US Food and Drug Administration, “Small Businesses & Homemade Cosmetics,” fda.gov . The shift in consumer preference towards clean beauty and natural ingredients has compelled manufacturers to reformulate their products, resulting in higher production costs and potentially lower profit margins.
Alternative and Traditional Skincare Methods
The prevalence of traditional and alternative skincare methods presents a significant restraint to the United States face mask market. Many consumers opt for natural remedies, including homemade masks using ingredients like honey, turmeric, and yogurt, which they perceive as cost-effective and chemical-free alternatives. Traditional skincare practices passed down through generations, combined with the growing DIY beauty trend and professional spa treatments offering personalized solutions, influence consumers to create their own face mask formulations. This trend strengthens during economic uncertainty when consumers actively seek cost-effective alternatives to commercial products. The increasing consumer awareness about natural ingredients and the availability of these alternatives may impact the market growth of commercial face mask products, particularly in the premium segment.
*Our forecasts treat driver/restraint impacts as directional, not additive. The impact forecasts reflect baseline growth, mix effects, and variable interactions.
Segment Analysis
By Product Type: Clay Masks Drive Innovation Despite Cream Dominance
The face mask market demonstrates distinct segment dynamics, with cream and gel masks commanding a dominant 43.08% share in 2025, primarily due to their universal appeal in providing hydration and nourishment across diverse skin types. While these traditional formats maintain their leadership position, clay masks are emerging as the fastest-growing segment with an 8.69% CAGR through 2031, driven by increasing urban pollution concerns and consumer demand for deep-cleansing solutions. Sheet masks and peel-off variants occupy specific market niches, with the former facing environmental scrutiny despite social media popularity, and the latter serving consumers seeking visible transformation effects.
The market evolution reflects a shift from basic moisturizing treatments toward targeted solutions addressing specific skin concerns. Clay masks leverage their natural positioning to align with clean beauty preferences, while cream and gel formats are adapting through sustainable packaging initiatives and cleaner formulations to maintain their market dominance. This adaptation indicates the industry's response to changing consumer preferences and environmental considerations.


By End User: Men's Adoption Accelerates Gender Convergence
The gender segmentation reveals a significant transformation in skincare consumption patterns. While women maintain a dominant 57.32% market share in 2025, men's adoption is growing rapidly at a 9.11% CAGR through 2031, approaching overall market growth rates. This convergence reflects the normalization of male grooming practices beyond traditional boundaries, driven by social media influence, celebrity endorsements, and evolving masculine identity concepts that embrace self-care and appearance maintenance.
The male segment shows strong growth particularly in urban markets, where professional environments and cultural attitudes support expanded grooming routines, especially in the Northeast and West Coast regions with higher education levels and disposable incomes. Male consumers demonstrate distinct preferences from traditional female-focused products, necessitating targeted formulations that address specific skin concerns including larger pores, increased oil production, and coarser skin texture.
By Ingredient: Natural Formulations Gain Momentum
Conventional ingredients maintain a commanding 67.21% market share in 2025, while natural and organic formulations grow at 9.47% CAGR through 2031, driven by Millennials and Generation Z's preference for products emphasizing safety, ethicality, and sustainability. This shift toward cleaner beauty solutions and ingredient transparency presents both opportunities and challenges for manufacturers.
Natural formulations face technical hurdles in ingredient stability, preservation, and efficacy, requiring advanced expertise and higher development costs. This has led to the emergence of hybrid approaches that strategically combine natural actives with proven synthetic ingredients to balance performance requirements with clean beauty positioning.
By Distribution Channel: Digital Commerce Reshapes Retail
Specialty stores dominate the face mask distribution landscape with a 28.31% market share in 2025, leveraging their ability to provide expert consultation and product trial opportunities for premium purchases. While supermarkets/hypermarkets cater to price-conscious consumers seeking convenience, online retail exhibits the strongest growth trajectory at 9.72% CAGR through 2031, driven by increasing e-commerce adoption.
The ongoing digital transformation enables direct-to-consumer strategies that enhance profit margins while offering detailed product information and customer reviews as alternatives to in-store consultation. This shift has prompted the emergence of diverse distribution channels, including subscription services and social commerce platforms, necessitating omnichannel strategies that seamlessly integrate online and offline touchpoints to optimize market reach and maintain a consistent brand experience.
Geography Analysis
The South region dominates the US face mask market with a 37.22% share in 2025, supported by higher disposable incomes and cultural emphasis on appearance maintenance. The region's leadership stems from established beauty retail infrastructure, warm climate conditions, and cultural attitudes that normalize premium beauty product consumption. Major metropolitan areas like Atlanta, Miami, and Dallas function as beauty trend incubators and distribution hubs. However, the region's growth rate lags behind the national average, indicating market maturity and potential saturation.
The Northeast region exhibits the highest growth trajectory with a 10.12% CAGR through 2031, driven by urban density, higher education levels, and environmental consciousness. Key metropolitan areas, including New York, Boston, and Philadelphia, concentrate affluent consumers who demonstrate sophisticated beauty preferences and a willingness to invest in premium formulations. This growth outpaces the national average, reflecting the region's strong adoption of pollution protection skincare and clean beauty products.
The West and Midwest regions display distinct market characteristics that shape their moderate growth patterns. The West Coast, particularly California and Washington state, influences national product development through its focus on clean beauty and sustainability trends. In contrast, Midwest consumers emphasize practical benefits and value-oriented purchasing over premium positioning. These regional variations necessitate market-specific strategies that align with local economic conditions and cultural attitudes toward beauty investments.
Regulatory Landscape
In the United States, face masks intended for a medical purpose (for example, preventing disease transmission) fall under FDA medical device oversight, while non-medical consumer masks do not require FDA clearance or registration and instead follow general consumer-product and import requirements. For medical-purpose products, the FDA has long differentiated device pathways and performance expectations for categories such as surgical N95 respirators and certain public health emergency filtering facepiece respirators under applicable device classifications, while CDC guidance continues to shape consumer masking practices for respiratory-virus prevention.
In 2026, several federal actions affected compliance and landed-cost calculations for mask supply. The USTR increased Section 301 tariffs to 50% on China-origin surgical and non-surgical respirators and face masks (January 2026), and U.S. Customs and Border Protection applied a temporary 10% ad valorem import surcharge (Section 122 duties) from February 24, 2026 through July 24, 2026, both of which raised import costs for affected SKUs. Separately, HHS determined in June 2026 that circumstances no longer justified emergency use authorization (EUA) for certain medical devices, with EUA declarations for medical devices set to terminate effective December 26, 2026, shifting medical-mask sellers back toward standard FDA premarket and quality expectations where applicable.
Value Chain Analysis
The US face mask value chain covers raw material sourcing (including filtration and nonwoven substrates), formulation inputs for cosmetic masks (actives such as humectants and botanicals), conversion and finishing (sheet converting, molding/filling for creams and clays, packaging), then quality and claims substantiation before commercialization. For masks sold into medical and institutional channels, regulatory and performance requirements affect upstream supplier qualification and downstream distribution, including integration with hospital and group purchasing organization (GPO) supply chains where documented quality systems and lot-level traceability are emphasized.
Supply is also influenced by imports for many mask categories, with domestic manufacturing competing against lower-cost foreign supply while managing reliance on imported inputs and higher operating costs. Notable domestic capacity additions include U.S. Medical Glove Company’s May 2025 launch of a 3-ply disposable face mask production unit in Harvard, Illinois, with baseline capacity of 75 million masks per year, reflecting efforts to localize production and shorten lead times. On the logistics side, the FAST PASS Act passed by Congress in December 2024 aimed to expedite movement of critical medical supplies including PPE through US ports during public health emergencies, while the 2026 import-duty actions and the shift in FDA-HHS posture on EUAs added planning considerations for procurement and inventory strategies.
Competitive Landscape
The US face mask market demonstrates significant fragmentation, creating opportunities for both established beauty conglomerates and emerging direct-to-consumer brands. This fragmentation stems from diverse consumer preferences across product types, price points, and ingredient philosophies, preventing any single player from achieving dominant market control. While established companies like L'Oréal, Unilever, and Estée Lauder maintain their market presence through extensive distribution networks and research capabilities, emerging brands successfully compete by utilizing digital commerce channels and clean beauty positioning.
Companies in the face mask market are increasing their investments in technology-driven innovation, sustainability initiatives, and direct-to-consumer capabilities. These strategies help bypass traditional retail intermediaries while improving profit margins and customer relationships. The market also witnesses strategic acquisitions aimed at accessing emerging technologies, expanding product portfolios, and incorporating digital-native brands that appeal to younger demographics through strong social media presence.
The face mask market presents significant growth potential in specialized segments, particularly in men's skincare, pollution protection formulations, and biodegradable packaging solutions. These opportunities address evolving consumer needs and environmental concerns while maintaining product efficacy and convenience.
US Face Mask Industry Leaders
L'Oréal SA
Procter & Gamble Company
The Estée Lauder Companies Inc.
Unilever Plc
Kenvue Inc.
- *Disclaimer: Major Players sorted in no particular order

Market Opportunities and Future Outlook
The US face mask market opportunity centers on differentiated product positioning supported by verifiable performance and safety documentation, particularly as consumers and institutional buyers scrutinize ingredient transparency and claims. Implementation of the Modernization of Cosmetics Regulation Act (MoCRA) has increased the importance of facility registration and adverse-event reporting readiness for cosmetic face mask brands, which can advantage manufacturers with established compliance infrastructure when negotiating retail and marketplace listings.
Operational and channel investments also suggest opportunities around domestic availability, faster fulfillment, and validated supply. In May 2025, U.S. Medical Glove Company opened a face mask manufacturing facility in Harvard, Illinois with six high-speed lines and stated capacity above 75 million masks per year under normal conditions (with surge capability noted by the company), supporting shorter replenishment cycles compared with longer import lead times. In March 2026, Bona Fide Masks began shipping from a 50,000 square foot distribution warehouse in Greenville, South Carolina, strengthening regional e-commerce and institutional fulfillment capabilities. Standards and guidance for enhanced barrier face coverings, including ASTM F3502 and CDC NIOSH manufacturer guidance, provide a clearer framework for brands seeking to compete on tested filtration and breathability attributes rather than relying only on cosmetic positioning.
Recent Industry Developments
- July 2026: HHS issued a determination that circumstances no longer justified emergency use authorization for certain medical devices, including some personal respiratory protective devices. This marked a shift away from COVID-19-era emergency policies and reinforced standard regulatory pathways and documentation for medical-mask offerings.
- March 2026: Bona Fide Masks commenced shipping from a new 50,000 square foot distribution warehouse in Greenville, South Carolina. The added logistics footprint strengthened fulfillment capacity and supported faster delivery for both direct-to-consumer and institutional orders across the United States.
- December 2024: The FAST PASS Act passed by Congress to expedite movement of critical medical supplies including PPE through US ports during public health emergencies. The policy reduced bottlenecks and improved material availability for healthcare providers and distributors, shaping procurement planning.


Research Methodology Framework and Report Scope
Market Definition and Coverage
This market covers retail value sales in the United States for cosmetic face masks used for facial skincare, including leave on and wash off products sold in common formats such as sheet, clay, peel off, gel, and cream.
Scope exclusions: Protective and medical masks used as PPE (such as surgical masks, N95 respirators, and dust masks) are excluded from this market sizing.
Segmentation Overview
- By Product Type
- Clay Mask
- Peel-Off Mask
- Sheet Mask
- Cream Mask/Gel Mask
- By End User
- Men
- Women
- By Ingredient
- Natural and Organic
- Conventional
- By Distribution Channel
- Supermarkets/Hypermarkets
- Specialty Stores
- Online Retail Stores
- Other Distribution Channels
- By Region
- Northeast
- Midwest
- South
- West
Data Sources, Market Sizing, and Validation
Desk Research
Desk work starts with building a simple fact base on skincare consumption and retail dynamics, and then tying it back to face mask specific demand. We referenced public sources such as the US Census Bureau retail trade data, Bureau of Labor Statistics price and inflation series, USITC trade statistics for relevant cosmetics categories, and FDA cosmetics related guidance that helps clarify what is and is not a regulated drug or medical product.
We also reviewed company filings, investor presentations, and brand portfolio notes to understand how face mask formats are positioned within skincare, and how pricing has moved over time in mass and prestige channels. Where needed, a paid subscription source for company financials and a separate patent database were used to cross check product activity and category commentary. The sizing model does not rely on any single database line item. The desk sources listed here are illustrative, and we used other public documents and articles to validate details and clear up small definition questions.
Primary Interviews and Surveys
Primary work focused on validating category boundaries and the retail value build up, especially around format mix shifts, typical price points, and how promotions are treated across channels. We spoke with a spread of stakeholders, including brand and product managers, sales and distribution leaders, and category specialists across major US retail and e-commerce routes. Their input was then used to pressure test growth drivers and forecasting assumptions tied to format mix and price progression.
Distribution of primary research fieldwork respondents
| Company type | Respondent position |
|---|---|
| Top tier: 36% | CXOs: 13% |
| Mid tier: 49% | Functional/Unit leaders: 33% |
| Smaller Players: 15% | Managers: 54% |
Market-Sizing & Forecasting
The sizing starts with a top down build that connects US skincare spend and channel level sales trends to the face mask category, and then converts this into a retail value estimate using observed pricing and mix signals. To keep the number grounded, we also ran selective bottom up checks using sampled SKU price points and expected unit movement patterns by format, followed by channel checks to adjust for over counting and white space where data is thin.
Inputs that mattered in the model included format mix (sheet versus wash off), price tiering and promo intensity, distribution changes across mass retail, specialty retail, and online, and consumer usage frequency signals that typically move with skincare routines. For forecasting, scenario analysis was used because category growth can swing with trend cycles, new launches, and retailer resets. Primary inputs helped set realistic ranges for penetration and price progression. Where bottom up visibility was weaker, the gaps were filled by applying conservative shares that were validated in interviews and then stress tested against total category spend and implied per capita usage.
Data Validation & Update Cycle
Outputs are checked through multiple passes, starting with basic variance tests across years, followed by cross checks against independent signals such as retail trade direction, inflation impacts on beauty, and whether implied pricing looks realistic by format. When an outlier shows up, we revisit the assumptions, re check source context, and re contact a subset of interviewees to confirm whether the change is real or a modeling artifact.
Before sign off, the full model is reviewed by another analyst so calculations, inclusions, and unit conversions are consistent. Reports are refreshed annually, and interim updates are done when material events occur such as major channel disruptions or step changes in pricing. Right before delivery, we do a final scan so clients receive the most current view available.
Mordor Intelligence's United States Face Mask Market Estimate Compared With Other Published Estimates
Published market values for face masks often look far apart because the term can mean skincare cosmetics in one study and protective equipment in another, and the price logic can also differ by channel. Differences in the chosen year, currency timing, and how aggressive the trend cycle is treated in forecasts can further widen the gap.
The main gap comes from whether PPE masks are counted. Mordor Intelligence treats the market as cosmetic facial skincare masks sold at retail and keeps out surgical, N95, and dust mask demand that can inflate totals during public health events. Other gaps typically come from how average selling prices are set (list price versus net of promotions), whether online only brands are captured cleanly, and how quickly assumptions are refreshed when format mix shifts toward higher value products.
Benchmark comparison
| Source | Market Size | Gaps in Research Methodology |
|---|---|---|
| Mordor Intelligence | USD 301.92 M (2026) | |
| Press Release Publisher A | USD 556.70 M (2024) | This figure is built around PPE style masks (surgical, protective/N95, and dust), so it captures a different demand pool and is not limited to cosmetic skincare retail sales. |
| Online Data Publisher B | USD 9.17 B (2022) | The estimate appears to use a much broader category definition and scale assumptions that can overstate retail value, with limited clarity on channel coverage and how pricing and promotions are normalized year to year. |
Seen together, the spread is mainly explained by scope and category definition, and then by how pricing and channel coverage are handled. By keeping the inputs tied to observable retail signals, and by confirming assumptions with industry interviews, the final market value stays traceable to repeatable steps instead of broad labels.


Key Questions Answered in the Report
What is the current value of the US face mask market?
The market stands at USD 301.92 million in 2026 and is forecast to climb to USD 451.33 million by 2031.
Why are clay masks growing faster than other segments?
Consumer concern about urban pollution drives demand for deep-cleansing clays, delivering an 8.69% CAGR through 2031.
Which distribution channel shows the highest growth?
Online retail is advancing at 9.72% CAGR, benefiting from live-stream shopping and direct-to-consumer models.
What are the key restraints hindering market expansion?
Ingredient safety concerns, DIY and other alternatives, sensitivity reactions, and supply chain disruptions collectively trim projected CAGR.
Page last updated on:


 Your data is secure and never sold or shared.


