
Market Overview
| Study Period | 2020 - 2031 |
|---|---|
| Forecast Data Period | 2026 - 2031 |
| Base Year Market Size (2025) | USD 2.31 Billion |
| Market Size (2026) | USD 2.61 Billion |
| Market Size (2031) | USD 4.75 Billion |
| Growth Rate (2026 - 2031) | 12.74% CAGR |
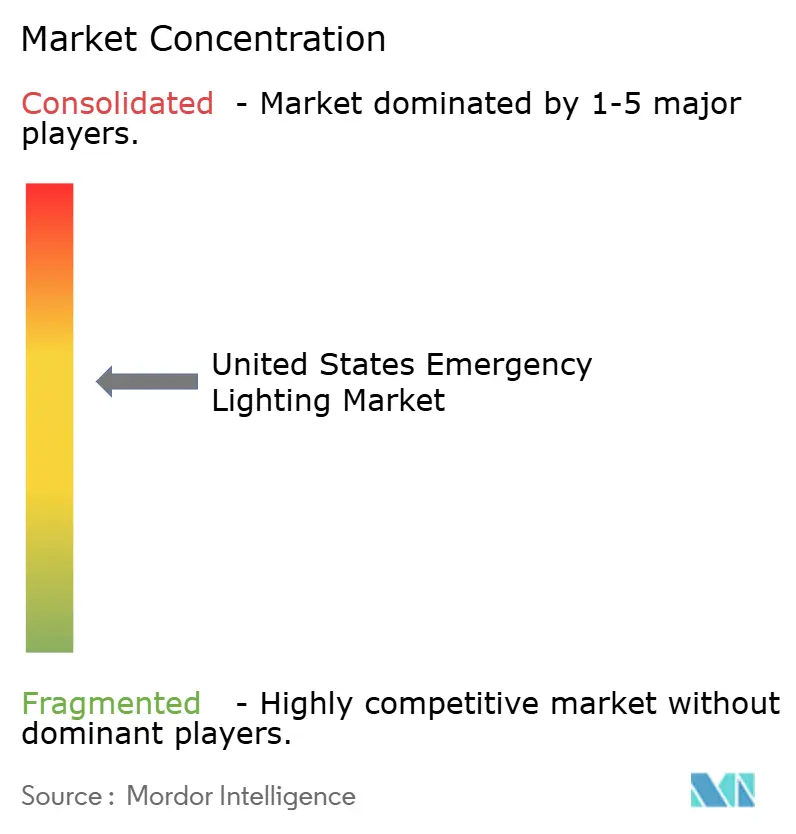
| Market Concentration | Medium |
Major Players *Disclaimer: Major Players sorted in no particular order Image © Mordor Intelligence. Reuse requires attribution under CC BY 4.0. | |
United States Emergency Lighting Market Analysis by Mordor Intelligence
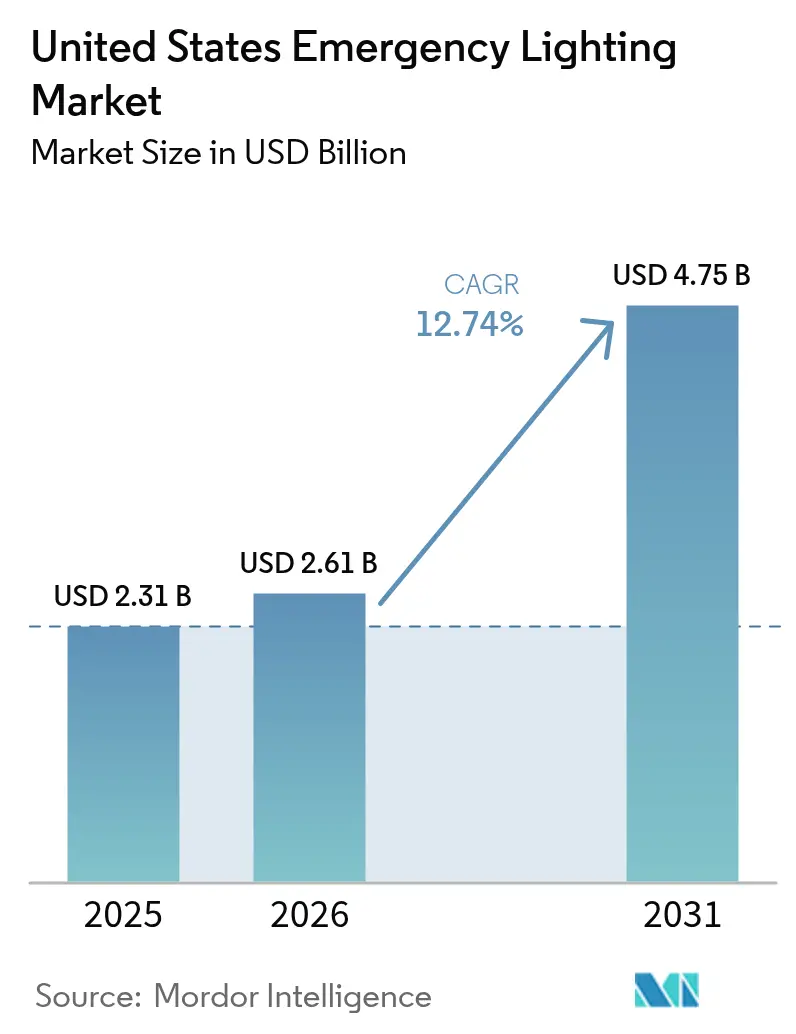
The United States emergency lighting market size was valued at USD 2.31 billion in 2025 and estimated to grow from USD 2.61 billion in 2026 to reach USD 4.75 billion by 2031, at a CAGR of 12.74% during the forecast period (2026-2031). Sustained growth is anchored in the Infrastructure Investment and Jobs Act (IIJA), ongoing LED price declines, the revised UL 924 standard, and stricter NFPA 70/101 enforcement that collectively accelerate retrofit activity across commercial, healthcare, and transit facilities. Federal funds obligated under IIJA reached USD 279 billion by April 2025, generating a steady bid flow for code-compliant lighting packages. LED fixtures now exceed 180 lm/W while lithium-iron-phosphate (LiFePO4) batteries lengthen service life, reducing total cost of ownership and reinforcing the rapid shift away from fluorescent systems. In parallel, IoT-ready platforms such as nLight AIR simplify compliance testing through wireless self-diagnostics, shrinking labor hours and wiring needs. Moderate market concentration allows incumbents to deepen share through acquisitions and smart-building offerings that embed emergency luminaires into broader energy-management ecosystems.
Key Report Takeaways
- By system type, self-sustained products held 64.38% of the United States emergency lighting market share in 2025 and will expand fastest at 13.92% CAGR through 2031.
- By light source, LEDs led with 78.02% revenue share in 2025, while the same segment is projected to post a 14.06% CAGR to 2031.
- By operating mode, maintained fixtures commanded a 52.15% share of the United States emergency lighting market size in 2025, whereas switched/multi-mode units are poised for a 15.33% CAGR over the forecast period.
- By end user, commercial facilities contributed 40.70% revenue in 2025; public infrastructure and transit venues represent the fastest-growing user group at 14.98% CAGR to 2031.
Note: Market size and forecast figures in this report are generated using Mordor Intelligence’s proprietary estimation framework, updated with the latest available data and insights as of 2026.
United States Emergency Lighting Market Trends and Insights
Drivers Impact Analysis*
| Driver | (~) % Impact on CAGR Forecast | Geographic Relevance | Impact Timeline |
|---|---|---|---|
| Growing LED efficacy and price declines | +2.80% | Nationwide, strongest in commercial & healthcare | Short term (≤ 2 years) |
| Stringent NFPA 70/101 and OSHA compliance push | +3.20% | National high-occupancy buildings | Medium term (2-4 years) |
| Rise in smart-building retrofits (IoT integration) | +2.10% | Urban Northeast & West Coast | Medium term (2-4 years) |
| Federal infrastructure-upgrade funding (IIJA) | +2.90% | All states, focus on transportation hubs | Long term (≥ 4 years) |
| Climate-resilience mandates for severe-weather events | +1.70% | Coastal & tornado-prone regions | Long term (≥ 4 years) |
| Corporate ESG decarbonization targets | +1.40% | Fortune 500 campuses | Medium term (2-4 years) |
| Source: Mordor Intelligence | |||
Growing LED Efficacy and Price Declines Drive Market Transformation
New-generation LED emergency luminaires now surpass 180 lm/W, allowing facility owners to cut energy use by up to 82% after retrofits. McLaren Health Care replaced 25,000 units across 11 hospitals and lowered annual utility costs by USD 1.6 million, confirming favorable payback periods despite code-driven battery upgrades.[1]Orion Lighting, “LED Lighting Case Studies – Colby Metal,” orionlighting.com Falling diode costs compress fixture pricing, pushing the United States emergency lighting market deeper into price-parity territory with fluorescent incumbents. High efficacy shortens battery sizing requirements, further trimming upfront spend. As a result, LED penetration is expected to exceed 90% of new installations before 2027. The technology leadership strengthens supplier bargaining power while widening adoption in budget-sensitive education and municipal projects.
Stringent NFPA 70/101 and OSHA Compliance Push Reshapes Installation Standards
The latest NFPA 101 edition mandates 1 fc minimum egress illuminance and 90-minute backup duration, driving facility managers to replace non-conforming fixtures during remodels. UL 924 (May 2022) now requires luminaires to sense normal power presence; wireless mesh offerings like nLight AIR satisfy this rule without extra control wiring.[2]nLight Acuity Brands, “UL 924 Emergency Solutions,” nlight.acuitybrands.com School districts leveraging performance-contract models, such as West Mifflin, anticipate USD 9.9 million in savings across 15 years by exceeding code baselines. Consistent monthly self-tests and annual discharge reports generated by smart drivers remove manual log-keeping, easing OSHA audits. Enhanced enforcement boosts replacement cycles and cements compliance features as table-stakes in bid specifications throughout the United States emergency lighting market.
Rise in Smart-Building Retrofits Accelerates IoT Integration
Airports, hospitals, and Class-A offices increasingly demand centrally monitored emergency networks. O’Hare’s rental-car center linked 7,000 LED fixtures to a campus-wide dashboard for predictive maintenance and daylight harvesting benefits. Bluetooth-mesh nodes permit remote firmware updates, cutting truck rolls and shrink burn-hour variance that formerly voided battery warranties. Facility executives treat luminaires as data endpoints that feed carbon-intensity dashboards for ESG reporting. The convergence of safety and analytics widens addressable value for vendors who bundle lighting, controls and software, reinforcing growth momentum within the United States emergency lighting market.
Federal Infrastructure-Upgrade Funding Creates Unprecedented Market Opportunities
IIJA’s USD 432.1 billion budget authority earmarks billions for rail, airport, and streetlighting projects, sustaining long-run backlog for specification-grade luminaires.[3]U.S. Department of Transportation, “Infrastructure Investment and Jobs Act Funding Status,” transportation.gov Ameresco’s USD 47 million Memphis retrofit converted 77,000 roadway fixtures, realizing 37 million kWh annual savings and validating mass-scale economics. Runway upgrades at Daytona Beach International Airport completed in May 2025 underscore accelerated adoption timelines for mission-critical aviation assets. Buy-America rules spur localized assembly investments, fostering supply-chain resilience and supporting the United States's emergency lighting market’s domestic value-addition objectives.
Restraints Impact Analysis*
| Restraint | (~) % Impact on CAGR Forecast | Geographic Relevance | Impact Timeline |
|---|---|---|---|
| High upfront cost of code-compliant systems | −1.8% | Small commercial & K-12 facilities | Short term (≤ 2 years) |
| Competition from distributed micro-UPS & PoE lighting | −1.2% | Fiber-rich urban cores | Medium term (2-4 years) |
| Lithium-battery supply volatility | −1.5% | Nationwide | Short term (≤ 2 years) |
| Skills gap in low-voltage installation | −0.9% | Rural counties | Long term (≥ 4 years) |
| Source: Mordor Intelligence | |||
High Upfront Cost of Code-Compliant Systems Constrains Adoption
Advanced self-test drivers, LiFePO4 packs, and wireless radios elevate the bill-of-materials up to 40% versus legacy fluorescent units, stretching payback horizons for cash-constrained owners. Smaller retailers and community colleges often postpone upgrades despite energy rebates, slowing total addressable volume in segments that collectively account for more than one-third of building stock. Nonetheless, as LED component costs retreat and utilities expand prescriptive incentives, cost barriers are forecast to soften, permitting latent demand to migrate into the active United States emergency lighting market.
Lithium-Battery Supply Volatility Threatens Cost Predictability
Lithium carbonate averaged USD 9,271 per metric ton in early 2025; any renewed price spike could inflate fixture costs because batteries contribute up to 25% of unit pricing. Geopolitical risk in raw-material processing and a still nascent U.S. cell-manufacturing base raise lead-time uncertainty, forcing contractors to stock higher safety inventory and eroding margin on fixed-price bids. OEMs that dual-source cells or open regional pack-assembly lines will insulate project timelines and preserve share in the United States emergency lighting industry.
*Our forecasts treat driver/restraint impacts as directional, not additive. The impact forecasts reflect baseline growth, mix effects, and variable interactions.
Segment Analysis
By System Type: Self-Sustained Designs Extend Leadership
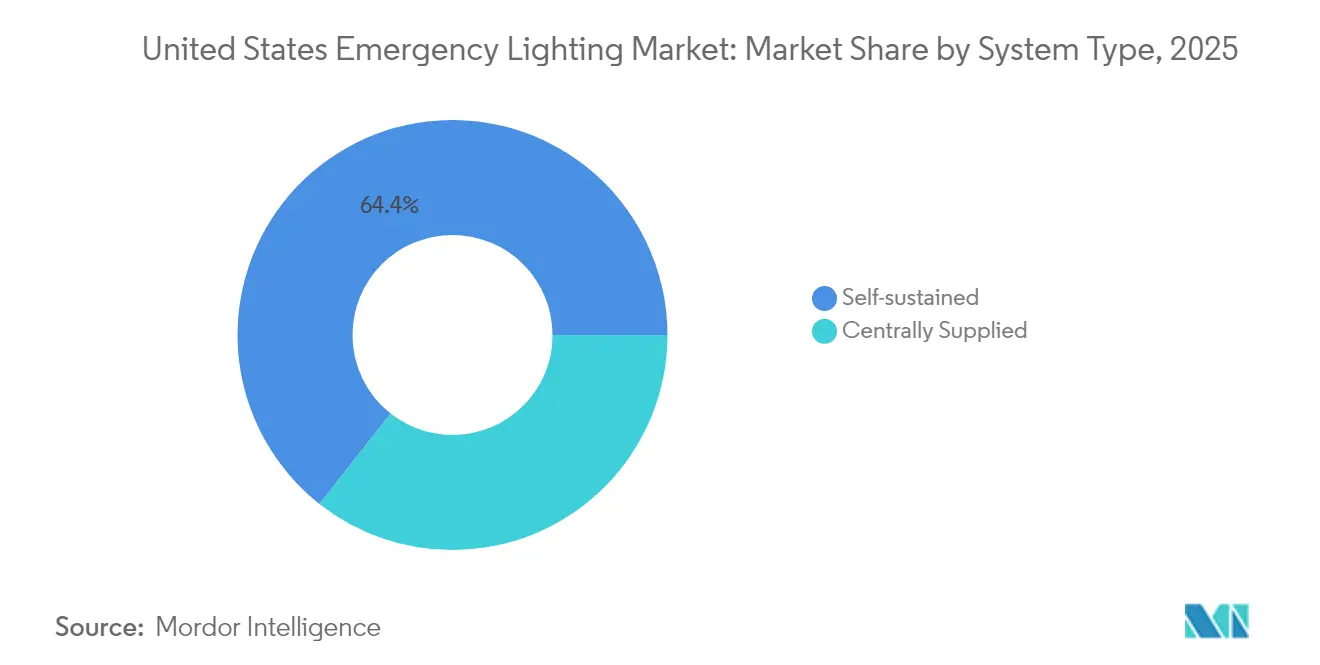
Self-sustained units dominated with a 64.38% United States emergency lighting market share in 2025 and are projected to expand at a 13.92% CAGR to 2031, underscoring their ease of installation and resilience against single-point failures. Dispersed batteries embedded inside every luminaire simplify decentralized retrofits in offices, hospitals, and rail stations, eliminating the need for dedicated battery rooms. Centrally supplied systems retain a foothold in mega-campus healthcare projects where unified monitoring eases quarterly testing, but their cost-intensive wiring constrains new adoption.
The distributed-intelligence trend aligns with the broader digitization of commercial real estate, positioning self-contained fixtures as a backbone for building-wide sensor networks. Edge analytics within each light enable localized diagnostics, compressing mean-time-to-repair and enhancing compliance reporting that is critical for maintaining NFPA and OSHA certifications across the United States emergency lighting market.


By Light Source: LEDs Cement Market Supremacy
LEDs accounted for 78.02% of 2025 shipments and will remain the fastest-growing light source at 14.06% CAGR, reflecting superior efficacy, instant-on capability, and 50,000-hour lifetimes. The United States emergency lighting market size associated with LED luminaires is set to outpace fluorescent replacements by a factor of four during the forecast horizon as procurement managers chase double-digit energy savings and lower maintenance budgets. Industrial clients cite maintenance callouts falling by 60% after switching from T8-based battery packs to purpose-built LED exits.
Declines in component pricing are shrinking the LED premium, enabling quick paybacks even in price-sensitive municipal projects. Fluorescent and halogen options persist mainly in niche applications, but their combined unit share will likely dip below 5% before 2028, confirming LEDs as the de-facto standard throughout the United States emergency lighting market.
By Operating Mode: Maintained Fixtures Hold Majority while Multi-Mode Surges
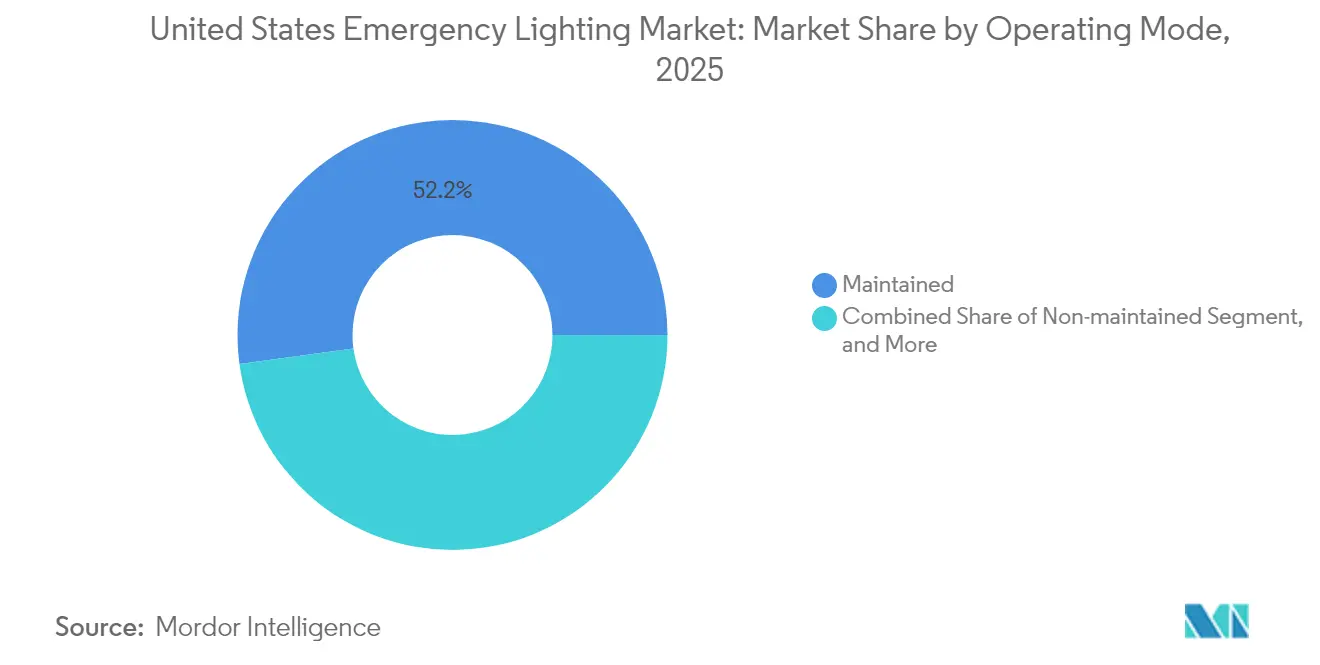
Maintained fixtures represented 52.15% of the United States emergency lighting market size in 2025, owing to dual-use functionality that doubles as corridor illumination under normal power. Facility managers value the elimination of redundant fixtures, which frees ceiling real estate for sensors and improves aesthetics in LEED-certified buildings.
Switched or multi-mode units, however, are on track to register a 15.33% CAGR, spurred by smart-building retrofits that leverage occupancy data to dim during low-traffic windows while preserving emergency readiness. Integration with lighting-control software supports sophisticated scheduling and energy dashboards, resonating with ESG-driven corporate buyers. Non-maintained units continue to serve low-use egress areas but face muted growth as owners gravitate toward fixtures offering day-to-day utility inside the dynamic United States emergency lighting market.
By End User: Commercial Sector Leads; Transit Hubs Accelerate
Commercial real estate contributed 40.70% of 2025 revenue, reflecting steady tenant-improvement cycles and post-pandemic workplace refreshes. Retrofits increasingly bundle emergency lighting with HVAC and security upgrades to secure holistic ESG certifications and to meet WELL Building standards.
Transit and public infrastructure venues will exhibit the highest 14.98% CAGR as IIJA funds accelerate airport and subway modernization. Daytona Beach International Airport completed a 21-day LED runway upgrade in May 2025, validating rapid installation schedules that can be replicated at peer facilities nationwide. Healthcare chains and universities continue sizable retrofit programs driven by maintenance savings and resilience targets, maintaining a robust project funnel across the United States emergency lighting market.
Geography Analysis
California, Texas, New York, Florida, and Illinois collectively attract the bulk of IIJA grants, propelling concentrated demand in coastal and freight-corridor states. California alone approved USD 830 million for transportation in December 2024, a share that includes emergency egress lighting for bridges and interchanges. These allocations ensure steady order intake for OEMs with Buy-America-compliant SKUs, bolstering the United States emergency lighting market in high-population regions.
The Midwest benefits from logistics-park construction and tornado-resilient building codes that elevate battery-duration specifications above national minima. Illinois Department of Transportation’s USD 0.52 million 2025 highway-lighting contract exemplifies the wave of LED-centric maintenance programs beyond coastal metros. Rural districts struggle with limited certified electricians, but federal technical-assistance grants are beginning to offset the skills gap, gradually unlocking latent demand across the broader United States emergency lighting market.
Urban centers in the Northeast and Pacific Northwest lead smart-building pilots, deploying Bluetooth-mesh emergency networks that dovetail with carbon-intensity disclosure laws. Proxy ordinances in New York City and Seattle set the stage for statewide rollouts, positioning these markets as bellwethers for controls-heavy specifications that will diffuse nationally by the end of the decade.
Regulatory Landscape
Emergency lighting requirements in the United States are enforced through adoption and inspection by local Authorities Having Jurisdiction (AHJs), with core technical and life-safety provisions anchored in NFPA 101 (Life Safety Code) for egress performance and duration, NFPA 70 (National Electrical Code) for emergency system installation (notably Article 700), and the International Building Code (IBC) for building egress illumination criteria. At the product level, ANSI/UL 924 is the national safety standard for emergency lighting and power equipment, with a 2025 revision (ANSI designation dated February 12, 2025) reinforcing design and compliance expectations for listed emergency luminaires and controls used in commercial and public facilities.
Compliance obligations extend beyond installation into ongoing inspection and test documentation. NFPA 101 testing covers monthly functional checks and an annual full-duration discharge, while OSHA enforcement of safe exit routes under 29 CFR 1910.36 and 1910.37 shapes employer maintenance practices. Trade policy can also affect landed costs: CBP tariff guidance in 2026 highlighted restructured Section 232 metals tariffs that can apply to derivative goods, which can raise costs for metal-intensive luminaires and electrical assemblies and strengthen incentives for Buy-America-aligned sourcing and domestic assembly strategies within the report scope.
Competitive Landscape
Acuity Brands, Eaton, and Hubbell together captured a major share in shipment value in 2024, indicating moderate concentration within the United States emergency lighting market. Acuity improved operating profit by 16.9% in fiscal 2024 through portfolio realignment and new software-centric acquisitions. Eaton’s Electrical Americas segment expanded backlog 29% year-over-year, leveraging infrastructure spending to scale UPS-integrated luminaires. Hubbell divested its residential Progress Lighting arm to sharpen focus on specification-grade and hazardous-area fixtures, a segment that requires specialized engineering and carries higher margins.
Strategic playbooks emphasize IoT integration, UL 924 compliance, and localized battery assembly. Acuity’s January 2025 acquisition of Q-SYS (USD 1.1 billion) adds audio-visual control assets that can feed mass-notification layers atop emergency egress lighting, broadening the value proposition for campus customers. Eaton doubles down on lithium battery partnerships to hedge supply volatility, while Hubbell expands wireless commissioning tools to reduce job-site labor in labor-tight regions. Mid-tier challengers court share via differentiated LiFePO4 chemistries promising 2,000-cycle life, but scale economies still favor incumbents, maintaining the United States emergency lighting market’s moderately consolidated structure.
Emerging disruptors bundle Power-over-Ethernet (PoE) drivers with cloud dashboards, pitching unified low-voltage grids that merge data, power, and control. Although the share remains small, these entrants press incumbents to quicken software rollouts, accelerating digital maturity across the United States emergency lighting market.
United States Emergency Lighting Industry Leaders
Acuity Brands Inc.
Eaton Corporation plc
ABB Ltd
Hubbell Incorporated
Signify N.V.
- *Disclaimer: Major Players sorted in no particular order

Market Opportunities and Future Outlook
A key white-space area is compliance automation that reduces the labor burden of NFPA 101 testing and recordkeeping, especially for multi-site owners in commercial real estate, healthcare, education, and public infrastructure. Named platforms and product families that automate self-test, diagnostics, and reporting support a shift away from manual logs toward centralized compliance workflows, consistent with the market move toward IoT-ready emergency lighting and broader smart-building retrofits.
Another opportunity is specification-driven modernization tied to infrastructure and transit upgrades funded through federal and state programs, where code-compliant emergency luminaires are procured alongside broader LED and controls packages. IIJA obligation levels (USD 279 billion reported by April 2025) and completed airport lighting projects such as Daytona Beach International Airport (May 2025 runway LED upgrade) offer demand signals for bid-aligned emergency lighting. With the updated ANSI/UL 924 (2025) and controlled-emergency-lighting clarifications from industry bodies such as NEMA, procurement criteria continue to favor listed, interoperable solutions that maintain required emergency output even when integrated with advanced controls.
Recent Industry Developments
- June 2026: Aleo Lighting launched a new emergency and exit product line positioned around code-compliant solutions for commercial and industrial facilities. The introduction widens supplier choice in core retrofit categories and increases competitive pressure on incumbents in packaged emergency and egress offerings.
- December 2025: IOTA (Acuity Brands) introduced next-generation ILD Series emergency drivers with a reduced form factor, 90-minute constant power design, and self-testing diagnostics. Smaller, standardized drivers expand retrofit feasibility in constrained plenums and support automated testing workflows aligned with NFPA inspection routines.
- April 2024: Acuity Brands introduced Connected STAR to automate emergency lighting testing and compliance reporting using a STAR Gateway by IOTA. Centralized monitoring and reporting support portfolio-wide maintenance standardization and reinforce the shift toward connected, software-assisted emergency lighting management.


Research Methodology Framework and Report Scope
Market Definition and Coverage
This market covers revenues from emergency lighting used in the United States when normal power fails, including escape lighting and standby lighting installed in buildings and facilities. It includes emergency lamps and luminaires, plus core accessories that enable backup operation and testing.
Scope exclusions: We exclude portable flashlights and non-installed consumer backup lights that are not part of a code-oriented emergency lighting system.
Segmentation Overview
- By System Type
- Self-sustained
- Centrally Supplied
- By Light Source
- LED
- Fluorescent
- Others (Halogen, Incandescent, etc.)
- By Operating Mode
- Maintained
- Non-maintained
- Switched/Multi-mode
- By End User
- Commercial
- Industrial
- Educational Facilities
- Healthcare Facilities
- Public Infrastructure and Transit
- Others (Residential, Hospitality, etc.)
Data Sources, Market Sizing, and Validation
Desk Research
Desk research started with public safety and electrical requirements that shape where emergency lighting is installed and how it must perform. We referenced materials such as NFPA 101 (Life Safety Code), NFPA 70 (National Electrical Code), UL 924 guidance for emergency lighting and power equipment, and OSHA resources that explain workplace egress expectations.
To ground demand signals, we used public construction and building activity series such as US Census Bureau construction spending, and we checked public energy and lighting publications from the US Department of Energy for technology direction and retrofit context. We also reviewed state and local building code portals where available, along with publicly posted procurement notices and bid documents that commonly specify exit signs and emergency luminaires. Company annual reports, product catalogs, investor presentations, and credible trade press were used to refine product boundaries and pricing direction, and this was complemented by paid subscriptions for company financials and intelligence and for shipment-level import and export context where helpful. These desk sources are illustrative and not exhaustive, and many other references were also used for data collection, validation, and clarification.
Primary Interviews and Surveys
Primary work focused on confirming how emergency lighting is specified, priced, and replaced across key US building types, since those choices drive volumes more than broad lighting spend does. We spoke with a mix of manufacturers, distributors, contractors, facility managers, and code-oriented consultants to validate adoption rates for LED emergency luminaires, monitoring and test features, and the typical replacement cycle for installed systems.
Distribution of primary research fieldwork respondents
| Company type | Respondent position | Region |
|---|---|---|
| Top tier: 33% | CXOs: 12% | |
| Mid tier: 53% | Functional/Unit leaders: 36% | |
| Smaller Players: 14% | Managers: 52% |
Market-Sizing & Forecasting
Sizing began with a top-down build that reconstructs addressable demand from US building activity and installed base needs, and then filters it through emergency lighting code triggers and typical specification patterns. To keep the model practical, we focused on variables that can be checked repeatedly, such as nonresidential construction spending, renovation intensity in commercial buildings, the share of projects that require egress upgrades, LED conversion momentum, and accessory attach rates for items like power packs, test switches, and monitoring modules.
Once that demand pool was shaped, the revenue layer was created by applying reasonable price bands by product family and by channel, followed by a cross-check using selective bottom-up approximations. Those checks included sampled average selling price times shipment volume logic for common SKUs, distributor and contractor channel checks on margin and mix, and limited supplier roll-ups where public financials or credible interview inputs allowed it. Where inputs were sparse, gaps were handled by using conservative ranges, and then narrowing them after follow-up calls focused on the specific unknown, such as monitoring penetration in retrofit projects.
For forecasting, scenario analysis was used so the outlook stays tied to drivers that practitioners actually track, such as enforcement strength for NFPA and UL-aligned requirements, municipal funding cycles, and the pace of retrofit programs in older buildings. The final trajectory was adjusted only after primary respondents confirmed that the assumptions match what they see in quotes, specifications, and replacement decisions.
Data Validation & Update Cycle
Validation was done through multiple checks so the final totals make sense against independent demand signals. We compared the model outputs with construction and renovation indicators, procurement activity, and observed mix shifts toward LED emergency luminaires and monitoring features, then investigated any sharp jumps that did not match these signals.
Before sign-off, the model was reviewed in steps, with assumption ranges tested for sensitivity so a single input does not over-control the outcome. If a variance stayed large after internal review, respondents were re-contacted to confirm whether the issue came from scope boundaries, pricing timing, or a real market change. Reports are refreshed annually, and interim updates are made when material events occur, followed by a final pre-delivery pass so clients receive the latest updated view.
Mordor Intelligence's United States Emergency Lighting Market Size Versus Other Published Estimates
Published market sizes for US emergency lighting can vary even when the topic sounds the same, because the underlying boundaries and revenue points are not always matched. Differences usually come from what gets counted as emergency lighting versus adjacent general lighting, which channels are included, and whether accessory revenues are treated as part of the system.
By checking code-linked product coverage, refresh timing for pricing, and accessory attach assumptions, Mordor Intelligence keeps the total centered on installed escape and standby emergency lighting systems in the United States. This can separate it from totals that blend in broader commercial lighting upgrades or that only count new-build fixture sales.
Benchmark comparison
| Source | Market Size | Gaps in Research Methodology |
|---|---|---|
| Mordor Intelligence | USD 2.31 B (2025) | |
| Industry Association A | USD 1.90 B (2025) | This estimate appears to emphasize fixtures and exit signage sales tied to new builds, which can undercount retrofit-driven replacement demand and attached accessories such as power packs, test switches, and monitoring modules. |
| Trade Journal B | USD 2.80 B (2026) | This number likely uses a broader scope that rolls emergency lighting into wider commercial lighting upgrades and may apply a different price normalization window, which can lift totals when LED mix and accessory penetration are not separated clearly. |
The spread across sources is mainly explained by whether the scope stays limited to emergency lighting systems and their enabling accessories, and by how retrofit replacement is treated versus only new construction. When the demand pool is tied back to code-linked installations and then cross-checked with channel and pricing inputs, the result stays easier to replicate and to update as specifications and funding cycles shift.


Key Questions Answered in the Report
What is the current value of the United States emergency lighting market?
The market was valued at USD 2.61 billion in 2026 and is projected to reach USD 4.75 billion by 2031.
Which system type leads U.S. installations?
Self-sustained luminaires commanded 64.38% share in 2025, owing to simplified wiring and distributed battery redundancy.
How will IIJA spending influence demand?
IIJA has already obligated USD 279 billion, funding large transit and airport projects that will sustain double-digit fixture demand through 2031.
Why are LiFePO4 batteries gaining traction?
They deliver longer cycle life and lower maintenance, aligning with NFPA 90-minute backup mandates without frequent replacement.
Which end-user segment is growing fastest?
Public infrastructure and transit facilities will grow at 14.98% CAGR as they modernize lighting for safety and energy savings.
What is driving adoption of smart emergency lighting?
Wireless self-testing, centralized dashboards and compliance automation reduce labor costs and support ESG reporting goals.
Page last updated on:






