
United States Electronics And Appliance Stores Market Size and Share
Market Overview
| Study Period | 2020 - 2031 |
|---|---|
| Forecast Data Period | 2026 - 2031 |
| Base Year Market Size (2025) | USD 92.61 Billion |
| Market Size (2026) | USD 95.9 Billion |
| Market Size (2031) | USD 114.15 Billion |
| Growth Rate (2026 - 2031) | 3.55 % |
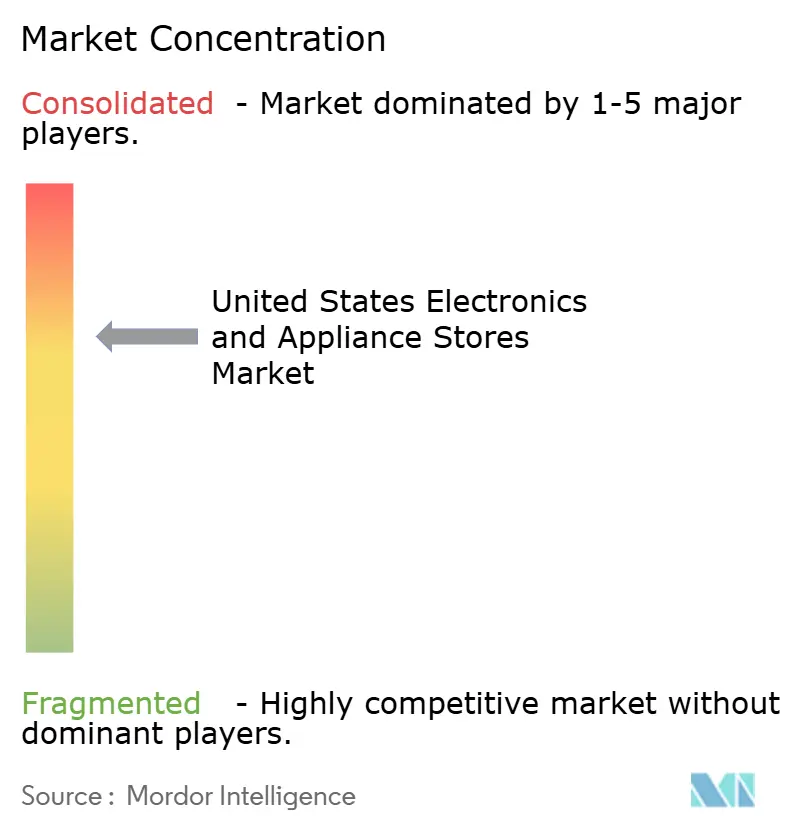
| Market Concentration | Medium |
Major Players *Disclaimer: Major Players sorted in no particular order Image © Mordor Intelligence. Reuse requires attribution under CC BY 4.0. | |
United States Electronics And Appliance Stores Market Analysis by Mordor Intelligence
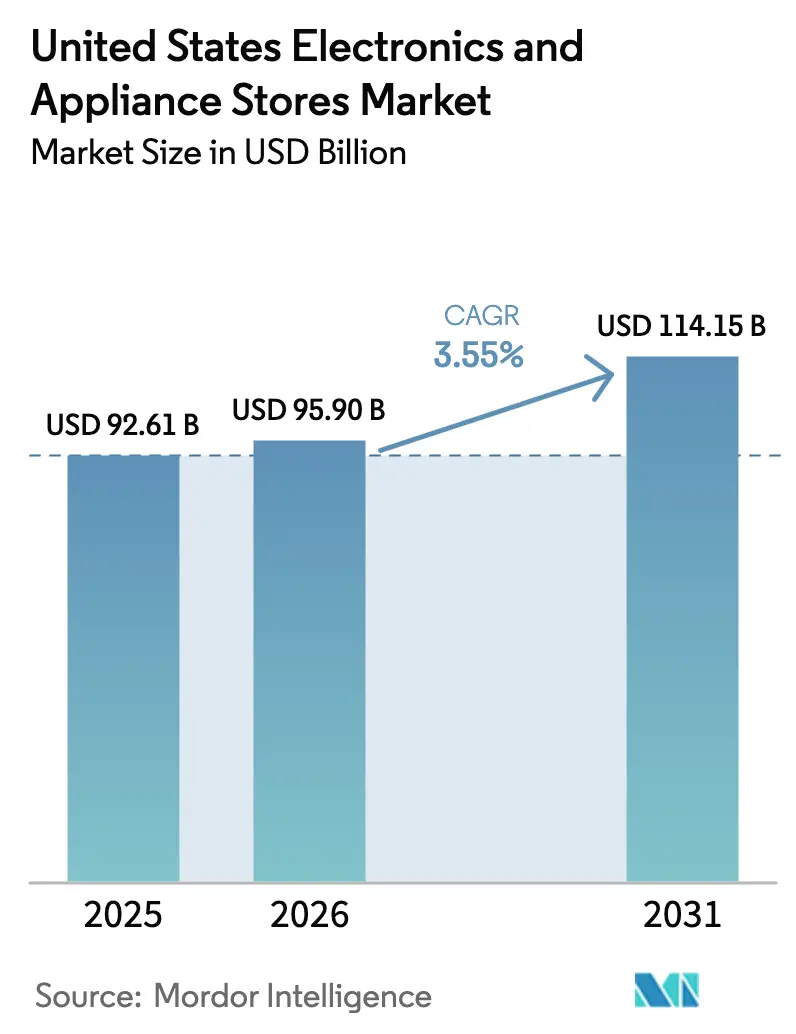
The US electronics and appliance stores market size was valued at USD 92.61 billion in 2025 and estimated to grow from USD 95.9 billion in 2026 to reach USD 114.15 billion by 2031, at a CAGR of 3.55% during the forecast period (2026-2031). This moderate yet steady trajectory followed a volatile pandemic period and is anchored in rising demand for connected, energy-efficient products, catalyzed by the Inflation Reduction Act’s USD 8.8 billion home-energy rebate pool. While remodeling spending declined 7% to USD 449 billion in 2024, it remained well above pre-pandemic baselines, ensuring a robust replacement cycle. Concurrently, housing starts are projected to reach 1.01 million single-family units in 2025, further sustaining appliance sales.[1]Channel dynamics show in-store sales preserving a 71.5% share in 2024, but online pure-play platforms are expanding at a 5.1% CAGR as buy-now-pay-later adoption lifts both purchase incidence and basket value.
Key Report Takeaways
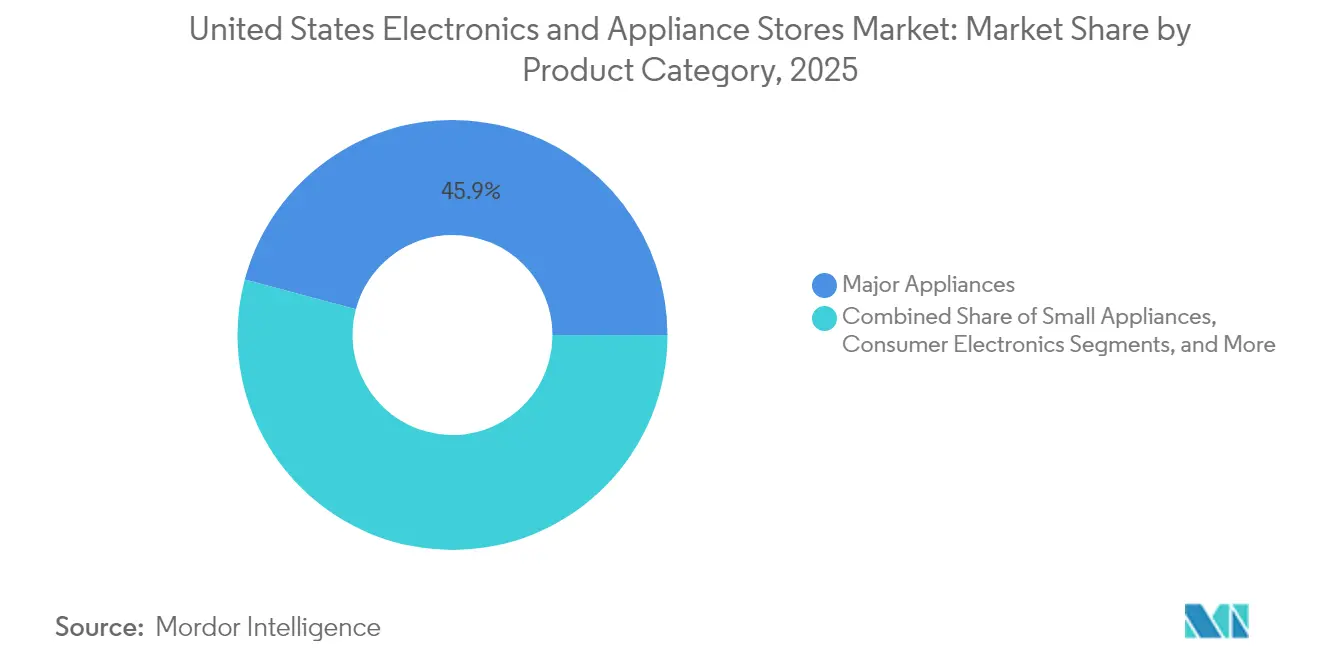
- By product category, Major Appliances held 45.85% of the US electronics and appliance stores market share in 2025, while Smart Home Devices are advancing at a 5.2% CAGR through 2031.
- By store type, Big-Box Retailers led with 51.95% revenue share in 2025; Flagship Experience Centers are forecast to expand at a 4.3% CAGR.
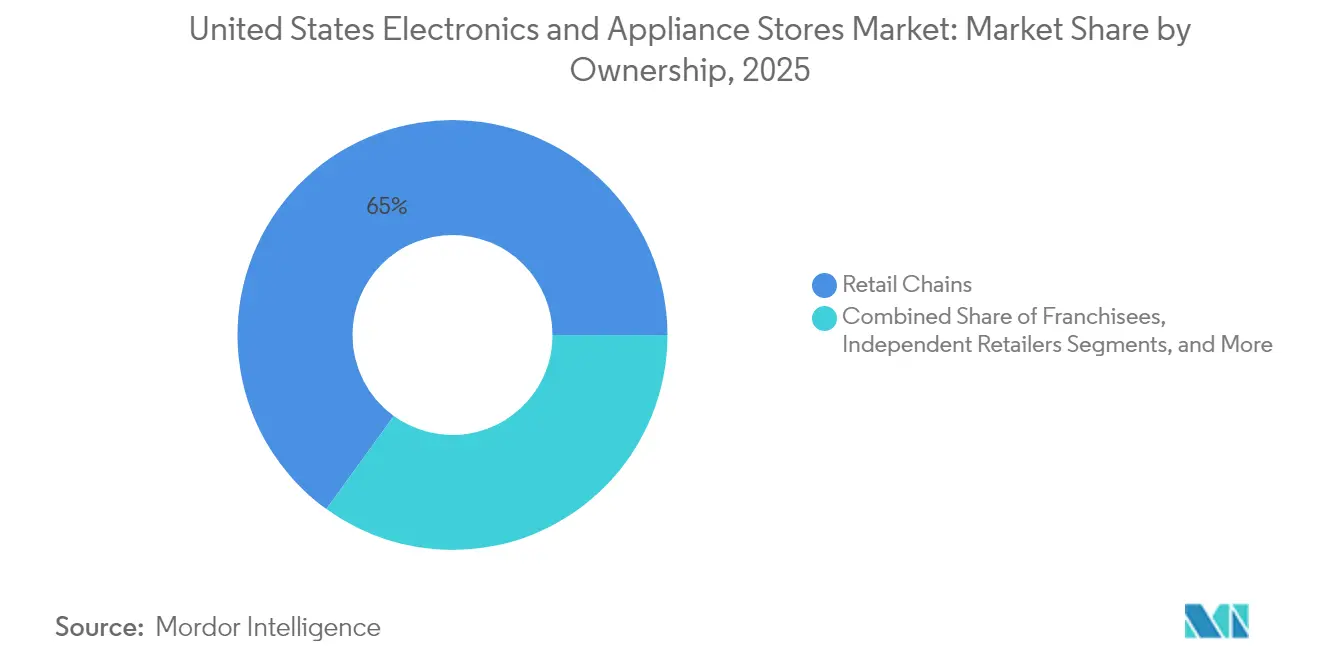
- By ownership structure, Retail Chains accounted for 65.02% of the US electronics and appliance stores market size in 2025; Manufacturer-Branded Stores are growing at a 4.2% CAGR.
- By sales channel, in-store transactions captured 70.85% share in 2025, whereas Online Pure-Play platforms are rising at 4.8% CAGR.
Note: Market size and forecast figures in this report are generated using Mordor Intelligence’s proprietary estimation framework, updated with the latest available data and insights as of 2026.
United States Electronics And Appliance Stores Market Trends and Insights
Drivers Impact Analysis*
| Driver | (~) % Impact on CAGR Forecast | Geographic Relevance | Impact Timeline |
|---|---|---|---|
| Growth in premium smart-appliance adoption | +0.8% | National, with early gains in metropolitan areas | Medium term (2-4 years) |
| Housing starts and remodeling uptrend | +0.6% | National, concentrated in Sun Belt states | Long term (≥ 4 years) |
| Omnichannel retail model expansion | +0.5% | National, with urban-suburban differentiation | Short term (≤ 2 years) |
| Inflation Reduction Act high-efficiency rebates | +0.4% | National, with state-specific implementation | Medium term (2-4 years) |
| Private-label appliance proliferation | +0.3% | National, with big-box retailer concentration | Long term (≥ 4 years) |
| Turn-key installation and service bundles | +0.2% | National, with a professional contractor focus | Medium term (2-4 years) |
| Source: Mordor Intelligence | |||
Growth in Premium Smart-Appliance Adoption
Heightened consumer focus on connectivity and energy savings pushed smart products to the forefront, allowing premium price points to hold despite inflation. Matter-enabled platforms from BSH and peers addressed interoperability barriers, accelerating adoption among tech-savvy millennials entering peak home-buying years. Manufacturers widened smart feature penetration to offset semiconductor input cost escalation, creating scale efficiencies that lowered unit costs. These factors combined to lift premium segment resilience, with discretionary outlays shifting toward devices promising predictive maintenance and lower utility bills.
Housing Starts and Remodeling Uptrend
Although overall remodeling outlays slipped in 2024, they still hovered at USD 449 billion—well above pre-2020 levels—supporting steady appliance replacement. Forecast single-family starts of 1.01 million units in 2025 underscore sustained structural demand, especially in Sun Belt states where population inflows and corporate relocations spur new construction. High mortgage rates encouraged existing homeowners to refurbish rather than relocate, redirecting capital toward ENERGY STAR-certified models that satisfy evolving building-code requirements.
Omnichannel Retail Model Expansion
Retailers integrated online, mobile, and physical touchpoints to improve conversion. Best Buy’s turnaround showcased the value of click-and-collect and AR-enhanced apps that let shoppers visualize appliances, curbing returns. Lowe’s debut of a third-party marketplace expanded assortment without inventory risk. Home Depot leveraged AI for predictive stocking, turning stores into experience hubs that pair service with immediate fulfillment.
Inflation Reduction Act High-Efficiency Rebates
The Home Electrification and Appliance Rebates program earmarked USD 4.5 billion for efficient upgrades, granting households earning below 150% of the area median income up to USD 14,000 in combined incentives. Point-of-sale application simplifies uptake, steering consumers toward higher-margin, high-efficiency models. Early-adopter states like New York have already secured USD 158 million, accelerating local market penetration.
Restraints Impact Analysis*
| Restraint | (~) % Impact on CAGR Forecast | Geographic Relevance | Impact Timeline |
|---|---|---|---|
| Semiconductor and logistics bottlenecks | -0.7% | Global, with concentrated impact on smart appliances | Short term (≤ 2 years) |
| Price sensitivity amid inflation | -0.4% | National, with regional income variations | Medium term (2-4 years) |
| Stricter e-waste compliance costs | -0.3% | National, with state-specific regulations | Long term (≥ 4 years) |
| BNPL financing margin pressure | -0.2% | National, with demographic variations | Medium term (2-4 years) |
| Source: Mordor Intelligence | |||
Semiconductor and Logistics Bottlenecks
The October 2024 shutdown at North Carolina quartz mines highlighted fragile supply chains for high-purity materials essential to chips.[2] Component shortages raised smart-appliance input costs 20–30%, lengthened lead times, and forced retailers to carry excess inventory for safety stock. The geographic concentration of chip fabrication in Asia compounded risk through extended freight lanes and port congestion.
Price Sensitivity Amid Inflation
May 2025 saw appliance prices edge 0.77% higher while durable-goods CPI advanced 0.53%, squeezing discretionary budgets. Although BNPL volumes ballooned to USD 300 billion in 2023, new caps on credit card late fees to USD 8 curtailed retailer financing income. As a result, mid-tier consumers deferred upgrades, bifurcating the market into premium adopters and value-oriented buyers.
*Our forecasts treat driver/restraint impacts as directional, not additive. The impact forecasts reflect baseline growth, mix effects, and variable interactions.
Segment Analysis
By Product Category: Smart Devices Lift Premium Mix
Smart Home Devices posted the fastest CAGR at 5.2% through 2031 as households embraced connected ecosystems that integrated thermostats, lighting, and appliances. The US electronics and appliance stores market size for Smart Home Devices is projected to climb in tandem with Matter protocol rollouts that resolved compatibility concerns. Major Appliances, holding 45.85% revenue in 2025, gained from replacement demand tied to aging housing stock and IRA rebates. Small Appliances enjoyed tailwinds from urban living’s need for compact multifunction units spotlighted at IFA 2024. Consumer Electronics lagged due to lengthening replacement cycles and a 2% overall tech-sales decline in 2024.
Manufacturers used AI-driven predictive maintenance to differentiate refrigerators and washing machines, encouraging service-bundle sales. Energy-efficient heat-pump water heaters became rebate magnets, exemplified by New Hampshire’s USD 1,750 incentives. In parallel, semiconductor scarcity prompted OEMs to prioritize premium SKUs to preserve margins, indirectly supporting the smart segment’s ascendancy inside the broader US electronics and appliance stores market.

By Store Type: Experience Centers Redefine Engagement
Flagship Experience Centers grew at a 4.3% CAGR, propelled by BSH’s 14,847 sq ft Houston showroom that combines live cooking, personalized design, and after-sales consultation. These venues let consumers trial connected features, elevating confidence in complex installations. Big-Box Retailers retained a 51.95% share by leveraging logistics scale and cross-category traffic, demonstrating Home Depot’s appliance gains via exclusive brand deals.
Warehouse Clubs exploited bulk-buying economics to target value-seeking households, while Discount Outlets cleared prior-generation inventory to price-sensitive shoppers. Specialty Appliance Stores differentiated through bespoke kitchen design, but online competition pressured margins. Together, format diversity ensured wide coverage across demographic tiers, anchoring the US electronics and appliance stores market in omnichannel flexibility.
By Ownership: Brands Seek Direct Consumer Links
Retail Chains commanded 65.02% of the 2025 turnover by pooling purchasing power and national marketing. Yet, Manufacturer-Branded Stores, expanding at 4.2% CAGR, let producers control storytelling and capture retail margins. Bosch, Samsung, and LG accelerated pilot showrooms in major metros to display full connected ecosystems, strengthening loyalty.
Franchisees blended corporate branding with local agility but faced fee-related headwinds. Independent Retailers turned to buying-group partnerships for leverage, specializing in luxury built-ins and installation services. Private-equity deal-making, such as IQVentures’ USD 504 million Aaron’s acquisition, highlighted investor belief that digital transformation can unlock value in under-modernized chains. These shifts injected fresh competition into the US electronics and appliance stores market.
By Sales Channel: Digital Share Accelerates, Stores Endure
Online Pure-Play platforms rose at a 4.8% CAGR, buoyed by BNPL’s 9-point lift in purchase incidence and 10% hike in ticket size. Amazon’s 19.2% appliance dollar share underscored the power of logistics and data at scale. Still, in-store sales kept a 70.85% share as shoppers valued tactile assessment for big-ticket items.
Click-and-Collect bridged digital convenience with immediate possession, aligning inventory economics for retailers. Mobile-app AR tools reduced return rates by visualizing fit and finish, reinforcing loyalty to chains like Best Buy. The channel mosaic reflected consumer desire for flexibility, ensuring each modality remains integral to the US electronics and appliance stores market.
Geography Analysis
Sun Belt dominance persisted as Texas, Florida, and North Carolina captured the lion’s share of new-construction-driven demand. These states benefited from population inflows, favorable regulations, and land availability, funneling large appliance sales through regional big-box outlets. Metropolitan zones such as Dallas-Fort Worth and Tampa recorded above-average smart-appliance penetration due to higher household incomes and technology affinity.
The Midwest and Rust Belt exhibited slower growth but steady replacement activity. Aging housing stock required energy-efficient upgrades, and IRA rebates mitigated upfront cost anxiety. Retailers tailored assortments to budget-minded consumers by emphasizing private-label value lines. Rural regions remained underserved for premium assortments, prompting Lowe’s to extend rural product offerings across 150 stores, widening reach.
West Coast markets led in sustainability adoption. California’s early-stage rebate allocation and strict efficiency codes prompted quick uptake of ENERGY STAR-certified devices. High concentrations of technology workers in San Francisco and Seattle fostered early experimentation with AI-powered appliances. Income dispersion across the United States shaped merchandising; premium brands clustered in affluent suburbs, while discount assortments met lower-income rural and exurban needs. This geographic tapestry remained a core consideration for retailers optimizing the broader US electronics and appliance stores market.
Regulatory Landscape
US electronics and appliance retail is shaped by overlapping federal and state rules spanning energy efficiency, device authorization, consumer disclosures, and repairability. On the energy side, the US Department of Energy (DOE) continues to anchor appliance energy conservation standards and related test procedures. In July 2026, the DOE is reviewing its Process Rule (10 CFR part 430, appendix A) to bring more certainty to how standards are developed and updated.
On the electronics side, Federal Communications Commission (FCC) equipment authorization requirements influence what connected products can be sold. As of July 2026, the FCC is considering rules that would require online marketplaces to display FCC IDs for certified RF devices, which would shift new compliance workflows into listings, product data, and seller onboarding. Retailers and manufacturers also face product safety, labeling, and trade compliance obligations, including third-party safety certifications from OSHA-recognized Nationally Recognized Testing Laboratories (NRTLs) such as UL, ETL, or CSA in many categories. Trade policy continues to affect landed costs, with Section 301 additional duties applied to many China-origin electronics depending on HTS classification. At the state level, right-to-repair laws add post-sale obligations around parts and documentation, with five states having enacted laws as of May 2025 (NY, MN, CA, OR, CO). Colorado HB 1121 takes effect January 1, 2026, restricting certain parts-pairing software practices that can affect serviceability and aftermarket repair economics.
Value Chain Analysis
The value chain starts with upstream materials and components, including steel and electronic control systems (chips, sensors, connectivity modules) that are especially critical for smart appliances and smart home devices. Midstream, OEMs such as Whirlpool, GE Appliances (Haier), Bosch, and Haier convert these inputs into finished goods and software-enabled product ecosystems. These products require ongoing firmware updates, app support, and RF certification to remain sellable across authorized channels. Logistics and import compliance sit between manufacturing and retail, and tariffs, including Section 301 duties on many China-origin goods, influence sourcing choices and assortment economics.
Downstream, products move through big-box retailers, specialty appliance stores, warehouse clubs, manufacturer-branded stores, and online pure-play platforms. Installation, haul-away, and service plans are key value-added layers for major appliances. As retailers expand marketplaces and omnichannel fulfillment, product data quality and compliance artifacts, including safety listings from NRTLs and potential FCC ID display requirements for online listings, increasingly become part of operational workflows. This can affect onboarding speed, listing accuracy, and returns. To manage cost and continuity, importers and brand owners use multi-country sourcing (for example, shifting some production to Vietnam, Malaysia, or Mexico) along with domestic capacity where available, balancing inventory risk against demand volatility and regulatory requirements.
Competitive Landscape
The structure of the US electronics and appliance stores market revealed a dual reality: Walmart and Amazon collectively held the majority of category revenue in 2024, dwarfing Best Buy’s revenue share despite its specialization. The scale of general merchandisers enabled price leadership and nationwide same-day logistics. Best Buy adapted by doubling down on membership services and experience-centric stores.
Strategic investments in professional contractors reshaped competitive moats. Home Depot’s USD 18.25 billion SRS Distribution purchase and subsequent USD 4.3 billion GMS buyout enlarged its pro-sales footprint, boosting bundled appliance installation offers. Lowe’s announced AI-enabled cost-savings targets of USD 1 billion under its Total Home Strategy. Vertical integrations continued as Walmart agreed to acquire Vizio for USD 2.3 billion, aiming to harness ad revenue through connected televisions.[4]
Emerging challengers focused on direct-to-consumer and subscription maintenance. Appliance brands opened flagship showrooms to capture end-user data, while fintech partners financed service bundles. White-space opportunities lie in rural territories and e-waste collection compliance services. Competitive intensity, therefore, remained high, compelling retailers to balance price, service, and technology to sustain share inside the evolving US electronics and appliance stores market.
United States Electronics And Appliance Stores Industry Leaders
-
Haier
-
Philips
-
Bosch
-
GE Appliance
-
Whirlpool
- *Disclaimer: Major Players sorted in no particular order
Market Opportunities and Future Outlook
Energy-efficiency upgrades create a monetization path for retailers that can turn incentives into point-of-sale bundles. The Inflation Reduction Act includes appliance electrification and efficiency incentives, with programs citing up to USD 14,000 per household for qualifying upgrades. That supports retailer offerings that pair eligible products with installation, electrical work coordination, and haul-away, which helps store formats and service models simplify compliance and paperwork while increasing mix toward higher-efficiency SKUs.
Compliance-driven differentiation is also growing as online marketplaces face tighter scrutiny. As of July 2026, the FCC is considering requirements for online marketplaces to display FCC IDs for certified RF devices, while state-level right-to-repair rules are expanding (five enacted by May 2025, with additional bills referenced for 2026). That raises the value of repair parts availability, documentation, and service networks for connected appliances. Retailers with strong product-information management, authorized-seller controls, and in-house or partner service capabilities have room to reduce friction for connected-device purchases and improve post-sale support, while also capturing incremental revenue from warranties, repairs, and trade-in or recycling programs.
Recent Industry Developments
- May 2026: The launch of Haier I-Pro Shine Series dishwasher range featuring heat pump technology and AI powered auto dosing expands premium, energy efficient dishwashers in NA market. The rollout strengthens premiumization and smart feature leadership in North America.
- May 2026: BSH Home Appliances Corporation maintains its North American footprint under the BSH Group banner with a turnover of 15 billion euros as of March 2026. The scale of NA operations and digital services emphasis reinforces digital service integration and market footprint in US/NA region.
- May 2026: GE Appliances (Haier) LA recall, Louisville Appliance Park manufacturing footprint supported by 2 billion dollars in total investments since 2016. The domestic manufacturing capacity in US enhances supply resilience and service coverage in key NA market.
Research Methodology Framework and Report Scope
Market Definition and Coverage
This market covers revenues generated by US retail stores that sell consumer electronics and home appliances, including sales completed in-store and sales fulfilled through store-led digital routes (such as click-and-collect). Our sizing reflects the selling activity of electronics and appliance store formats within the United States.
Scope exclusions: We exclude pure-play online marketplaces without a store base and manufacturer direct-to-consumer sales that do not route through an electronics and appliance store.
Segmentation Overview
- By Product Category
- Major Appliances
- Small Appliances
- Consumer Electronics
- Smart Home Devices
- By Store Type
- Big-Box Retailers
- Specialty Appliance Stores
- Flagship Experience Centers
- Warehouse Clubs
- Discount Outlets
- By Ownership
- Retail Chains
- Franchisees
- Independent Retailers
- Manufacturer-Branded Stores
- By Sales Channel
- In-Store Sales
- Click-and-Collect
- Online Pure-Play Platforms
- Mobile App
Data Sources, Market Sizing, and Validation
Desk Research
Desk research was used to set the frame for store-based retail and to anchor the model to measurable signals. Public sources helped us understand the direction of demand and replacement cycles, such as US Census Bureau retail trade data, Bureau of Labor Statistics inflation and price indexes, Energy Information Administration context for energy costs, and ENERGY STAR program data on efficient appliance uptake. We also used sources such as National Association of Home Builders housing starts and remodeling indicators to connect housing activity with appliance replacement and upgrade demand.
On the supply and channel side, we reviewed company filings, investor presentations, and retailer announcements to confirm category mix, promotion intensity, and store network movements. Where useful, paid subscriptions for company financials and intelligence, news and financials, and patent databases were used to cross-check product innovation cadence and major corporate actions that can shift sales. These sources are illustrative only, and many other references were consulted to collect data, validate assumptions, and clarify open questions.
Primary Interviews and Surveys
Primary work was used to test what the desk signals could not fully explain, especially the split between in-store, click-and-collect, and app-led sales within store-based retailers. We spoke with a mix of store operations leaders, merchandising teams, supplier-facing roles, and category managers to validate pricing moves, promotion depth, attachment services, and how shoppers are shifting across channels within the United States.
Distribution of primary research fieldwork respondents
| Company type | Respondent position |
|---|---|
| Top tier: 39% | CXOs: 20% |
| Mid tier: 41% | Functional/Unit leaders: 27% |
| Smaller Players: 20% | Managers: 53% |
Market-Sizing & Forecasting
For sizing, we used a top-down build that starts from official retail sales signals and then reconstructs the portion attributable to electronics and appliance store formats, followed by a split across store-led channels. Once that total was shaped, it was corroborated with selective bottom-up checks, such as sampled store revenue per location, category-led ASP and unit ranges, and channel checks on online order fulfillment tied to store networks.
Key inputs that were tracked and adjusted include comparable-store sales direction, store count changes and closures, the in-store versus pickup mix, major appliance replacement timing linked to housing activity, and pricing pressure captured through relevant CPI movements. We also layered in promotion intensity and financing availability as practical indicators that impact ticket size and conversion. When bottom-up visibility was uneven, gaps were handled by applying conservative per-store ranges informed by interviews, and then re-tested against the top-down total until variances were explainable.
Forecasting relied mainly on scenario analysis, since housing, discretionary spending, and promotional cycles can shift quickly, and those shifts are not always captured cleanly in a single time-series curve. The scenarios were driven by interview-based expectations for channel mix, price normalization, and replacement demand, and then smoothed into annual outlooks that match realistic retail operating cycles.
Data Validation & Update Cycle
Outputs are checked through triangulation across independent signals, including retail sales direction, store network movement, and pricing inflation, and then compared against what interviewees report on category momentum. When a major variance shows up, we revisit the assumption that caused it, and respondents may be re-contacted to confirm whether the change is real or just timing noise.
Before sign-off, the model is reviewed in steps, with anomaly checks at the input level and at the final market total so that the logic is consistent from year to year. Reports are refreshed annually, and interim updates are made when material events occur (such as large store closure waves or major policy changes that affect appliance demand). Right before delivery, a final pass is performed so clients receive the most current view available.
Mordor Intelligence's United States Electronic Appliance Stores Market Estimate Compared With Other Published Estimates
Published market sizes for this space often do not match because the same retail demand can be counted under different umbrellas, and because some sources mix store retailing with broader consumer electronics and appliances spending. Differences also come from whether estimates reflect store-based selling only, how services and parts are treated, and what year is used for price and currency timing.
Pure-play e-commerce electronics and appliance sales sit outside Mordor Intelligence's scope here, which is why broader retail industry figures that blend store channels with online-only sellers can look materially larger. Another common gap driver is whether the figure is built from retail trade baselines and then split into store formats, or whether it is compiled from company revenue groupings that may include adjacent activities. Finally, refresh cadence matters in retail, because promotions and store closures can swing results quickly even when the long-term demand story stays steady.
Benchmark comparison
| Source | Market Size | Gaps in Research Methodology |
|---|---|---|
| Mordor Intelligence | USD 92.61 B (2025) | |
| Industry Publisher A | USD 114.40 B (2025) | Uses a broader electronics and appliance stores sector view that can include repair services and related add-ons more expansively, and it may treat store-led and non-store selling differently, which lifts the total. |
| Industry Analytics B | USD 92.60 B (2024) | Uses a different base year and a mixed product framing that can blend store retailing with end-user demand categories, which can shift totals when pricing and channel shares change year to year. |
Looking at the three figures together, the spread is mainly explained by scope breadth and timing, not by arithmetic. When store-based retail is separated from online-only selling and the same year is compared, the numbers tend to converge and become easier to reconcile with observable retail and housing indicators.
Key Questions Answered in the Report
What is the current size of the US electronics and appliance stores market?
The US electronics and appliance stores market size reached USD 95.9 billion in 2026.
How fast is the market expected to grow?
It is forecast to expand at a 3.55% CAGR, touching USD 114.15 billion by 2031.
Which segment is growing the fastest?
Smart Home Devices lead with a 5.2% CAGR through 2031 as consumers adopt connected, energy-efficient products.
How do federal rebates influence demand?
The Inflation Reduction Act offers up to USD 14,000 per household for efficient upgrades, channeling purchases toward premium appliances and supporting long-term growth.
What risks could slow market expansion?
Persistent semiconductor shortages and heightened price sensitivity amid inflation could trim the growth trajectory by roughly 1.1 percentage points combined.