United States Electric Vehicle Battery Manufacturing Market Size and Share
Market Overview
| Study Period | 2021 - 2031 |
|---|---|
| Forecast Data Period | 2026 - 2031 |
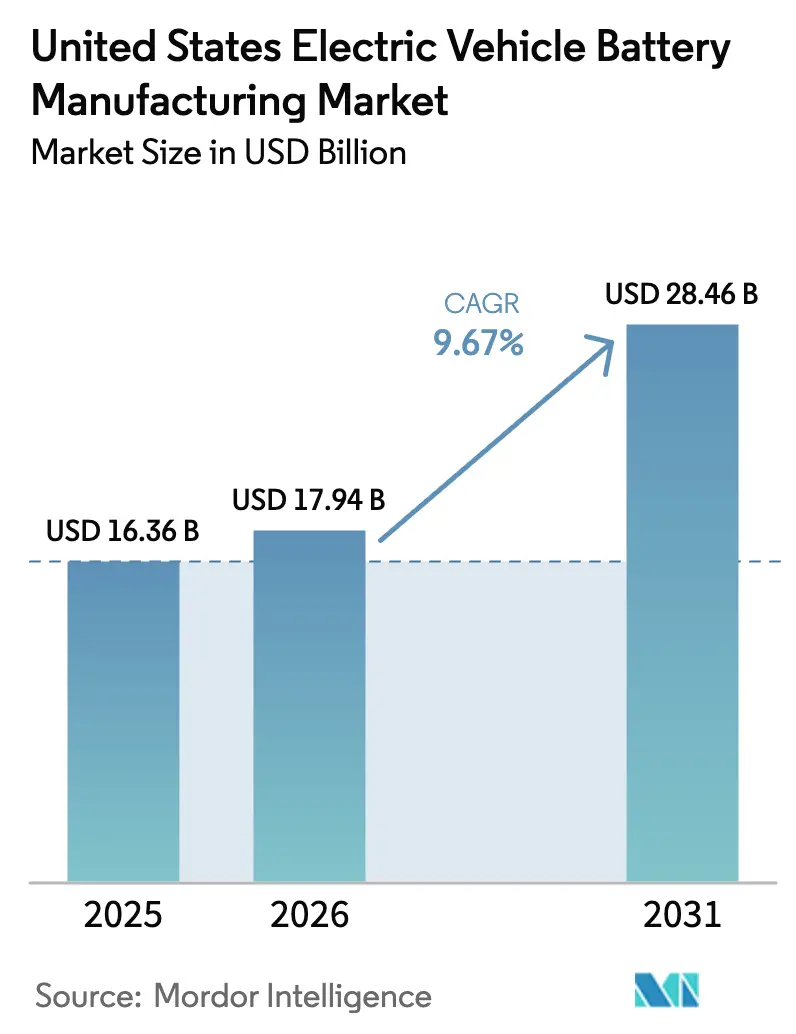
| Base Year Market Size (2025) | USD 16.36 Billion |
| Market Size (2026) | USD 17.94 Billion |
| Market Size (2031) | USD 28.46 Billion |
| Growth Rate (2026 - 2031) | 9.67% CAGR |
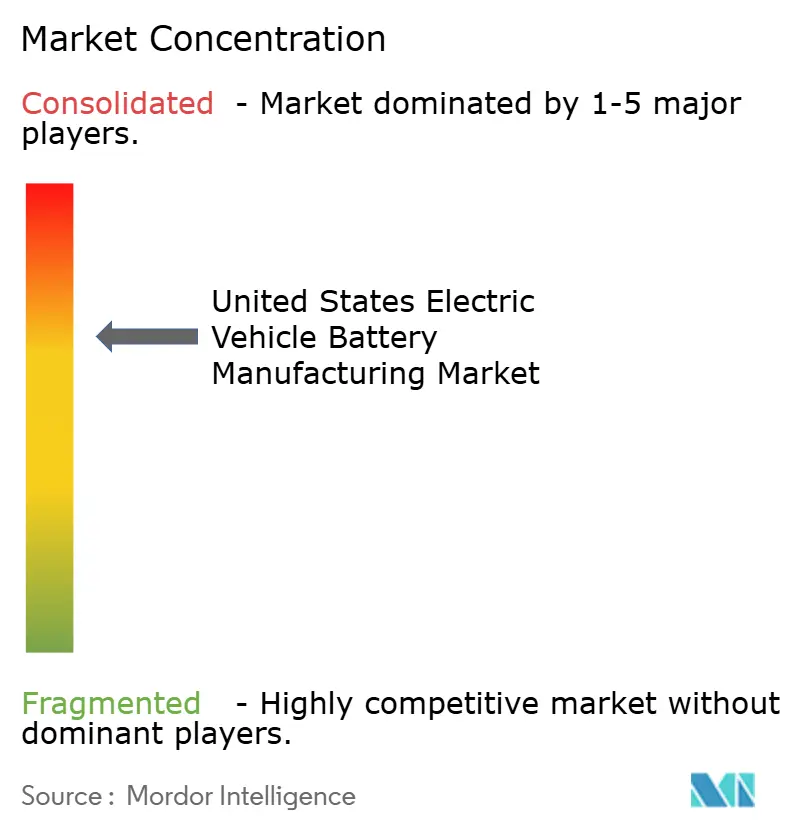
| Market Concentration | Medium |
Major Players *Disclaimer: Major Players sorted in no particular order Image © Mordor Intelligence. Reuse requires attribution under CC BY 4.0. | |
United States Electric Vehicle Battery Manufacturing Market Analysis by Mordor Intelligence
The United States Electric Vehicle Battery Manufacturing Market size in 2026 is estimated at USD 17.94 billion, growing from 2025 value of USD 16.36 billion with 2031 projections showing USD 28.46 billion, growing at 9.67% CAGR over 2026-2031.
Current momentum in the US EV battery manufacturing market stems from Section 45X production credits, which award USD 35 per kilowatt-hour for cells and USD 10 per kilowatt-hour for modules, prompting more than 1 TWh of announced gigafactory capacity and shifting global suppliers toward US joint ventures that accelerate technology transfer and shorten launch cycles.[1]U.S. Department of Energy, “Inflation Reduction Act, Section 45X Manufacturing Credits,” energy.gov Automakers now bundle cell, module, and pack programs inside vertically integrated plants, integrating large-format 4680 cylindrical or high-density prismatic cells to cut assembly complexity and improve volumetric efficiency. Solid-state, lithium-sulfur, and sodium-ion pilots are maturing, and state-level grants for critical-mineral recycling have compressed permitting timelines, which together widen long-term opportunities across the US EV battery manufacturing market. At the same time, risks remain around graphite-anode imports, Midwest labor shortages, rising LFP royalty costs, and multi-year grid-interconnection delays, each of which could moderate near-term expansion if left unresolved.
Key Report Takeaways
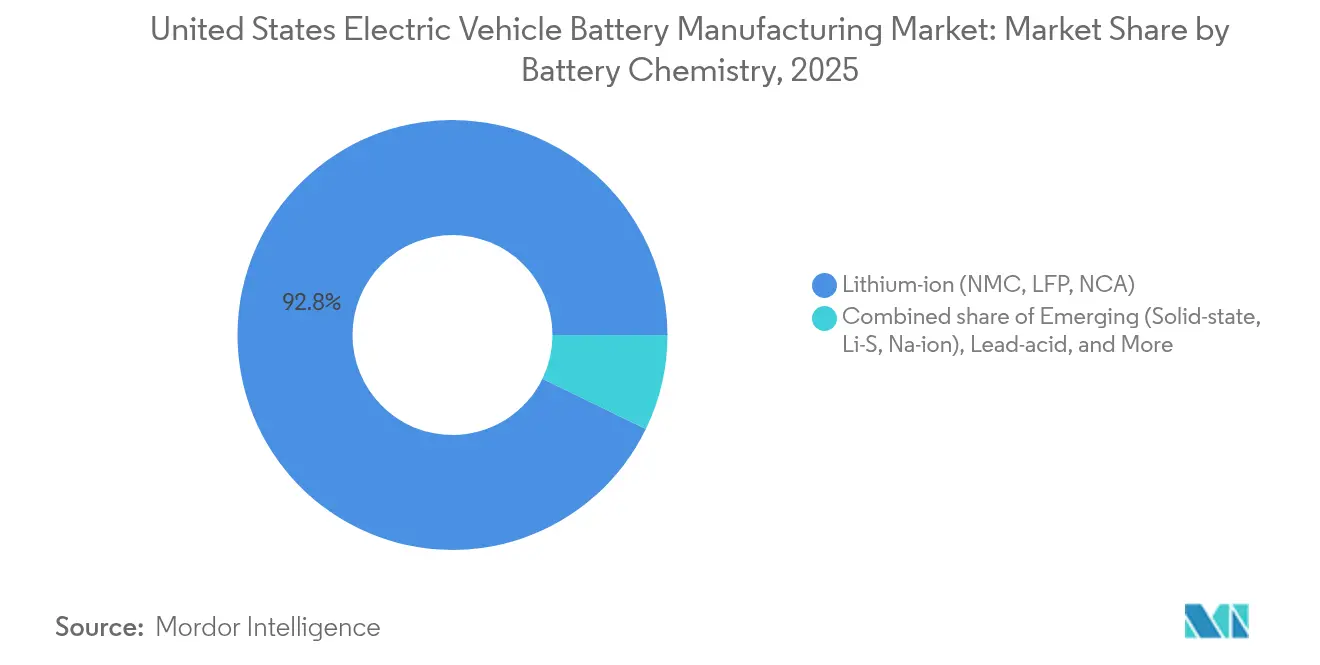
- By battery chemistry, lithium-ion commanded 92.80% of the US EV battery manufacturing market share in 2025, while solid-state, lithium-sulfur, and sodium-ion are on track for a 29.1% CAGR through 2031.
- By cell format, cylindrical cells led with 54.40% share of the US EV battery manufacturing market size in 2025, while prismatic cells are forecast to expand at 26.9% CAGR to 2031.
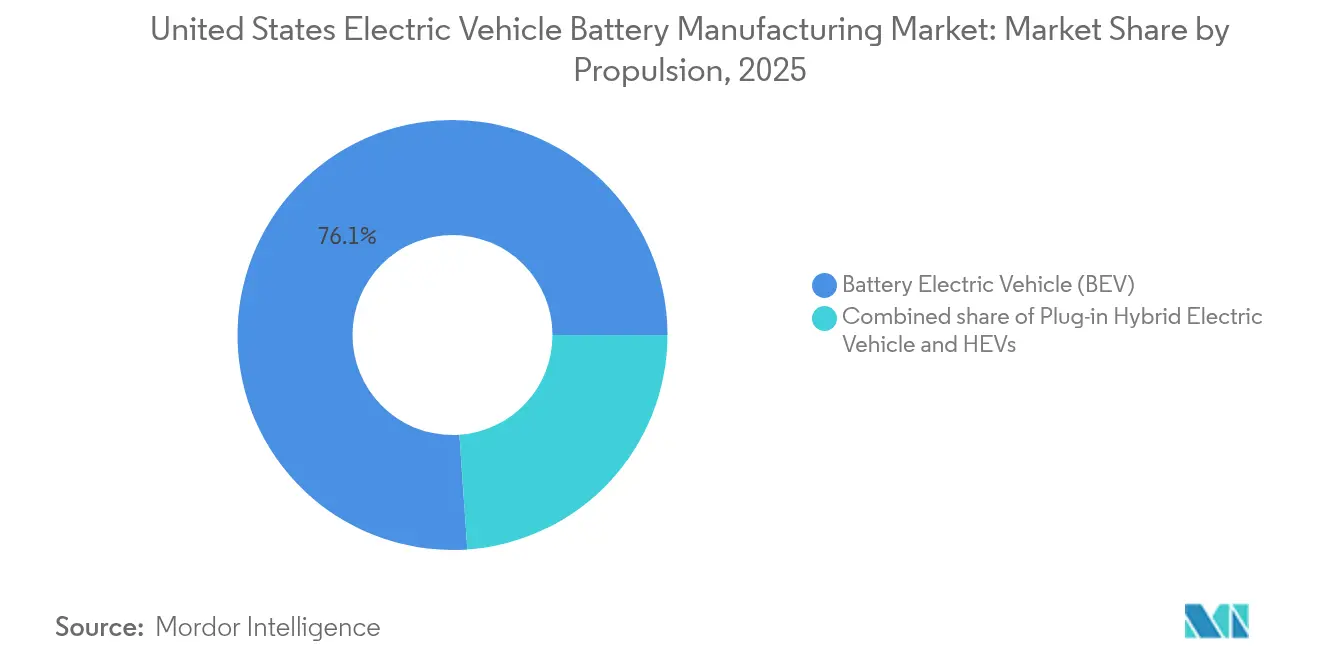
- By propulsion type, battery electric vehicles captured 76.10% share of the US EV battery manufacturing market size in 2025, and the same segment is projected to grow at 10.9% CAGR over the forecast period.
- By vehicle type, passenger cars accounted for 71.90% of the US EV battery manufacturing market share in 2025, whereas medium and heavy trucks represent the fastest-growing segment at 23.9% CAGR.
Note: Market size and forecast figures in this report are generated using Mordor Intelligence’s proprietary estimation framework, updated with the latest available data and insights as of 2026.
United States Electric Vehicle Battery Manufacturing Market Trends and Insights
Drivers Impact Analysis*
| Driver | (~) % Impact on CAGR Forecast | Geographic Relevance | Impact Timeline |
|---|---|---|---|
| IRA-driven on-shoring of battery gigafactories | +2.8% | National, concentrated in Michigan, Ohio, Tennessee, Georgia, Kentucky | Medium term (2-4 years) |
| OEM pressure for 4680 & large-format cell adoption | +1.5% | National, led by Texas, Nevada, Michigan | Medium term (2-4 years) |
| Commercial-fleet demand for >150 kWh packs | +1.2% | National, early gains in California, Texas, Northeast corridor | Long term (≥ 4 years) |
| State-level incentives for critical-mineral recycling | +0.9% | Regional, strongest in Nevada, Arizona, Tennessee, Georgia | Long term (≥ 4 years) |
| Solid-state pilot lines reaching 5 GWh by 2028 | +0.7% | Regional, concentrated in Colorado, California, Michigan | Long term (≥ 4 years) |
| Sodium-ion chemistry for LCVs in Sun-belt states | +0.6% | Regional, Sun-belt states (Texas, Arizona, California, Florida) | Medium term (2-4 years) |
| Source: Mordor Intelligence | |||
IRA-Driven On-Shoring of Battery Gigafactories
Section 45X credits raise pre-tax margins by up to 15% on every kilowatt-hour produced, which has unlocked USD 73 billion of new factory commitments across 12 states. Twenty-five multi-gigawatt projects are already in construction or advanced permitting, and Treasury guidance excluding “foreign entities of concern” has forced Asian suppliers to partner locally, anchoring capacity where vehicles are assembled.[2]U.S. Department of the Treasury, “Domestic Content Guidance for Clean Vehicle Credits,” home.treasury.gov
OEM Pressure for 4680 & Large-Format Cell Adoption
Automakers favor larger cylindrical and prismatic designs to streamline pack structures and boost energy throughput. Tesla’s tabless 4680 reduces internal resistance by 14%, GM’s 102 Ah prismatic cell enables wireless battery-management systems, and Ford’s structural pack integrates directly into the vehicle frame, each example reflecting tighter cell-to-vehicle integration that compresses bill-of-materials cost and improves thermal performance.[3]Tesla Inc., “2024 Battery Day Updates,” tesla.com
Commercial-Fleet Demand for >150 kWh Packs
Regional-haul trucks need a 200-mile laden range, driving pack sizes beyond 150 kWh, and pulling incremental cell demand into the US EV battery manufacturing market. Operators absorb higher sticker prices because fuel and maintenance savings shorten payback periods to under four years, especially when a single federal voucher covers up to USD 40,000 per Class 8 truck.[4]U.S. Environmental Protection Agency, “Clean Heavy-Duty Vehicle Program Overview,” epa.gov
State-Level Incentives for Critical-Mineral Recycling
Nevada’s AB 190, Tennessee’s Green Minerals Act, and Arizona’s expedited reviews compress time-to-market for hydrometallurgical plants, allowing recyclers like Redwood Materials and Ascend Elements to supply 95%-purity cathode material at costs 20% below virgin mining, supporting circular supply-chain models in the US EV battery manufacturing market.
Restraints Impact Analysis*
| Restraint | (~) % Impact on CAGR Forecast | Geographic Relevance | Impact Timeline |
|---|---|---|---|
| Short-term graphite anode bottlenecks | -1.4% | National, acute in Michigan, Tennessee, Georgia | Short term (≤ 2 years) |
| Midwest skilled-labor scarcity for gigafactory ramp-up | -1.1% | Regional, concentrated in Michigan, Ohio, Indiana, Kentucky | Medium term (2-4 years) |
| Volatile LFP patent-licensing costs | -0.8% | National, affecting all LFP adopters | Medium term (2-4 years) |
| Grid-connection delays for new cell plants | -0.9% | Regional, PJM and MISO territories | Short term (≤ 2 years) |
| Source: Mordor Intelligence | |||
Short-Term Graphite Anode Bottlenecks
Domestic anode projects cover only 5% of 2025 demand, and elevated Section 301 tariffs raise landed costs for Chinese graphite by USD 2,000 per ton. Although Novonix and Syrah are ramping up US plants, total output remains far below the 150,000-ton requirement projected for 2026, exposing gigafactories to import risk and dampening early-stage growth in the US EV battery manufacturing market.
Midwest Skilled-Labor Scarcity for Gigafactory Ramp-Up
More than 18,000 battery technician and process-engineer positions remained vacant in late 2024, with turnover exceeding 12% at new facilities. Automakers fund community-college programs and offer five-figure signing bonuses, but training cycles trail plant start-up schedules, putting pressure on first-pass yield targets and elevating ramp-up costs across the US EV battery manufacturing market.
*Our updated forecasts treat driver/restraint impacts as directional, not additive. The revised impact forecasts reflect baseline growth, mix effects, and variable interactions.
Segment Analysis
By Battery Chemistry: Emerging Platforms Challenge Li-Ion Hegemony
Lithium-ion retained 92.80% US EV battery manufacturing market share in 2025, underpinned by mature NMC, LFP, and NCA production ecosystems that satisfy automaker assurance requirements for safety and range. The US EV battery manufacturing market size for emerging solid-state, lithium-sulfur, and sodium-ion chemistries is now scaling at 29.1% CAGR as pilot lines resolve yield and cost hurdles, allowing OEMs to diversify beyond conventional chemistries and hedge cobalt exposure. A second growth engine lies in LFP’s low-cost, thermally stable profile, which Tesla and Ford deploy in fleet vans and entry-level trims. By 2030, diversified cathode mixes should improve supply resilience and flatten cost curves for the broader US EV battery manufacturing market.
Commercial-scale solid-state lines promise 400 Wh/kg energy density and 10-minute charge times, yet scrap rates above 30% keep near-term pack costs roughly USD 200 per kWh higher than liquid-electrolyte benchmarks. Lithium-sulfur cells offer theoretical densities near 500 Wh/kg, but cycle-life degradation limits automotive uptake, confining early demand to aerospace. Sodium-ion’s 160 Wh/kg density and 50,000-cycle durability make it a compelling fit for last-mile vans in warm climates, and two US plants already ship cells to pilot fleets. Taken together, these advances widen the technology funnel and position the US EV battery manufacturing market for multi-chemistry growth.
Note: Segment shares of all individual segments available upon report purchase
By Cell Format: Prismatic Gains Ground on Structural Integration
Cylindrical cells held 54.40% of 2025 volume, benefiting from entrenched 18650 and 2170 output and Tesla’s 4680 ramp, yet prismatic cells are expanding at 26.9% CAGR as carmakers embrace cell-to-pack layouts that eliminate module housings and cut mass. The US EV battery manufacturing market size for prismatic formats is thus compounding faster than the cylindrical supply, helped by GM’s 102 Ah cell and Ford’s Lightning packs that integrate directly into the vehicle frame. Wireless battery-management networks slash harness weight, and higher volumetric density raises pack energy by 15% within the same footprint.
Pouch cells remain relevant for flexible packaging but suffer from swelling, which demands compression frames and adds mass. Prismatic adoption, by contrast, supports 800-volt systems that enable 18-minute 10-to-80% charging and dovetails with large SUV and pickup architectures. Over the forecast period, prismatic cells are expected to challenge cylindrical dominance in the US EV battery manufacturing market as automakers prioritize manufacturing throughput and structural battery designs.
By Propulsion: BEV Dominance Spans Segments
Battery electric vehicles captured 76.10% of propulsion-linked demand in 2025, buoyed by federal tax credits, corporate fleet mandates, and rapid DC fast-charging build-outs. The US EV battery manufacturing market size dedicated to BEV packs will climb alongside an 10.9% CAGR, outpacing PHEV and HEV categories whose relevance erodes as upfront BEV prices close on gasoline equivalents. California’s Advanced Clean Cars II regulation, plus aligned ZEV mandates in other states, underpins baseline demand and guides OEM production allocations.
Plug-in hybrids constituted 18.30% of 2025 propulsion demand, concentrated in premium nameplates that leverage federal purchase incentives while offering gasoline fallback. However, as battery costs decline and fast-charger density increases, these dual-powertrain models lose cost advantage. Hybrid electrics with sub-2 kWh batteries retain modest market presence for fuel efficiency but contribute little to the manufacturing value pool, reinforcing BEV leadership across the US EV battery manufacturing market.
Note: Segment shares of all individual segments available upon report purchase
By Vehicle Type: Medium and Heavy Trucks Accelerate Electrification
Passenger cars retained 71.90% of the US EV battery manufacturing market share in 2025, but medium and heavy trucks represent the most dynamic opportunity with a 23.9% CAGR through 2031. Fleet operators justify large battery packs through lower energy and maintenance outlays, especially under the Clean Heavy-Duty Vehicle Program. Class 8 tractors need 300-600 kWh packs, translating to high cell pull-through that lifts the entire US EV battery manufacturing market size.
Light commercial vans and pickups also benefit from predictable duty cycles and incentive support, driving adoption of 80-150 kWh packs. Buses and coaches, backed by Federal Transit Administration grants covering up to 80% of incremental cost, add further baseline volume. Combined, these commercial segments create a diversified demand mix that stabilizes unit volumes and insulates the US EV battery manufacturing market from light-duty consumer swings.
Geography Analysis
Gigafactory construction is clustering into five corridors: the Great Lakes, the Mid-South, the Southeast, the Sun-belt, and the Mountain West. Michigan, Ohio, Kentucky, Tennessee, and Georgia host projects totaling 650 GWh of nameplate capacity by 2030, drawn by legacy automotive ecosystems and favorable state grants that run as high as USD 200 million per project in Michigan. Tennessee’s 0% corporate tax on manufacturing pairs with expedited environmental reviews, cutting timelines by up to 12 months and reinforcing its pull on the US EV battery manufacturing market.
Georgia and South Carolina anchor Southeast investment, where Hyundai, SK On, and Rivian combine cell and vehicle plants to lock in domestic-content credits. Hyundai’s Bryan County Metaplant will pair 35 GWh of cells with 300,000 vehicles yearly, using state and local incentives worth USD 1.8 billion to lower capital intensity. In the Sun-belt, Texas, Arizona, and Nevada marry abundant solar resources with warm temperatures that cut heating costs for climate-controlled dry rooms, and Tesla’s Texas facility alone targets 100 GWh of 4680 output. Mountain-West states such as Colorado and Nevada lead advanced-chemistry commercialization, using university partnerships and lithium resource proximity to attract solid-state pilots. California remains the nexus for R&D and pilot lines, despite high costs, with Stanford and UC Berkeley helping generate 40% of US battery patents. This geographic spread diversifies risk and provides regional supply bases that reduce logistics mileage, all supporting the US EV battery manufacturing market as volumes scale.
Competitive Landscape
The top five suppliers, LG Energy Solution, SK On, Panasonic Energy, Samsung SDI, and Tesla, held about 65% of the installed 2024 capacity, giving the US EV battery manufacturing market a moderate concentration profile. Joint ventures dominate: GM-LG Energy Ultium Cells, Ford-SK On BlueOval SK, and Stellantis-Samsung SDI anchor captive supply and allow automakers to capture Section 45X credits directly. This approach compresses cell-maker margins but guarantees offtake volumes necessary to finance multi-billion-dollar plants.
Chinese leaders face “foreign entity of concern” restrictions, yet licensing arrangements such as CATL’s technology-transfer deal for Ford’s Michigan LFP plant preserve market access without controlling stakes. White-space lies in solid-state commercialization, recycling, and sodium-ion scale-up, where startups like QuantumScape, Redwood Materials, and Natron Energy have raised sizeable funding and secured OEM trials. Process technologies, dry-electrode coating, laser welding, and AI quality control are emerging battlegrounds that can lower capital intensity by up to 25% and drive first-pass yield above 97%, differentiating scalable contenders inside the US EV battery manufacturing market.
United States Electric Vehicle Battery Manufacturing Industry Leaders
Tesla (Panasonic JV)
LG Energy Solution
SK On
Samsung SDI
AESC Envision
- *Disclaimer: Major Players sorted in no particular order
Recent Industry Developments
- December 2025: A Dallas-based battery technology firm secured a grant from the Department of Energy, courtesy of ARPA-E's competitive OPEN program. This funding aims to propel the company's research into producing graphite from biomass-derived carbon through electrochemical methods.
- December 2025: LG Energy Solution inked a deal valued at approximately 2 trillion won (USD1.4 billion) with Mercedes-Benz Group AG. This agreement not only underscores the strengthening ties between the South Korean battery manufacturer and the German automotive giant but also marks a pivotal step in the EV landscape. Spanning from March 1, 2028, to June 30, 2035, the battery supply deal focuses on deliveries set for North America and Europe.
- December 2025: Natrion, a lithium battery component manufacturer, established a production facility in Western New York. This site is poised to supply components for as many as 11,000 electric vehicles annually.
- March 2025: SK On inked a deal with Nissan to bolster the latter's electric vehicle (EV) production in North America. The agreement stipulates that from 2028 to 2033, SK On will deliver close to 100 GWh of advanced, high-nickel batteries to Nissan.
United States Electric Vehicle Battery Manufacturing Market Report Scope
Electric vehicle (EV) battery manufacturing involves designing, producing, and assembling batteries for EVs. The process starts with sourcing raw materials like lithium, cobalt, and nickel. These materials are then used to create individual battery cells, which are grouped into modules.
The United States electric vehicle battery manufacturing market is segmented by battery chemistry, cell format, propulsion, and vehicle type. By battery chemistry, the market is segmented into lithium-ion (NMC/LFP/NCA), emerging (solid-state/Li-S/Na-ion), lead-acid, and nickel-metal-hydride. By cell format, the market is segmented into cylindrical, prismatic, and pouch. By propulsion type, the market is segmented into battery electric vehicle (BEV), plug-in hybrid electric vehicle (PHEV), and hybrid electric vehicle (HEV). By vehicle type, the market is segmented into passenger cars, light commercial vehicles, medium/heavy trucks, buses, and two/three-wheelers. The report offers the market size in value terms in USD for all the abovementioned segments.
| Lithium-ion (NMC, LFP, NCA) |
| Emerging (Solid-state, Li-S, Na-ion) |
| Lead-acid |
| Nickel-metal-hydride |
| Cylindrical |
| Prismatic |
| Pouch |
| Battery Electric Vehicle (BEV) |
| Plug-in Hybrid Electric Vehicle (PHEV) |
| Hybrid Electric Vehicle (HEV) |
| Passenger Cars |
| Light Commercial Vehicles |
| Medium and Heavy Trucks |
| Buses and Coaches |
| Two and Three-wheelers |
| By Battery Chemistry | Lithium-ion (NMC, LFP, NCA) |
| Emerging (Solid-state, Li-S, Na-ion) | |
| Lead-acid | |
| Nickel-metal-hydride | |
| By Cell Format | Cylindrical |
| Prismatic | |
| Pouch | |
| By Propulsion | Battery Electric Vehicle (BEV) |
| Plug-in Hybrid Electric Vehicle (PHEV) | |
| Hybrid Electric Vehicle (HEV) | |
| By Vehicle Type | Passenger Cars |
| Light Commercial Vehicles | |
| Medium and Heavy Trucks | |
| Buses and Coaches | |
| Two and Three-wheelers |
Key Questions Answered in the Report
How large is the United States electric battery manufacturing market today?
The United States electric battery manufacturing market size reached USD 17.94 billion in 2026 and is set to climb to USD 28.46 billion by 2031 at a 9.67% CAGR.
What is the projected US EV battery manufacturing capacity by 2031?
Announced projects now exceed 1 TWh of planned nameplate output, with 650 GWh already committed across Michigan, Tennessee, Georgia, Ohio, and Kentucky clusters and the balance spread among Sun-belt and Mountain-West sites.
How do Section 45X production credits influence cell cost structures?
The IRA credit of USD 35 per kWh for cells and USD 10 per kWh for modules can lift pre-tax margins by up to 15%, creating the economic headroom that underpins most gigafactory business cases and accelerates payback on capital outlays.
Which cell format is expected to grow fastest through 2031?
Prismatic cells are forecast to expand at a 26.9% CAGR through 2031 as automakers adopt cell-to-pack architectures that eliminate module housings and raise volumetric energy density by roughly 15% over cylindrical alternatives.
What supply-chain bottleneck could most affect gigafactory ramp-up in the next two years?
Graphite anode availability is the most acute near-term constraint; domestic plants will cover only 5% of 2025 need, leaving producers exposed to tariff-laden imports from China and risking output shortfalls until U.S. projects scale.
How will medium and heavy trucks affect battery demand by 2031?
Class 6-8 electric trucks are on a 23.9% CAGR trajectory, each requiring 300-600 kWh packs; their rapid adoption will add disproportionately high kilowatt-hour pull-through despite lower unit volumes than passenger cars.
Where are the leading regional clusters for EV battery gigafactories in the United States?
The Great Lakes and Mid-South corridors dominate, led by Michigan, Ohio, Kentucky, and Tennessee, while the Southeast (Georgia, South Carolina), Sun-belt (Texas, Arizona, Nevada), and Mountain West (Colorado, Nevada) round out a multi-hub footprint that reduces logistics mileage and captures state-level incentives.


