Market Overview
| Study Period | 2017 - 2029 |
|---|---|
| Base Year For Estimation | 2024 |
| Forecast Data Period | 2025 - 2029 |
| Market Size (2025) | USD 468.6 Million |
| Market Size (2029) | USD 820.6 Million |
| Growth Rate (2025 - 2029) | 15.04% CAGR |
| Market Concentration | High |
Major Players*Disclaimer: Major Players sorted in no particular order Image © Mordor Intelligence. Reuse requires attribution under CC BY 4.0. |
|

United States Electric Bus Market Analysis by Mordor Intelligence
The United States Electric Bus Market size is estimated at 468.6 million USD in 2025, and is expected to reach 820.6 million USD by 2029, growing at a CAGR of 15.04% during the forecast period (2025-2029).
The United States electric bus industry is experiencing significant transformation driven by robust electric bus infrastructure development and technological advancement. The nation's commitment to sustainable public transport is evident through the rapid expansion of electric bus charging infrastructure, with publicly available charging stations reaching 128,000 in 2022. Major electric bus companies are investing heavily in research and development to enhance battery technology, improve vehicle range, and optimize operational efficiency. The industry is witnessing increased collaboration between traditional automakers and technology companies to accelerate innovation in electric bus powertrain systems, autonomous driving capabilities, and smart charging solutions. These partnerships are crucial in addressing technical challenges and improving the overall performance of battery electric bus systems.
Manufacturing capacity expansion and localization efforts are reshaping the industry landscape. In May 2023, Lion Electric inaugurated the United States' largest all-electric medium and heavy-duty vehicle manufacturing plant in Illinois, marking a significant milestone in domestic production capabilities. This expansion is complemented by strategic investments in battery manufacturing facilities and component supply chains. The industry is seeing a trend toward vertical integration, with manufacturers increasingly bringing critical component production in-house to better control quality and reduce dependencies on external suppliers. These developments are strengthening the domestic supply chain and creating new employment opportunities in the clean transportation sector.
The market structure is evolving through strategic consolidations and partnerships, reflecting the industry's maturation. Leading manufacturers are pursuing strategic alliances and financial restructuring to strengthen their market positions. For instance, in July 2023, Lion Electric secured approximately $142 million in combined financing to support its growth initiatives. The industry is characterized by a mix of established players and innovative startups, with companies like Proterra maintaining a significant market presence with a 25.6% share in 2023. These dynamics are fostering healthy competition while encouraging collaboration on standardization and interoperability initiatives.
Technological innovation continues to drive industry advancement, particularly in battery systems and electric bus charging infrastructure. Manufacturers are focusing on developing next-generation battery technologies that offer improved energy density, faster charging capabilities, and longer operational lifespans. The industry is witnessing increased adoption of smart charging solutions and vehicle-to-grid (V2G) technologies, enabling better grid integration and energy management. Advanced telematics and fleet management systems are being incorporated to optimize route planning, maintenance scheduling, and overall operational efficiency. These technological advancements are crucial in addressing range anxiety and operational concerns while improving the total cost of ownership for electric bus fleet operators.
United States Electric Bus Market Trends and Insights
Rapid growth in electric vehicle sales driven by government initiatives and increasing demand in the US
- The United States has witnessed a significant surge in the adoption of electric vehicles (EVs) in recent years. This uptick can be attributed to a heightened awareness of EVs, growing environmental concerns, and the implementation of government regulations. Notably, in 2016, California introduced the Zero-Emission Vehicle (ZEV) program aimed at curbing carbon emissions and improving air quality. This initiative has not only spurred the growth of electric cars within California but has also influenced other states to adopt similar ZEV regulations. Consequently, the nation saw a remarkable 634% surge in demand for battery electric vehicles (BEVs) from 2017 to 2022.
- The demand for electric commercial vehicles in the United States is also on the rise. Factors such as the booming e-commerce industry, increased logistics activities, and governmental initiatives for cleaner transportation have fueled this growth. In a significant move, the governor of New York signed the Advanced Clean Truck (ACT) Rule in September 2021. This rule sets a target for all new light-duty vehicles to be zero-emission by 2035 and the same for medium- and heavy-duty vehicles by 2045. As a result, the United States witnessed a 21% surge in demand for electric commercial vehicles in 2022 compared to the previous year.
- Governmental efforts, including rebates, subsidies, and strategic plans, are further bolstering the electrification of vehicles nationwide. In May 2022, President Biden unveiled a USD 3 billion plan to expedite domestic battery manufacturing, with the aim of transitioning gas-powered vehicles to electric ones. This push is expected to significantly boost electric mobility in the country, particularly during 2024-2030, thereby amplifying the demand for battery packs.

Understand The Key Trends Shaping This Market
Download PDF
OTHER KEY INDUSTRY TRENDS COVERED IN THE REPORT
- The US population continues to grow steadily, driven by immigration and economic opportunities that require strategic planning
- The CVP is expected to experience consistent growth, driven by technological advancements, a focus on sustainable transportation, and the US's commitment to automotive innovation and reducing carbon emissions
- The recent US auto interest rate of 3.6% reflects fluctuations influenced by monetary policies, credit demand, and economic conditions, with a modest increase indicating optimism in the post-pandemic recovery
- The United States achieved a milestone of 128,000 EV Charging Stations in 2022, and the country is poised for continued growth in green mobility
- Rising demand and strategic product launches drive the electric vehicle market in the US.
- The United States remained a net crude oil importer, importing about 6.28 million bpd from 80 countries
- The US exhibits remarkable economic resilience and growth, driven by factors like robust financial markets, technological advancements, and adaptable policies
- The United States grapples with fluctuating inflation but aims for stability for long-term economic leadership
- Evolution of Mobility as a Service (MaaS) in the United States: a focus on shared rides, car rentals, car-sharing, and ride-hailing and taxi services
- Decreasing battery pack prices and government initiatives drive the US electric vehicle market
- The United States remained a net crude oil importer in 2022, importing about 6.28 million bpd of crude oil from 80 countries
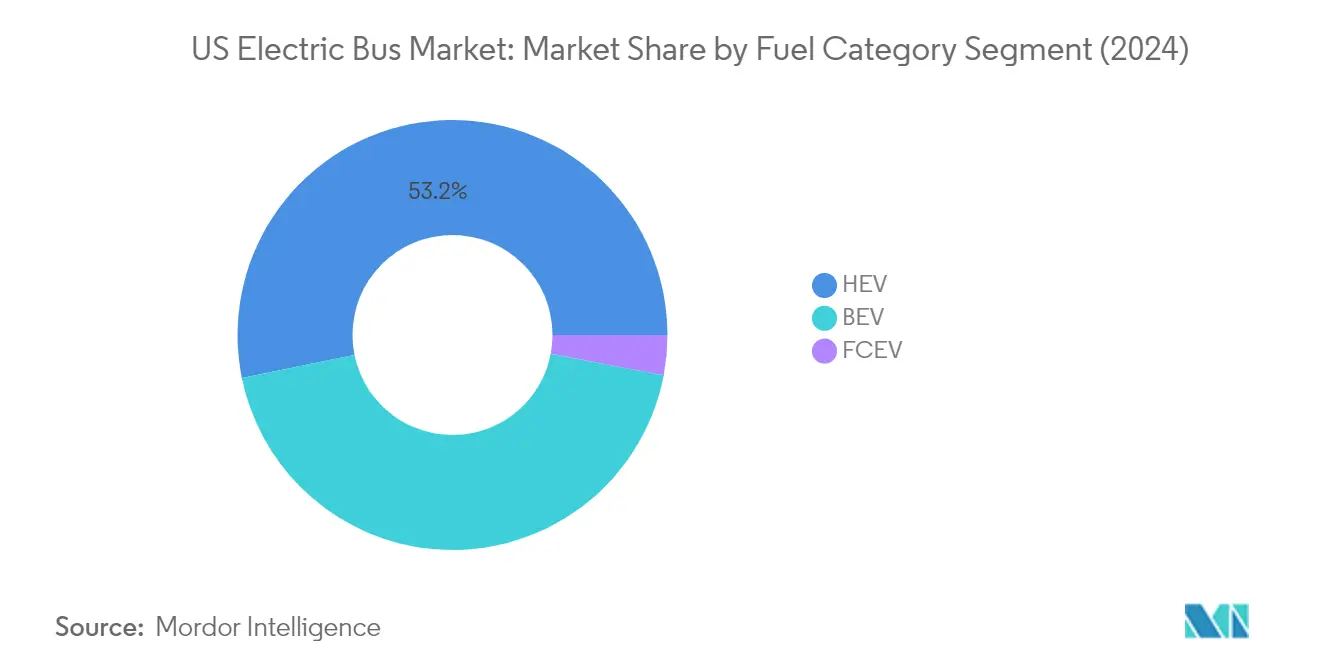
Segment Analysis: Fuel Category
HEV Segment in US Electric Bus Market
Hybrid Electric Vehicles (HEV) maintain their dominance in the US electric bus market, commanding approximately 53% market share in 2024. This leadership position can be attributed to several factors, including the segment's proven reliability, lower initial investment costs compared to fully electric alternatives, and the flexibility of dual power sources. Transit authorities particularly favor hybrid electric bus models for their ability to operate efficiently in various weather conditions and route types without requiring extensive charging infrastructure. The segment's success is further bolstered by established maintenance networks, familiar operating procedures for transit operators, and continued improvements in hybrid powertrain technology that enhance fuel efficiency and reduce emissions. Major manufacturers have expanded their HEV bus offerings, incorporating advanced features like regenerative braking systems and smart power management, which have helped maintain the segment's market leadership.
FCEV Segment in US Electric Bus Market
The Fuel Cell Electric Vehicle (FCEV) segment is emerging as the fastest-growing category in the US electric bus market, demonstrating remarkable growth potential from 2024 to 2029. This growth is driven by increasing recognition of hydrogen fuel cell technology's advantages, particularly for long-range routes and heavy-duty applications. Transit agencies are increasingly attracted to FCEVs due to their quick refueling times, consistent performance in varying weather conditions, and zero-emission operation. The segment's expansion is supported by growing investments in hydrogen infrastructure, technological advancements reducing fuel cell costs, and strategic partnerships between bus manufacturers and hydrogen fuel suppliers. Government initiatives promoting clean energy transportation and substantial funding for hydrogen infrastructure development have further accelerated the adoption of FCEV buses across major metropolitan areas.
Remaining Segments in Fuel Category
The battery electric bus (BEV) segment represents a significant portion of the US electric transit bus market, offering a compelling alternative for urban transit operations. BEV buses are particularly well-suited for fixed routes with predictable daily mileage and scheduled charging opportunities. These vehicles excel in urban environments where frequent stops allow for optimal regenerative braking efficiency and where noise reduction is a priority. Transit agencies are increasingly attracted to BEVs due to their zero direct emissions, lower operating costs, and simplified maintenance requirements compared to conventional buses. The segment's growth is supported by continuous improvements in battery technology, expanding charging infrastructure, and strong policy support at both federal and state levels. The adoption of electric city bus models is further facilitated by these advancements, making them a preferred choice for urban transit solutions.
Competitive Landscape
Top Companies in United States Electric Bus Market
The US electric bus market is characterized by intense innovation and strategic expansion among key players like Proterra, GreenPower Motor Company, NFI Group, BYD, and Lion Electric. Electric bus companies are heavily investing in research and development to enhance battery technology, improve vehicle range, and develop advanced electric bus charging infrastructure solutions. Operational agility is demonstrated through flexible manufacturing capabilities and customized solutions for different transit authorities. Strategic partnerships with technology providers, upfitters, and charging infrastructure companies have become increasingly common to strengthen market positions. Manufacturing footprint expansion, particularly in regions with strong government support for electric transit, has emerged as a key trend, with companies establishing new production facilities and battery manufacturing plants across the United States.
Consolidated Market with Strong Local Players
The US electric bus market exhibits a highly consolidated structure dominated by both domestic specialists and international conglomerates. Local manufacturers like Proterra and GreenPower Motor have established strong footholds through their deep understanding of regional requirements and close relationships with transit authorities. These electric bus manufacturers leverage their domestic manufacturing presence to respond quickly to market demands and maintain competitive advantages. International players, particularly from Asia and Europe, have entered the market through strategic partnerships and local manufacturing facilities to overcome trade barriers and meet Buy America requirements.
The market has witnessed significant consolidation through strategic acquisitions and partnerships, particularly in the battery technology and electric bus infrastructure segments. Companies are increasingly focusing on vertical integration to control key components of the supply chain and reduce dependencies on external suppliers. This consolidation trend is driven by the need to achieve economies of scale, enhance technological capabilities, and strengthen market presence across different regions of the United States. The involvement of private equity firms and strategic investors has further accelerated market consolidation, providing companies with the capital needed for expansion and innovation.
Innovation and Sustainability Drive Future Success
For incumbent players to maintain and increase their market share, focus on technological innovation and cost optimization will be crucial. Companies must invest in next-generation battery technology, develop more efficient powertrains, and create comprehensive fleet management solutions. Building strong relationships with transit authorities through reliable after-sales support and customized financing solutions will be essential. Additionally, establishing robust supply chains and expanding production capacity while maintaining quality standards will help incumbents defend their positions against new entrants.
Contenders looking to gain ground must differentiate themselves through specialized offerings and innovative business models. This could include focusing on specific vehicle segments, developing unique charging solutions, or offering flexible financing options. Success will depend on building strategic partnerships with established players in complementary segments and leveraging emerging technologies to create competitive advantages. The regulatory environment, particularly regarding emissions standards and government incentives, will continue to shape market dynamics. Companies must also address the growing emphasis on total cost of ownership and sustainability requirements from end-users while maintaining competitive pricing strategies.
United States Electric Bus Industry Leaders
-
BYD Auto Co. Ltd.
-
GreenPower Motor Company Inc.
-
Lion Electric Company
-
NFI Group Inc.
-
Proterra INC.
- *Disclaimer: Major Players sorted in no particular order

Need More Details on Market Players and Competitors?
Download PDF
Recent Industry Developments
- September 2023: Daimler Buses launched the next generation Setra TopClass and ComfortClass touring coaches that meet the highest standards of safety, economy, and flexibility.
- September 2023: PSTA awarded USD18 million for electric buses. PSTA will use these funds to purchase 60 Gillig all-electric buses over the next five years, which was approved by the board of directors in December 2021.
- September 2023: Volvo Energy signed a letter of intent with Connected Energy with the ambition to jointly develop a battery energy storage system (BESS).
United States Electric Bus Market Report Scope
BEV, FCEV, HEV are covered as segments by Fuel Category.
Fuel Category
| BEV |
| FCEV |
| HEV |
| Fuel Category | BEV |
| FCEV | |
| HEV |
Need A Different Region or Segment?
Customize Now
Market Definition
- Vehicle Type - The category includes Medium and Heavy Duty Buses.
- Vehicle Body Type - This include Bus category.
- Fuel Category - The category exclusively covers electric propulsion systems, including various types such as HEV (Hybrid Electric Vehicles), PHEV (Plug-in Hybrid Electric Vehicles), BEV (Battery Electric Vehicles), and FCEV (Fuel Cell Electric Vehicles).
| Keyword | Definition |
|---|---|
| Electric Vehicle (EV) | A vehicle which uses one or more electric motors for propulsion. Includes cars, buses, and trucks. This term includes all-electric vehicles or battery electric vehicles and plug-in hybrid electric vehicles. |
| BEV | A BEV relies completely on a battery and a motor for propulsion. The battery in the vehicle must be charged by plugging it into an outlet or public charging station. BEVs do not have an ICE and hence are pollution-free. They have a low cost of operation and reduced engine noise as compared to conventional fuel engines. However, they have a shorter range and higher prices than their equivalent gasoline models. |
| PEV | A plug-in electric vehicle is an electric vehicle that can be externally charged and generally includes all-electric vehicles as well as plug-in hybrids. |
| Plug-in Hybrid EV | A vehicle that can be powered either by an ICE or an electric motor. In contrast to normal hybrid EVs, they can be charged externally. |
| Internal combustion engine | An engine in which the burning of fuels occurs in a confined space called a combustion chamber. Usually run with gasoline/petrol or diesel. |
| Hybrid EV | A vehicle powered by an ICE in combination with one or more electric motors that use energy stored in batteries. These are continually recharged with power from the ICE and regenerative braking. |
| Commercial Vehicles | Commercial vehicles are motorized road vehicles designed for transporting people or goods. The category includes light commercial vehicles (LCVs) and medium and heavy-duty vehicles (M&HCV). |
| Passenger Vehicles | Passenger cars are electric motor– or engine-driven vehicles with at least four wheels. These vehicles are used for the transport of passengers and comprise no more than eight seats in addition to the driver’s seat. |
| Light Commercial Vehicles | Commercial vehicles that weigh less than 6,000 lb (Class 1) and in the range of 6,001–10,000 lb (Class 2) are covered under this category. |
| M&HDT | Commercial vehicles that weigh in the range of 10,001–14,000 lb (Class 3), 14,001–16,000 lb (Class 4), 16,001–19,500 lb (Class 5), 19,501–26,000 lb (Class 6), 26,001–33,000 lb (Class 7) and above 33,001 lb (Class 8) are covered under this category. |
| Bus | A mode of transportation that typically refers to a large vehicle designed to carry passengers over long distances. This includes transit bus, school bus, shuttle bus, and trolleybuses. |
| Diesel | It includes vehicles that use diesel as their primary fuel. A diesel engine vehicle have a compression-ignited injection system rather than the spark-ignited system used by most gasoline vehicles. In such vehicles, fuel is injected into the combustion chamber and ignited by the high temperature achieved when gas is greatly compressed. |
| Gasoline | It includes vehicles that use gas/petrol as their primary fuel. A gasoline car typically uses a spark-ignited internal combustion engine. In such vehicles, fuel is injected into either the intake manifold or the combustion chamber, where it is combined with air, and the air/fuel mixture is ignited by the spark from a spark plug. |
| LPG | It includes vehicles that use LPG as their primary fuel. Both dedicated and bi-fuel LPG vehicles are considered under the scope of the study. |
| CNG | It includes vehicles that use CNG as their primary fuel. These are vehicles that operate like gasoline-powered vehicles with spark-ignited internal combustion engines. |
| HEV | All the electric vehicles that use batteries and an internal combustion engine (ICE) as their primary source for propulsion are considered under this category. HEVs generally use a diesel-electric powertrain and are also known as hybrid diesel-electric vehicles. An HEV converts the vehicle momentum (kinetic energy) into electricity that recharges the battery when the vehicle slows down or stops. The battery of HEV cannot be charged using plug-in devices. |
| PHEV | PHEVs are powered by a battery as well as an ICE. The battery can be charged through either regenerative breaking using the ICE or by plugging into some external charging source. PHEVs have a better range than BEVs but are comparatively less eco-friendly. |
| Hatchback | These are compact-sized cars with a hatch-type door provided at the rear end. |
| Sedan | These are usually two- or four-door passenger cars, with a separate area provided at the rear end for luggage. |
| SUV | Popularly known as SUVs, these cars come with four-wheel drive, and usually have high ground clearance. These cars can also be used as off-road vehicles. |
| MPV | These are multi-purpose vehicles (also called minivans) designed to carry a larger number of passengers. They carry between five and seven people and have room for luggage too. They are usually taller than the average family saloon car, to provide greater headroom and ease of access, and they are usually front-wheel drive. |
Need More Details on Market Definition?
Ask a Question
Research Methodology
Mordor Intelligence follows a four-step methodology in all its reports.
- Step-1: Identify Key Variables: To build a robust forecasting methodology, the variables and factors identified in Step-1 are tested against available historical market numbers. Through an iterative process, the variables required for market forecast are set and the model is built based on these variables.
- Step-2: Build a Market Model: Market-size estimations for the historical and forecast years have been provided in revenue and volume terms. Market revenue is calculated by multiplying the sales volume with their respective average selling price (ASP). While estimating ASP factors like average inflation, market demand shift, manufacturing cost, technological advancement, and varying consumer preference, among others have been taken into account.
- Step-3: Validate and Finalize: In this important step, all market numbers, variables, and analyst calls are validated through an extensive network of primary research experts from the market studied. The respondents are selected across levels and functions to generate a holistic picture of the market studied.
- Step-4: Research Outputs: Syndicated Reports, Custom Consulting Assignments, Databases & Subscription Platforms.

Get More Details On Research Methodology
Download PDF


