
| Study Period | 2017 - 2029 |
| Base Year For Estimation | 2024 |
| Forecast Data Period | 2025 - 2029 |
| Market Size (2025) | USD 4.06 Billion |
| Market Size (2029) | USD 7.49 Billion |
| CAGR (2025 - 2029) | 16.54 % |
| Market Concentration | Low |
Major Players*Disclaimer: Major Players sorted in no particular order |


United States E-bike Market Analysis
The United States E-bike Market size is estimated at 4.06 billion USD in 2025, and is expected to reach 7.49 billion USD by 2029, growing at a CAGR of 16.54% during the forecast period (2025-2029).
The United States e-bike market is experiencing transformative growth driven by technological advancements and shifting consumer preferences toward sustainable transportation solutions. Major manufacturers are investing heavily in research and development to improve battery technology, with lithium-ion batteries expected to become 30-40% cheaper in the coming years through innovations in manufacturing processes and economies of scale. The industry is also witnessing significant retail expansion, exemplified by Trek Bicycle Corporation's network of over 150 stores across the United States, demonstrating the growing demand for specialized e-bike market retail experiences and professional service support.
Infrastructure development has become a cornerstone of market growth, with the United States currently maintaining approximately 17,000 miles of designated bicycle routes. State and local governments are actively expanding dedicated cycling infrastructure, with Ohio leading the initiative by sanctioning approximately 1,177 miles of bicycle routes in September 2022. This infrastructure expansion is complemented by federal support through various incentive programs, including rebates of up to $1,000 on electric bike purchases, making these vehicles more accessible to a broader consumer base.
The market is witnessing a significant shift in urban mobility patterns, with studies indicating that 60% of trips in the United States are five miles or less, presenting an ideal opportunity for electric bike adoption. This trend is particularly evident in major metropolitan areas where consumers are increasingly choosing electric bikes for short-distance commuting and last-mile connectivity. The integration of advanced features such as GPS tracking, smart connectivity, and improved battery management systems is enhancing the appeal of e-bikes among tech-savvy consumers.
Sustainability initiatives are gaining prominence in the industry, with manufacturers implementing environmentally conscious practices throughout their supply chains. Companies are focusing on developing recyclable components, particularly in battery production, and establishing take-back programs for end-of-life products. This commitment to sustainability is resonating with environmentally conscious consumers and aligning with broader governmental goals for reducing carbon emissions in the transportation sector. The industry is also seeing increased collaboration between traditional bicycle manufacturers and technology companies to develop innovative solutions for urban mobility challenges, further strengthening the North America e-bike market.
United States E-bike Market Trends
The US shows a consistent and strong increase in E-Bike adoption rates, indicating a growing popularity and market expansion.
- Over the past few years, bicycles have gradually become one of the popular modes of daily commuting in the United States. The introduction of e-bikes also surged the demand for bicycles in recent years. Rising pollution and traffic conditions, along with rising fuel prices, have boosted the adoption of e-bikes across the country. E-bikes are gaining popularity among a range of age groups. People between the age of 50 and above are also showing high interest in these bikes. As a result, the adoption rate for e-bikes increased by 2.4% in 2019 compared to 2018.
- The COVID-19 pandemic in 2020 had a positive impact on the US e-bike market. Factors such as social distancing measures and anxiety among people about using public transportation resulted in changing travel preferences among consumers, further boosting the adoption of e-bicycles by 2.7% in 2020 compared to 2019.
- E-bike companies are launching new models with advanced technologies to attract customers in the United States and boost their sales significantly. Consumer preferences for a cleaner and healthier ride while saving fuel costs are also contributing to the higher adoption rate of e-bicycles. Owing to such factors, the country witnessed a rise of 3% in the e-bike adoption rate in 2021 compared to 2020, which is projected to grow by 12.24% during the forecast period.

Understand The Key Trends Shaping This Market
Download PDF
The US shows a steady increase in the population with a 5-15 km daily travel distance, indicating a consistent commuting pattern.
- Over the past few years, the United States has witnessed significant demand for bicycles. Though there is rising demand for bicycles, their use in the commute of 5-15 km is still low compared to the other modes of transportation, as the majority of people use personal automobiles for office and business commutes. Only 0.6% of the workers across the United States opted for bicycles as a mode of transport in 2019.
- In 2020, millions of Americans rediscovered bicycles as a safe, socially distant method of transportation after the COVID-19 outbreak. The introduction of e-bikes with advanced battery packs that provide an enhanced range of up to 40-45 km is also boosting the demand from consumers who have a daily travel distance of 5-15 km. During the pandemic, bicycles also became a preferred form of exercise among people due to the closure of gyms and fitness clubs.
- However, post the pandemic, many people continued using bicycles to commute to work, offices, businesses, and marketplaces within a range of 5-15 km. More than 15% of the users used bicycles as a mode of transport in 2022. Bicycles offer health benefits, carbon-free rides, no fuel costs, and time-saving in traffic congestion. These benefits are highly contributing to the rising adoption of bicycles, which may further boost the market in the country during the forecast period.

OTHER KEY INDUSTRY TRENDS COVERED IN THE REPORT
- The US shows a gradual increase in bicycle sales, indicating a steady market with growing interest in cycling post-2020.
- Inflation rates peaked in 2022, followed by a trend towards stabilization, indicating a recovering and adjusting economy.
- The e-bike battery price in the US is progressively declining, reflecting technological advancements and increased market competition.
- The US hyper-local delivery sector is experiencing substantial growth, indicating a significant shift in consumer behavior towards localized online services.
- The number of trekkers in the US shows a robust and continuous growth, indicating an increasing enthusiasm for trekking and outdoor activities across the country.
- Spain's Traffic Congestion Index shows minor fluctuations, suggesting relatively stable traffic conditions with room for congestion management improvements.
- Steady growth in GDP per capita indicates a robust economy, with a slight dip in 2020 followed by a strong recovery.
- The US bicycle rental market is on an upward trajectory, showcasing resilience and growth with an expected continued increase through 2029.
- Li-ion battery is gaining share in United States e-bike market
- The gradual increase in dedicated bicycle lanes in Africa South suggests a steady but slow adoption of cycling-friendly infrastructure.
- France's E-bike charging time is on a downward trend, indicating the country's commitment to promoting electric mobility and enhancing charging technology.
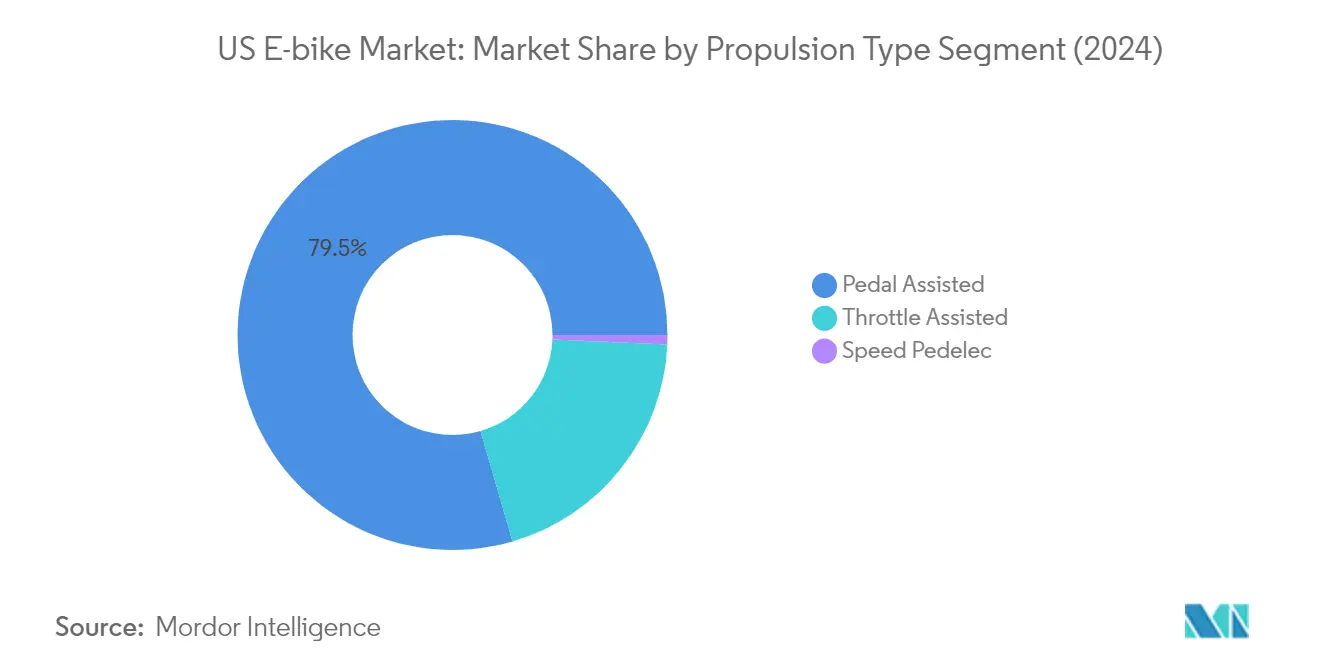
Segment Analysis: Propulsion Type
Pedal Assisted Segment in US E-bike Market
The pedal-assisted segment dominates the United States e-bike market, commanding approximately 80% market share in 2024. This significant market position is driven by several key factors, including improved battery life, reduced service requirements, and the flexibility to select between 3-5 types of pedal assistance depending on the model. The segment's popularity is particularly strong among working professionals who seek an efficient way to incorporate exercise into their daily commute without dedicating extra time. The integration of advanced features like enhanced battery technology and sophisticated pedal assist systems has made these electric bicycles increasingly attractive to consumers. Additionally, the National Park Service's decision to permit electric bikes in national parks has expanded recreational options, particularly benefiting the elderly and individual market segments.
Speed Pedelec Segment in US E-bike Market
The pedelec segment is emerging as the fastest-growing category in the US e-bike market, projected to grow at approximately 20% CAGR from 2024 to 2029. This remarkable growth is primarily driven by increasing consumer demand for high-performance e-bikes that offer enhanced speed capabilities while maintaining safety standards. Speed pedelecs are gaining significant traction as an economical alternative to mopeds and scooters, particularly in urban areas where commuters seek faster transportation options. The segment's growth is further supported by technological advancements in battery efficiency and motor performance, making these bikes more reliable and appealing to speed-conscious consumers. The expanding resident populations in the United States and growing emphasis on leading a healthy lifestyle are expected to continue driving the segment's exponential growth in the coming years.
Remaining Segments in Propulsion Type
The throttle-assisted segment represents a significant portion of the US electric bicycle market, offering functionality similar to motorcycles or scooters. These e-bikes are particularly appealing to users who prefer more direct power control without the need for constant pedaling. The segment has gained considerable traction in the tourism sector, where companies offer these bikes as part of their travel packages for exploring cities and countryside locations. The throttle-assisted segment's growth is supported by continuous technological improvements in motor efficiency and battery performance, making these bikes increasingly reliable for daily commuting and recreational purposes. The segment's appeal is further enhanced by its ease of use, particularly for users who may have physical limitations or prefer a more automated riding experience.
Segment Analysis: Application Type
City/Urban Segment in US E-bike Market
The City/Urban segment dominates the US electric bicycle market, commanding approximately 82% market share in 2024. This significant market position is driven by the growing urbanization and increasing adoption of e-bikes across major US cities. The segment's dominance is reinforced by expanding cycling infrastructure and pathways across urban centers, making e-bikes an attractive transportation option for city dwellers. Rising awareness about the benefits of e-bikes, such as faster commuting in traffic-congested areas and easier parking, has substantially contributed to the segment's market leadership. The US government's initiatives to promote city e-bikes as a solution to reduce traffic congestion and promote electric mobility have further strengthened this segment's position.
Trekking Segment in US E-bike Market
The Trekking segment is emerging as the fastest-growing category in the US electric bicycle market for the forecast period 2024-2029. This growth is primarily driven by the rising popularity of performance-based adventure sports and recreational cycling. The segment is witnessing increased demand from recreational cyclists who seek to enjoy longer rides without experiencing fatigue after trekking. The trend is further supported by technological advancements in e-bikes, making them lighter, more portable, and performance-oriented. The segment's growth is also bolstered by the increasing interest in off-road activities and adventure tourism, with many consumers using e-bikes to comfortably complete 30-35 mile round trips.
Remaining Segments in Application Type
The Cargo/Utility segment, while smaller in market share, plays a vital role in the US e-bike market ecosystem. This segment is particularly significant in urban logistics and last-mile delivery solutions. The segment has gained traction with businesses adopting e-cargo bikes for sustainable delivery options, especially in congested urban areas. The growing e-commerce sector and increasing focus on sustainable urban logistics have created new opportunities for cargo e-bikes. These bikes are becoming increasingly popular among businesses looking for cost-effective, environmentally friendly alternatives to traditional delivery vehicles, particularly in dense urban environments where maneuverability and parking are crucial factors.
Segment Analysis: Battery Type
Lithium-ion Battery Segment in US E-bike Market
The lithium-ion battery segment dominates the US e-bike market, commanding approximately 93% market share in 2024, driven by its superior performance characteristics and declining costs. These batteries are increasingly preferred by manufacturers and consumers due to their high energy density, longer lifespan, and lighter weight compared to traditional alternatives. The segment's growth is further supported by significant investments in domestic manufacturing capabilities, with the US Department of Energy committing substantial funding to boost local battery production and workforce development. The increasing focus on sustainable transportation solutions and the growing adoption of e-bikes for both recreational and commercial purposes continue to drive demand for lithium-ion batteries. Additionally, technological advancements in battery chemistry and manufacturing processes have led to improved performance metrics and reduced costs, making lithium-ion batteries more accessible to a broader range of consumers. The segment's strong position is also reinforced by major e-bike manufacturers increasingly standardizing lithium-ion batteries across their product lines, recognizing their superior value proposition in terms of range, charging efficiency, and overall user experience.
Remaining Segments in Battery Type
The lead-acid battery segment, while historically significant in the e-bike market, continues to maintain a presence primarily in the budget segment, though its market share is gradually declining due to the superior performance of lithium-ion alternatives. Lead-acid batteries still find applications in specific use cases where initial cost considerations outweigh performance requirements, particularly in basic models and certain commercial applications. Other battery technologies, including emerging options like sodium-ion batteries, represent a small but innovative segment of the market, with ongoing research and development efforts focused on creating more sustainable and cost-effective alternatives to existing battery technologies. These alternative battery technologies are particularly interesting for their potential to address specific market needs, such as extreme weather performance or specialized industrial applications, though they currently represent a minimal market share compared to the dominant lithium-ion segment.
United States E-bike Industry Overview
Top Companies in United States E-bike Market
The US electric bike market is characterized by intense competition among established players like Trek Bicycle Corporation, Pon Holdings, Specialized Bicycle Components, and Giant Manufacturing. These companies are driving market growth through continuous product innovation, particularly in areas like battery technology, smart connectivity features, and lightweight frame materials. Manufacturers are increasingly focusing on expanding their distribution networks while simultaneously strengthening their direct-to-consumer channels to improve market reach. Strategic partnerships with technology providers and component manufacturers have become crucial for maintaining a competitive advantage. Companies are also investing heavily in research and development to improve battery efficiency, range, and charging capabilities while reducing overall product weight. The market has seen a significant uptick in localization efforts, with several international players establishing manufacturing and assembly facilities within the United States to better serve the growing domestic demand.
Dynamic Market with Diverse Player Mix
The US e-bike market exhibits a moderate level of consolidation, with a mix of global conglomerates and specialized e-bike manufacturers competing for market share. Traditional bicycle manufacturers have successfully leveraged their brand reputation and existing distribution networks to establish strong positions in the electric bike segment, while new entrants like Rad Power Bikes and VanMoof have disrupted the market with direct-to-consumer business models and innovative product offerings. The market has witnessed significant merger and acquisition activity, particularly with established players acquiring smaller, innovative companies to expand their technological capabilities and market presence.
The competitive landscape is further shaped by the presence of both premium and value-segment players, each targeting distinct consumer segments with differentiated product offerings. European manufacturers have made significant inroads into the US market through strategic acquisitions and partnerships, bringing their expertise in e-bike technology and design. Local players have responded by focusing on customization options and after-sales service networks to maintain their competitive edge. The market has also seen increased collaboration between e-bike manufacturers and mobility service providers, creating new business models and revenue streams.
Innovation and Service Drive Future Success
Success in the US e-bike market increasingly depends on manufacturers' ability to differentiate their products through technological innovation while maintaining competitive pricing. Companies need to focus on developing comprehensive ecosystem solutions, including mobile apps, connected features, and integrated service platforms. Building strong dealer networks while maintaining direct customer relationships has become crucial for market success. Manufacturers must also address growing concerns about battery safety and recycling while adapting to evolving regulatory requirements across different states.
Future market leaders will need to demonstrate operational agility in responding to changing consumer preferences and regulatory landscapes. Investment in sustainable manufacturing practices and circular economy initiatives will become increasingly important for maintaining market position. Companies must develop strategies to mitigate supply chain risks while maintaining cost competitiveness. Success will also depend on the ability to create strong brand communities through effective marketing and customer engagement programs. The development of specialized e-bikes for different use cases, from urban commuting to cargo delivery, will be crucial for capturing new market segments and maintaining growth momentum.
United States E-bike Market Leaders
-
Cycling Sports Group, Inc.
-
Giant Manufacturing Co.
-
Pon Holdings B.V.
-
Specialized Bicycle Components Inc.
-
Trek Bicycle Corporation
- *Disclaimer: Major Players sorted in no particular order

Need More Details on Market Players and Competiters?
Download PDF
United States E-bike Market News
- November 2022: Cannondale announced a new global unified organizational structure that may eliminate regional GMs and leverage Pon.Bike to enhance the company’s operations and growth.
- November 2022: Cannondale entered the urban e-mobility market with the Compact Neo electric bicycle.
- September 2022: In May 2021, Specialized announced a recall of some battery packs on specific electric mountain bike models due to fire hazards caused by these batteries.
Free With This Report
We offer a comprehensive and complimentary collection of data points on regional and country-level metrics, crucial to understanding the industry's core structure. Our resources include over 120 free charts, providing rare data across various countries. This collection encompasses an analysis of e-bike outlets, distribution channels, and their geographical distribution, examination of average selling prices for different e-bike models across regions, insights into consumer preferences and purchasing patterns, a detailed segmentation of the market, comprehensive insights into market trends and environmental impacts, an overview of key market players, an examination of the regulatory landscape, and projections for the future of the e-bike market.


United States E-bike Market Report - Table of Contents
1. EXECUTIVE SUMMARY & KEY FINDINGS
2. REPORT OFFERS
3. INTRODUCTION
- 3.1 Study Assumptions & Market Definition
- 3.2 Scope of the Study
- 3.3 Research Methodology
4. KEY INDUSTRY TRENDS
- 4.1 Bicycle Sales
- 4.2 GDP Per Capita
- 4.3 Inflation Rate
- 4.4 Adoption Rate Of E-bikes
- 4.5 Percent Population/commuters With 5-15 Km Daily Travel Distance
- 4.6 Bicycle Rental
- 4.7 E-bike Battery Price
- 4.8 Price Chart Of Different Battery Chemistry
- 4.9 Hyper-local Delivery
- 4.10 Dedicated Bicycle Lanes
- 4.11 Number Of Trekkers
- 4.12 Battery Charging Capacity
- 4.13 Traffic Congestion Index
- 4.14 Regulatory Framework
- 4.15 Value Chain & Distribution Channel Analysis
5. MARKET SEGMENTATION (includes market size in Value in USD and Volume, Forecasts up to 2029 and analysis of growth prospects)
-
5.1 Propulsion Type
- 5.1.1 Pedal Assisted
- 5.1.2 Speed Pedelec
- 5.1.3 Throttle Assisted
-
5.2 Application Type
- 5.2.1 Cargo/Utility
- 5.2.2 City/Urban
- 5.2.3 Trekking
-
5.3 Battery Type
- 5.3.1 Lead Acid Battery
- 5.3.2 Lithium-ion Battery
- 5.3.3 Others
6. COMPETITIVE LANDSCAPE
- 6.1 Key Strategic Moves
- 6.2 Market Share Analysis
- 6.3 Company Landscape
-
6.4 Company Profiles
- 6.4.1 Ariel Rider
- 6.4.2 Cycling Sports Group, Inc.
- 6.4.3 Giant Manufacturing Co.
- 6.4.4 Pon Holdings B.V.
- 6.4.5 Propella Electric Bikes
- 6.4.6 Rad Power Bikes
- 6.4.7 Ride Aventon Inc.
- 6.4.8 Specialized Bicycle Components Inc.
- 6.4.9 Trek Bicycle Corporation
- 6.4.10 VanMoof
- *List Not Exhaustive
7. KEY STRATEGIC QUESTIONS FOR E BIKES CEOS
8. APPENDIX
-
8.1 Global Overview
- 8.1.1 Overview
- 8.1.2 Porter’s Five Forces Framework
- 8.1.3 Global Value Chain Analysis
- 8.1.4 Market Dynamics (DROs)
- 8.2 Sources & References
- 8.3 List of Tables & Figures
- 8.4 Primary Insights
- 8.5 Data Pack
- 8.6 Glossary of Terms
You Can Purchase Parts Of This Report. Check Out Prices For Specific Sections
Get Price Break-up Now
List of Tables & Figures
- Figure 1:
- CONVETIONAL AND E-BIKE SALES, VOLUME IN UNITS, US, 2017 - 2029
- Figure 2:
- GDP PER CAPITA AT CURRENT PRICES, VALUE IN USD, US, 2017 - 2029
- Figure 3:
- INFLATION RATE AT AVERAGE CONSUMER PRICES, PERCENTAGE CHANGE, US, 2017 - 2029
- Figure 4:
- E-BIKE MARKET PENETRATION RATE, VOLUME PERCENTAGE, US, 2017 - 2029
- Figure 5:
- PROPORTION OF 5-15 KM DAILY TRAVELERS, PERCENTAGE, US, 2017 - 2029
- Figure 6:
- BICYCLE RENTAL SERVICE MARKET, REVENUE IN USD, US, 2016 - 2028
- Figure 7:
- COST OF LI-ION BATTERIES FOR E-BIKES, VALUE IN USD PER KWH, US, 2016 - 2028
- Figure 8:
- E-BIKE BATTERY TYPE PRICE COMPARISON, USD PER KWH, US, 2017 - 2029
- Figure 9:
- HYPER LOCAL DELIVERY SERVICE MARKET, REVENUE IN USD, US, 2016 - 2028
- Figure 10:
- LENGTH OF DEDICATED BICYCLE LANES, KM, US, 2017 - 2022
- Figure 11:
- TREKKER POPULATION, UNIT, US, 2016 - 2028
- Figure 12:
- AVERAGE CHARGING TIME OF E-BIKE BATTERIES, HOURS, US, 2016 - 2028
- Figure 13:
- TRAFFIC CONGESTION INTENSITY INDEX, US, 2017 - 2022
- Figure 14:
- UNITED STATES E-BIKE MARKET, VOLUME, UNITS, 2017 - 2029
- Figure 15:
- UNITED STATES E-BIKE MARKET, VALUE, USD MILLION, 2017 - 2029
- Figure 16:
- UNITED STATES E-BIKE MARKET, BY PROPULSION TYPE, VOLUME, UNITS, 2017 - 2029
- Figure 17:
- UNITED STATES E-BIKE MARKET, BY PROPULSION TYPE, VALUE, USD, 2017 - 2029
- Figure 18:
- UNITED STATES E-BIKE MARKET, BY PROPULSION TYPE, VOLUME, SHARE (%), 2017 VS 2023 VS 2029
- Figure 19:
- UNITED STATES E-BIKE MARKET, BY PROPULSION TYPE, VALUE, SHARE (%), 2017 VS 2023 VS 2029
- Figure 20:
- E-BIKE MARKET, BY PROPULSION TYPE, PEDAL ASSISTED, VOLUME, UNITS, US, 2017 - 2029
- Figure 21:
- E-BIKE MARKET, BY PROPULSION TYPE, PEDAL ASSISTED, VALUE, USD, US, 2017 - 2029
- Figure 22:
- BREAKDOWN OF PEDAL ASSISTED E-BIKE MARKET BY APPLICATION TYPE, REVENUE SHARE (%), US, 2023 VS 2029
- Figure 23:
- E-BIKE MARKET, BY PROPULSION TYPE, SPEED PEDELEC, VOLUME, UNITS, US, 2017 - 2029
- Figure 24:
- E-BIKE MARKET, BY PROPULSION TYPE, SPEED PEDELEC, VALUE, USD, US, 2017 - 2029
- Figure 25:
- BREAKDOWN OF SPEED PEDELEC E-BIKE MARKET BY APPLICATION TYPE, REVENUE SHARE (%), US, 2023 VS 2029
- Figure 26:
- E-BIKE MARKET, BY PROPULSION TYPE, THROTTLE ASSISTED, VOLUME, UNITS, US, 2017 - 2029
- Figure 27:
- E-BIKE MARKET, BY PROPULSION TYPE, THROTTLE ASSISTED, VALUE, USD, US, 2017 - 2029
- Figure 28:
- BREAKDOWN OF THROTTLE ASSISTED E-BIKE MARKET BY APPLICATION TYPE, REVENUE SHARE (%), US, 2023 VS 2029
- Figure 29:
- UNITED STATES E-BIKE MARKET, BY APPLICATION TYPE, VOLUME, UNITS, 2017 - 2029
- Figure 30:
- UNITED STATES E-BIKE MARKET, BY APPLICATION TYPE, VALUE, USD, 2017 - 2029
- Figure 31:
- UNITED STATES E-BIKE MARKET, BY APPLICATION TYPE, VOLUME, SHARE (%), 2017 VS 2023 VS 2029
- Figure 32:
- UNITED STATES E-BIKE MARKET, BY APPLICATION TYPE, VALUE, SHARE (%), 2017 VS 2023 VS 2029
- Figure 33:
- E-BIKE MARKET, BY APPLICATION TYPE, CARGO/UTILITY, VOLUME, UNITS, US, 2017 - 2029
- Figure 34:
- E-BIKE MARKET, BY APPLICATION TYPE, CARGO/UTILITY, VALUE, USD, US, 2017 - 2029
- Figure 35:
- BREAKDOWN OF CARGO/UTILITY E-BIKE MARKET BY PROPULSION TYPE, REVENUE SHARE (%), US, 2023 VS 2029
- Figure 36:
- E-BIKE MARKET, BY APPLICATION TYPE, CITY/URBAN, VOLUME, UNITS, US, 2017 - 2029
- Figure 37:
- E-BIKE MARKET, BY APPLICATION TYPE, CITY/URBAN, VALUE, USD, US, 2017 - 2029
- Figure 38:
- BREAKDOWN OF CITY/URBAN E-BIKE MARKET BY PROPULSION TYPE, REVENUE SHARE (%), US, 2023 VS 2029
- Figure 39:
- E-BIKE MARKET, BY APPLICATION TYPE, TREKKING, VOLUME, UNITS, US, 2017 - 2029
- Figure 40:
- E-BIKE MARKET, BY APPLICATION TYPE, TREKKING, VALUE, USD, US, 2017 - 2029
- Figure 41:
- BREAKDOWN OF TREKKING E-BIKE MARKET BY PROPULSION TYPE, REVENUE SHARE (%), US, 2023 VS 2029
- Figure 42:
- UNITED STATES E-BIKE MARKET, BY BATTERY TYPE, VOLUME, UNITS, 2017 - 2029
- Figure 43:
- UNITED STATES E-BIKE MARKET, BY BATTERY TYPE, VALUE, USD, 2017 - 2029
- Figure 44:
- UNITED STATES E-BIKE MARKET, BY BATTERY TYPE, VOLUME, SHARE (%), 2017 VS 2023 VS 2029
- Figure 45:
- UNITED STATES E-BIKE MARKET, BY BATTERY TYPE, VALUE, SHARE (%), 2017 VS 2023 VS 2029
- Figure 46:
- E-BIKE MARKET, BY BATTERY TYPE, LEAD ACID BATTERY, VOLUME, UNITS, US, 2017 - 2029
- Figure 47:
- E-BIKE MARKET, BY BATTERY TYPE, LEAD ACID BATTERY, VALUE, USD, US, 2017 - 2029
- Figure 48:
- BREAKDOWN OF LEAD ACID BATTERY E-BIKE MARKET BY PROPULSION TYPE, REVENUE SHARE (%), US, 2023 VS 2029
- Figure 49:
- E-BIKE MARKET, BY BATTERY TYPE, LITHIUM-ION BATTERY, VOLUME, UNITS, US, 2017 - 2029
- Figure 50:
- E-BIKE MARKET, BY BATTERY TYPE, LITHIUM-ION BATTERY, VALUE, USD, US, 2017 - 2029
- Figure 51:
- BREAKDOWN OF LITHIUM-ION BATTERY E-BIKE MARKET BY PROPULSION TYPE, REVENUE SHARE (%), US, 2023 VS 2029
- Figure 52:
- E-BIKE MARKET, BY BATTERY TYPE, OTHERS, VOLUME, UNITS, US, 2017 - 2029
- Figure 53:
- E-BIKE MARKET, BY BATTERY TYPE, OTHERS, VALUE, USD, US, 2017 - 2029
- Figure 54:
- BREAKDOWN OF OTHERS E-BIKE MARKET BY PROPULSION TYPE, REVENUE SHARE (%), US, 2023 VS 2029
- Figure 55:
- UNITED STATES E-BIKE MARKET, MOST ACTIVE COMPANIES, BY NUMBER OF STRATEGIC MOVES, 2020 - 2022
- Figure 56:
- UNITED STATES E-BIKE MARKET, MOST ADOPTED STRATEGIES, 2020 - 2022
- Figure 57:
- UNITED STATES E-BIKE MARKET SHARE(%), BY MAJOR PLAYER REVENUE, 2022
United States E-bike Industry Segmentation
Pedal Assisted, Speed Pedelec, Throttle Assisted are covered as segments by Propulsion Type. Cargo/Utility, City/Urban, Trekking are covered as segments by Application Type. Lead Acid Battery, Lithium-ion Battery, Others are covered as segments by Battery Type.| Propulsion Type | Pedal Assisted |
| Speed Pedelec | |
| Throttle Assisted | |
| Application Type | Cargo/Utility |
| City/Urban | |
| Trekking | |
| Battery Type | Lead Acid Battery |
| Lithium-ion Battery | |
| Others |
Need A Different Region or Segment?
Customize Now
Market Definition
- By Application Type - E-bikes considered under this segment include city/urban, trekking, and cargo/utility e-bikes. The common types of e-bikes under these three categories include off-road/hybrid, kids, ladies/gents, cross, MTB, folding, fat tire, and sports e-bike.
- By Battery Type - This segment includes lithium-ion batteries, lead-acid batteries, and other battery types. The other battery type category includes nickel-metal hydroxide (NiMH), silicon, and lithium-polymer batteries.
- By Propulsion Type - E-bikes considered under this segment include pedal-assisted e-bikes, throttle-assisted e-bikes, and speed pedelec. While the speed limit of pedal and throttle-assisted e-bikes is usually 25 km/h, the speed limit of speed pedelec is generally 45 km/h (28 mph).
| Keyword | Definition |
|---|---|
| Pedal Assisted | Pedal-assist or pedelec category refers to the electric bikes that provide limited power assistance through torque-assist system and do not have throttle for varying the speed. The power from the motor gets activated upon pedaling in these bikes and reduces human efforts. |
| Throttle Assisted | Throttle-based e-bikes are equipped with the throttle assistance grip, installed on the handlebar, similarly to motorbikes. The speed can be controlled by twisting the throttle directly without the need to pedal. The throttle response directly provides power to the motor installed in the bicycles and speeds up the vehicle without paddling. |
| Speed Pedelec | Speed pedelec is e-bikes similar to pedal-assist e-bikes as they do not have throttle functionality. However, these e-bikes are integrated with an electric motor which delivers power of approximately 500 W and more. The speed limit of such e-bikes is generally 45 km/h (28 mph) in most of the countries. |
| City/Urban | The city or urban e-bikes are designed with daily commuting standards and functions to be operated within the city and urban areas. The bicycles include various features and specifications such as comfortable seats, sit upright riding posture, tires for easy grip and comfortable ride, etc. |
| Trekking | Trekking and mountain bikes are special types of e-bikes that are designed for special purposes considering the robust and rough usage of the vehicles. These bicycles include a strong frame, and wide tires for better and advanced grip and are also equipped with various gear mechanisms which can be used while riding in different terrains, rough grounded, and tough mountainous roads. |
| Cargo/Utility | The e-cargo or utility e-bikes are designed to carry various types of cargo and packages for shorter distances such as within urban areas. These bikes are usually owned by local businesses and delivery partners to deliver packages and parcels at very low operational costs. |
| Lithium-ion Battery | A Li-ion battery is a rechargeable battery, which uses lithium and carbon as its constituent materials. The Li-Ion batteries have a higher density and lesser weight than sealed lead acid batteries and provide the rider with more range per charge than other types of batteries. |
| Lead Acid Battery | A lead acid battery refers to sealed lead acid battery having a very low energy-to-weight and energy-to-volume ratio. The battery can produce high surge currents, owing to its relatively high power-to-weight ratio as compared to other rechargeable batteries. |
| Other Batteries | This includes electric bikes using nickel–metal hydroxide (NiMH), silicon, and lithium-polymer batteries. |
| Business-to-Business (B2B) | The sales of e-bikes to business customers such as urban fleet and logistics company, rental/sharing operators, last-mile fleet operators, and corporate fleet operators are considered under this category. |
| Business-to-Customers (B2C) | The sales of electric scooters and motorcycles to direct consumers is considered under this category. The consumers acquire these vehicles either directly from manufacturers or from other distributers and dealers through online and offline channel. |
| Unorganized Local OEMs | These players are small local manufacturers and assemblers of e-bikes. Most of these manufacturers import the components from China and Taiwan and assemble them locally. They offer the product at low cost in this price sensitive market which give them advantage over organized manufacturers. |
| Battery-as-a-Service | A business model in which the battery of an EV can be rented from a service provider or swapped with another battery when it runs out of charge |
| Dockless e-Bikes | Electric bikes that have self-locking mechanisms and a GPS tracking facility with an average top speed of around 15mph. These are mainly used by bike-sharing companies such as Bird, Lime, and Spin. |
| Electric Vehicle | A vehicle which uses one or more electric motors for propulsion. Includes cars, scooters, buses, trucks, motorcycles, and boats. This term includes all-electric vehicles and hybrid electric vehicles |
| Plug-in EV | An electric vehicle that can be externally charged and generally includes all-electric vehicles as well as plug-in hybrids. In this report we use the term for all-electric vehicles to differentiate them from plug-in hybrid electric vehicles. |
| Lithium-Sulphur Battery | A rechargeable battery that replaces the liquid or polymer electrolyte found in current lithium-ion batteries with sulfur. They have more capacity than Li-ion batteries. |
| Micromobility | Micromobility is one of the many modes of transport involving very-light-duty vehicles to travel short distances. These means of transportation include bikes, e-scooters, e-bikes, mopeds, and scooters. Such vehicles are used on a sharing basis for covering short distances, usually five miles or less. |
| Low Speed Electric Vehicls (LSEVs) | They are low speed (usually less than 25 kmph) light vehicles that do not have an internal combustion engine, and solely use electric energy for propulsion. |
Need More Details on Market Definition?
Ask a Question
Research Methodology
Mordor Intelligence follows a four-step methodology in all its reports.
- Step-1: Identify Key Variables: To build a robust forecasting methodology, the variables and factors identified in Step-1 are tested against available historical market numbers. Through an iterative process, the variables required for market forecast are set and the model is built based on these variables.
- Step-2: Build a Market Model: Market-size estimations for the historical and forecast years have been provided in revenue and volume terms. Market revenue is calculated by multiplying the volume demand with volume-weighted average battery pack price (per kWh). Battery pack price estimation and forecast takes into account various factors affecting ASP, such as inflation rates, market demand shifts, production costs, technological developments, and consumer preferences, providing estimations for both historical data and future trends.
- Step-3: Validate and Finalize: In this important step, all market numbers, variables, and analyst calls are validated through an extensive network of primary research experts from the market studied. The respondents are selected across levels and functions to generate a holistic picture of the market studied.
- Step-4: Research Outputs: Syndicated Reports, Custom Consulting Assignments, Databases & Subscription Platforms

Get More Details On Research Methodology
Download PDF


