
Market Overview
| Study Period | 2021 - 2031 |
|---|---|
| Forecast Data Period | 2026 - 2031 |
| Base Year Market Size (2025) | USD 2.11 Billion |
| Market Size (2026) | USD 2.28 Billion |
| Market Size (2031) | USD 3.4 Billion |
| Growth Rate (2026 - 2031) | 8.31 % |
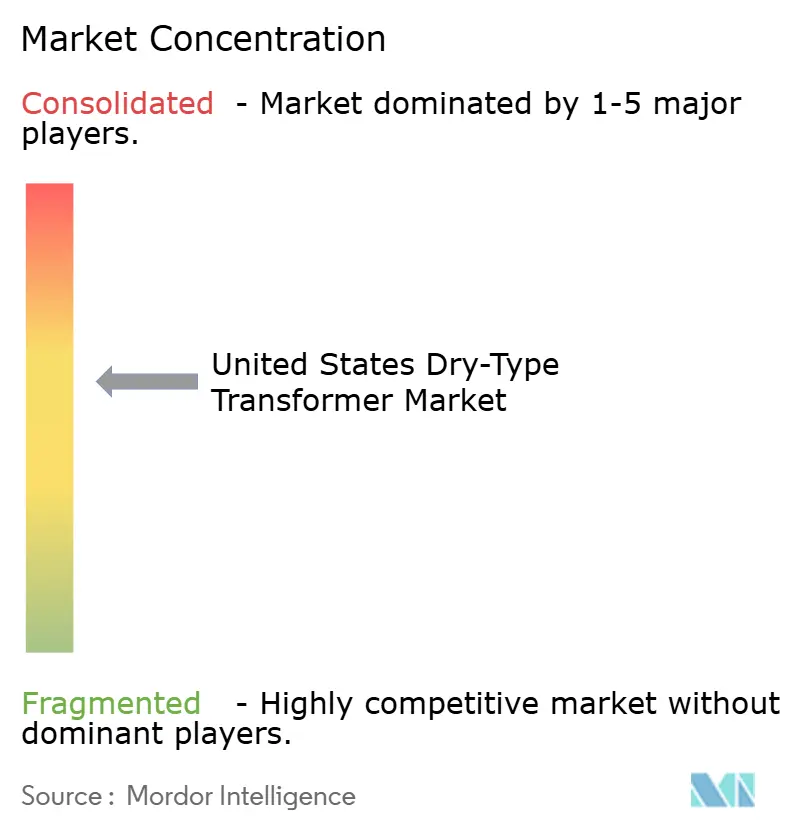
| Market Concentration | Medium |
Major Players *Disclaimer: Major Players sorted in no particular order Image © Mordor Intelligence. Reuse requires attribution under CC BY 4.0. | |
United States Dry-Type Transformer Market Analysis by Mordor Intelligence
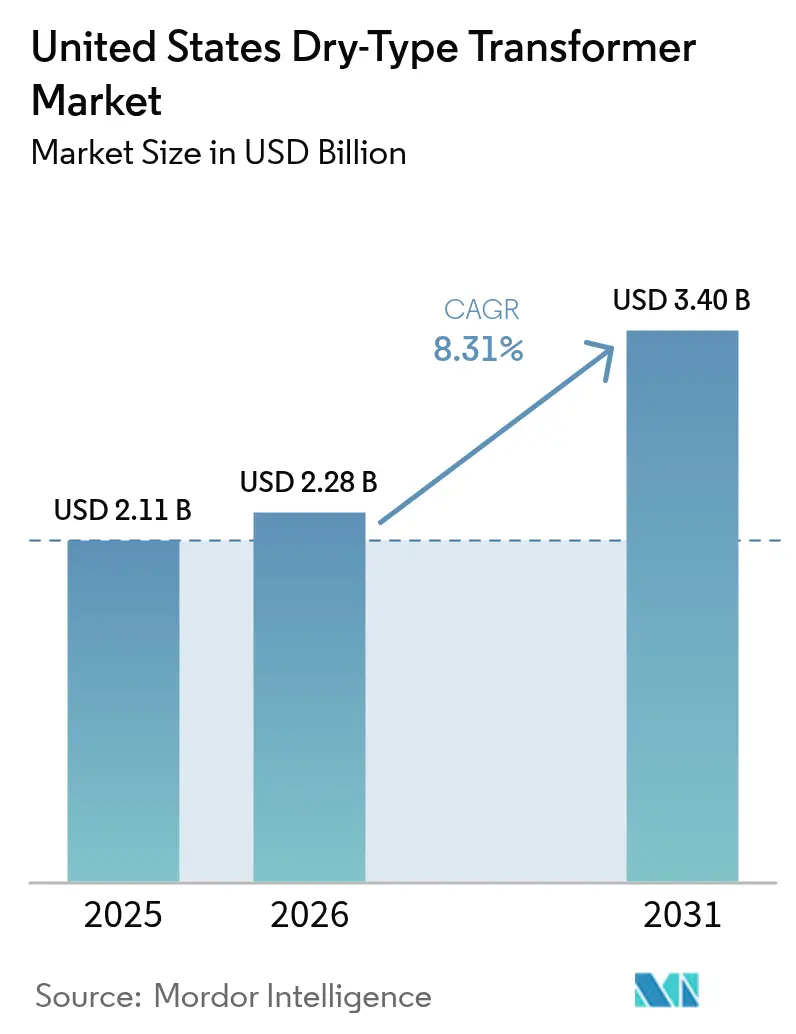
The United States Dry-Type Transformer Market size was valued at USD 2.11 billion in 2025 and estimated to grow from USD 2.28 billion in 2026 to reach USD 3.4 billion by 2031, at a CAGR of 8.31% during the forecast period (2026-2031).
Efficiency regulations, the electrification of buildings and transport, and grid modernization funding are the principal forces shaping demand. The Department of Energy’s Phase-2 standards, now effective in 2029, compress retrofit timelines and accelerate replacement cycles.[1] Surge in behind-the-meter battery storage is reshaping specification requirements toward bidirectional, thermally robust designs. Data center incentives under federal infrastructure policy amplify large-order volumes in the Virginia, Texas, and North Carolina corridors. Simultaneously, the reshoring of medium-voltage equipment manufacturing is swelling domestic capacity, although interim supply constraints persist while new plants ramp up production. Material-price volatility and certification bottlenecks temper margins but are outweighed by regulatory and electrification tailwinds that sustain growth opportunities across utility and residential segments.
Key Report Takeaways
- By power rating, small transformers, up to 10 MVA, captured 84.68% of the US dry-type transformer market share in 2025 and are expected to expand at an 8.46% CAGR through 2031.
- By phase, single-phase units are projected to grow at a 8.92% CAGR, outpacing the three-phase segment’s 7.65% growth to 2031
- By transformer type, distribution transformers accounted for 79.25% of the US dry-type transformer market size in 2025 and are expected to maintain their leadership with an 8.52% CAGR over the forecast period.
- By end-user, the residential segment is expected to lead growth at a 9.18% CAGR, while power utilities remain the largest buyers, accounting for a 31.42% value share in 2025.
Note: Market size and forecast figures in this report are generated using Mordor Intelligence’s proprietary estimation framework, updated with the latest available data and insights as of 2026.
United States Dry-Type Transformer Market Trends and Insights
Drivers Impact Analysis*
| Driver | (~) % Impact on CAGR Forecast | Geographic Relevance | Impact Timeline |
|---|---|---|---|
| DOE efficiency rule Phase-2 enforcement | +2.1% | Nationwide, strongest in industrial states | Medium term (2-4 years) |
| Behind-the-meter battery storage surge | +1.8% | California, Texas, Northeast | Short term (≤ 2 years) |
| Data-center tax incentives | +1.4% | Virginia, Texas, North Carolina | Medium term (2-4 years) |
| Reshoring of medium-voltage supply chains | +0.9% | Midwest manufacturing belt, Southeast industrial zones | Long term (≥ 4 years) |
| Fire-safe transformer mandates in high-rise | +0.7% | Dense urban construction markets | Medium term (2-4 years) |
| Electrification of heat processes challenges | +0.3% | Industrial clusters in chemical, steel, cement sectors | Long term (≥ 4 years) |
| Source: Mordor Intelligence | |||
DOE Efficiency Rule Phase-2 Drives Retrofit Acceleration
The Department of Energy has set 2029 as the compliance deadline for the second phase of transformer efficiency rules, replacing the earlier 2027 date. The rule demands efficiency gains that are unattainable through minor design tweaks, forcing the outright replacement of many aging dry-type units. A four-year compliance window prompts utilities, campuses, and industrial plants to expedite their procurement strategies. Ancillary upgrades—such as larger termination compartments and improved ventilation—add to project scope and spending. Facilities operating multiple units must synchronize replacements to avoid downtime, elevating batch-order volumes. These dynamics elevate baseline demand across all ratings, creating premium pricing opportunities for suppliers capable of delivering high-efficiency models within compressed lead times.
Behind-the-Meter Storage Transforms Distribution Requirements
California surpassed 2,000 MW of behind-the-meter storage capacity in 2024, with Texas and Northeast states following suit.[2] Bidirectional power flow and rapid cycling stress conventional transformer designs drive the adoption of vacuum-pressure-impregnated (VPI) coils, which offer enhanced thermal margins. Storage-coupled transformers are specified at capacity ratings 15-20% above nominal load to ride through frequent charge-discharge events. Grid-code revisions that privilege dry-type designs over oil-filled units, primarily for fire safety, further amplify uptake. Manufacturers offering pre-certified bidirectional units gain first-mover advantage, while utilities refine protection schemes to manage harmonics introduced by inverter-based storage.
Data Center Tax Incentives Fuel Infrastructure Investment
The federal infrastructure law enables accelerated depreciation for power hardware deployed at data center sites.[3] Northern Virginia’s corridor handles approximately 70% of global internet traffic, resulting in continuous expansion that necessitates redundant transformer banks for N-1 reliability. High-density computing loads require compact, low-loss dry-type units designed for operation in elevated ambient temperatures. The proliferation of edge computing extends these requirements to secondary markets in Texas and North Carolina. Transformer vendors positioned with modular, pluggable designs secure multi-site framework agreements and benefit from predictable roll-out schedules tied to tax-credit milestones.
Supply Chain Reshoring Creates Capacity Constraints
Congress allocated USD 1.2 billion to stimulate domestic manufacturing of medium-voltage equipment in 2024.[4] New plants in Georgia, South Carolina, and Tennessee are expected to increase volume beginning in 2026; however, interim supply remains tight, with standard lead times of 60-70 weeks and specialized VPI coils stretching to 18-24 months. Large OEMs, including Hitachi Energy, ABB, and Schneider Electric, are committing capital expenditures exceeding USD 3 billion combined to expand their U.S. capacity. The gap between demand and output forces buyers to place orders earlier, lock in slots, and consider dual-sourcing strategies, sustaining elevated backlog well into 2027.
Restraints Impact Analysis*
| Restraint | (~) % Impact on CAGR Forecast | Geographic Relevance | Impact Timeline |
|---|---|---|---|
| Copper and aluminum price volatility | -1.2% | Nationwide, pronounced in manufacturing hubs | Short term (≤ 2 years) |
| Lengthy UL-1561 certification lead times | -0.8% | Nationwide | Medium term (2-4 years) |
| Real-estate constraints in legacy substations | -0.6% | Dense urban centers | Long term (≥ 4 years) |
| OEM capacity limits for VPI coils | -0.5% | Nationwide | Medium term (2-4 years) |
| Source: Mordor Intelligence | |||
Material Price Volatility Pressures Margins
Aluminum averaged USD 2,100 per metric ton on the London Metal Exchange in 2024, 15% above the 2023 level, and trading bands indicate continued fluctuations through 2025. Raw materials account for up to 60% of the transformer manufacturing cost, yet supply contracts often fix selling prices months in advance. Price spikes compress margins for OEMs locked into legacy bids, while buyers face surcharges or re-quotations. Copper volatility compounds risk, prompting a shift toward aluminum windings where thermal specs allow. Some utilities adopt cost-adjustment clauses to share risk, but smaller contractors remain exposed, which can stall project awards during high-price intervals.
UL-1561 Certification Creates Deployment Bottlenecks
Underwriters Laboratories now requires 8-12 months to certify new dry-type designs and 4-6 months for derivative models due to testing backlogs.[5] DOE efficiency updates trigger design revisions, which in turn flood the certification queue. Small and mid-size manufacturers, unable to parallel-process multiple product lines, experience shipment delays that erode market share. Data-center and industrial customers seeking custom k-factor units face the longest waits, occasionally resorting to interim rentals. UL is expanding lab capacity, but meaningful cycle-time reductions are unlikely before 2026.
*Our forecasts treat driver/restraint impacts as directional, not additive. The impact forecasts reflect baseline growth, mix effects, and variable interactions.
Segment Analysis
By Power Rating: Small Units Anchor Distributed Growth
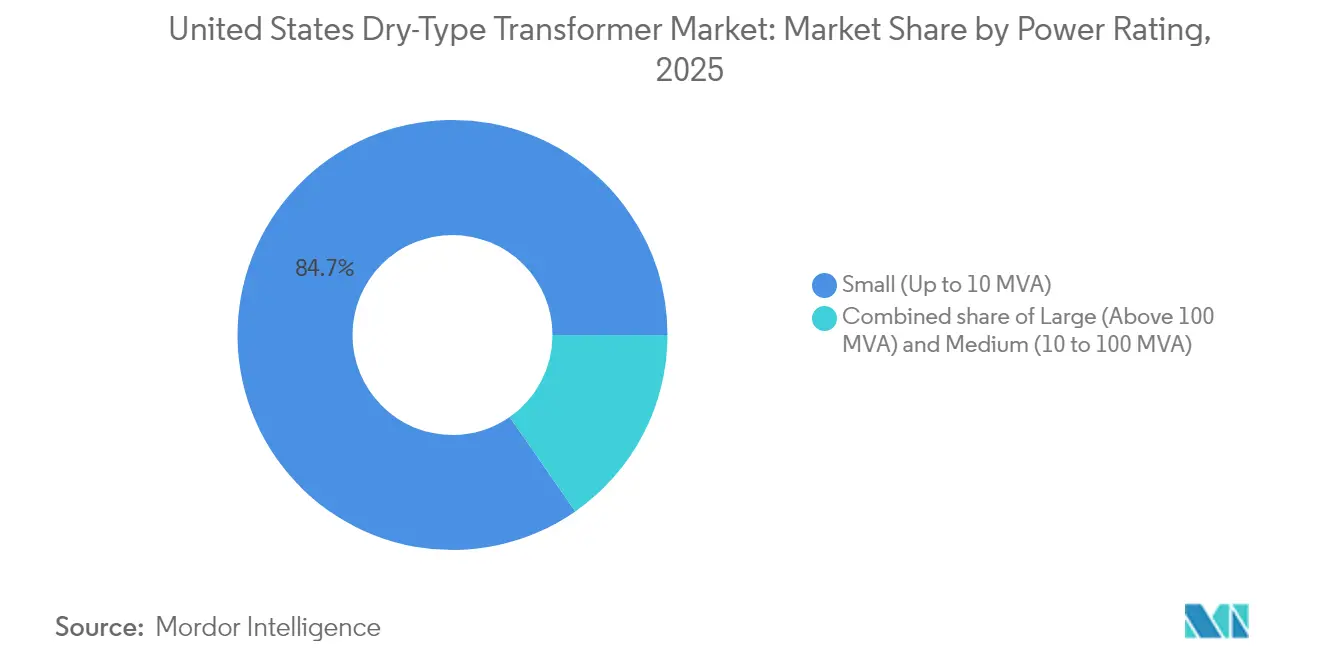
Small transformers, up to 10 MVA, accounted for 84.68% of 2025 shipments, translating to USD 1.79 billion of the US dry-type transformer market size. Their dominance stems from a distributed architecture that favors numerous localized installations over a few centralized assets. The segment is projected to grow at an 8.46% CAGR, benefiting from residential electrification and retrofit programs. Behind-the-meter storage and industrial heat-pump projects drive specification changes, requiring higher overload capacity and improved cooling. Standardized frame sizes enable economies of scale, but the increasing customization of storage and VFD-driven loads introduces engineering complexity. OEMs able to balance modularity with customization capture premium margins while meeting volume commitments.
Medium transformers (10-100 MVA) service utility substations and critical industrial feeders. Although representing approximately 12.15% of the US dry-type transformer market share in value, growth moderates to 7.05% as utilities focus capital expenditures on distribution-level modernization rather than capacity expansion. Large transformers above 100 MVA remain niche, aligning with transmission-level or hyperscale data center interconnects. Suppliers in this tier emphasize advanced insulation systems and partial-discharge monitoring to meet reliability targets.

By Phase: Single-Phase Upswing Compliments Three-Phase Base
Three-phase models retained a 66.82% share in 2025, underpinned by industrial motor loads and large commercial buildings. However, single-phase units are expected to clock a 8.92% CAGR to 2031, reflecting the boom in EV charging and heat pumps in residential neighborhoods. Utilities in California and New York are forecasting double-digit annual replacements of pole-top single-phase transformers to accommodate higher 240V loads. Level-2 EV chargers and induction cooktops drive peak currents that exceed the ratings of legacy transformers, necessitating proactive replacements. Residential rooftops with solar plus storage further compel bidirectional capability, a specification more commonly available in new single-phase offerings.
Three-phase demand continues in process industries, shifting toward high-efficiency configurations that align with DOE Phase 2 requirements. Vendors differentiate through core material innovations and embedded sensors that enable real-time thermal modeling. Growth softens as energy-intensive industries plateau, yet service-replacement cycles support a steady baseline of orders.
By Transformer Type: Distribution Units Dominate Modernization
Distribution transformers accounted for 79.25% of the US dry-type transformer market size in 2025, totaling USD 1.67 billion. Grid-modernization grants and resilience funding prioritize last-mile assets that improve reliability for residential and commercial users. Smart sensors integrated into distribution units feed utility SCADA platforms, enabling predictive maintenance and enhancing operational efficiency. The DOE Grid Modernization Initiative earmarks USD 3.5 billion for distribution-level upgrades, further sustaining demand.
Power transformers, although smaller in total value, capture specialized opportunities in edge data centers and renewable energy interconnects, where step-up or step-down functions bridge distribution and transmission voltages. Suppliers focusing on modular, skid-mounted designs are gaining traction due to reduced on-site assembly time. Advanced dry-type insulation materials widen the voltage window, positioning dry-type alternatives in applications historically served by oil-filled equipment.
By End-User: Residential Electrification Leads Growth
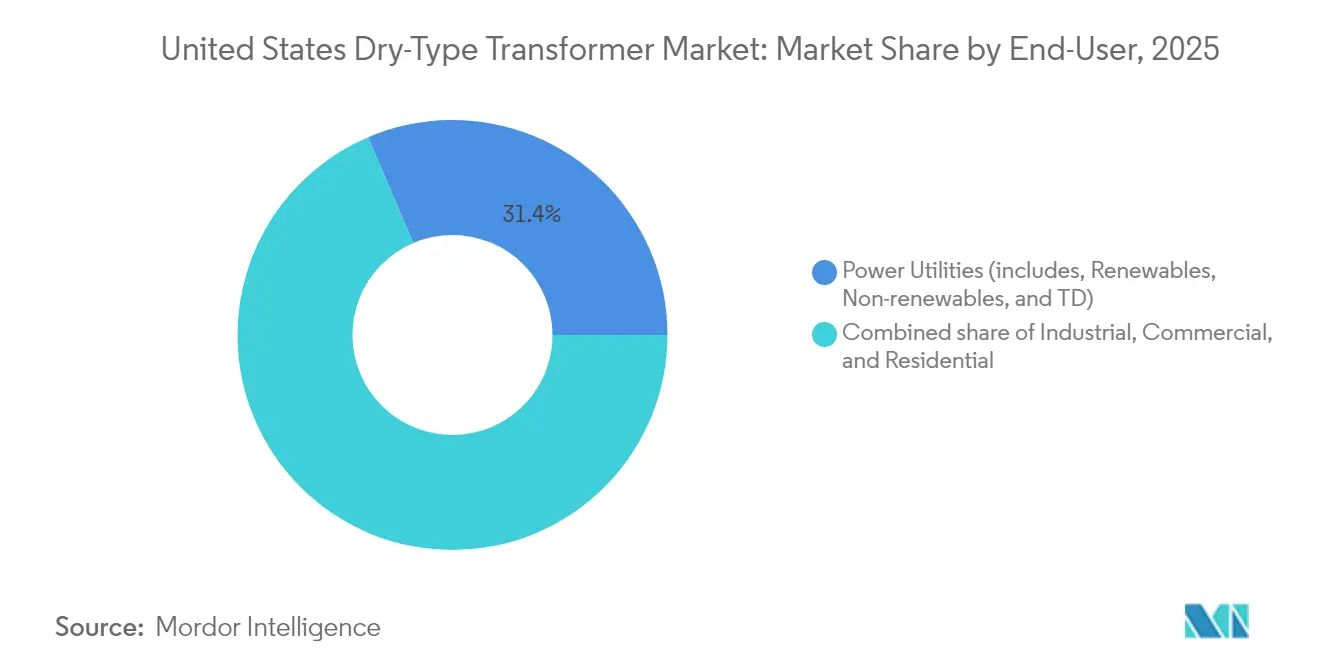
Power utilities remained the largest purchasers, accounting for 31.42% of 2025 revenue. However, the residential segment is expected to post the highest 9.18% CAGR through 2031, adding more than USD 350 million to the US dry-type transformer market size. Federal tax credits under the Inflation Reduction Act cover up to USD 14,000 per household for heat-pump installs, accelerating service upgrades at the transformer level. EV adoption compounds load growth; the average two-EV household can add 10-15 kVA of evening peak demand. Utilities pre-empt overloads with proactive pole-top replacements, often bundled with advanced metering infrastructure.
Industrial users, representing around 28.15% of the value share, are pivoting to electrified process heat and high-efficiency drives. Transformers designed for variable-frequency operation gain favor, especially in chemical and cement clusters that aim for Scope 1 emission reductions. Commercial buildings often adopt dry-type units during HVAC electrification retrofits, in response to building code bans on fossil-fuel appliances in New York City and San Francisco.
Geography Analysis
National policy harmonizes core specifications, but regional factors create nuanced demand pockets within the US dry-type transformer market. California, New York, and Massachusetts lead the adoption of decarbonization measures, accounting for a combined 27.65% of shipments in 2025. Utilities in these states deploy advanced monitoring features to manage rooftop solar backfeed and wildfire mitigation protocols.
The Southeast emerges as a manufacturing hub, buoyed by Hitachi Energy’s USD 1.75 billion Tennessee expansion and HD Hyundai Electric’s new facility in Georgia. Proximity lowers freight costs and shortens lead times for local utilities. Texas represents a unique dynamic under ERCOT’s isolated grid; the rapid build-out of renewable energy requires transformers with wide voltage-ride-through tolerances. Hurricanes in Gulf Coast states push demand for corrosion-resistant enclosures and elevated pad-mount designs.
Midwestern manufacturing belts focus on industrial electrification. States like Ohio and Indiana leverage reshoring incentives, requesting application-specific units for steel and chemical plants. Snow-belt regions prioritize cast-coil insulation capable of withstanding freeze-thaw cycles. The relatively uniform influence of federal standards ensures that even with regional customizations, suppliers can maintain platform commonality, balancing customization with scale.
Regulatory Landscape
The core federal regulatory anchor for dry-type distribution transformers is the US Department of Energy (DOE) Energy Conservation Program, with amended energy conservation standards for low-voltage and medium-voltage dry-type distribution transformers codified under 10 CFR 431.196. The April 2024 Final Rule (89 FR 29834) set the current efficiency requirements, with compliance required for units manufactured on or after April 23, 2029. This in turn shapes OEM redesign, certification, and procurement timelines across US utility and building markets.
In June 2026, DOE opened a new fact-finding step by publishing a Request for Information (Docket EERE-2026-BT-STD-0133) in the Federal Register to collect data on how the 2024 standards affect national security, domestic manufacturing capacity, and supply chain resilience. In parallel, an April 2026 Presidential Determination identified grid infrastructure supply chains, including distribution transformers and electrical core steel, as essential to national defense, reinforcing the policy focus on domestic availability alongside efficiency compliance.
Competitive Landscape
The US dry-type transformer market is dominated by global conglomerates, including ABB, Schneider Electric, and Siemens Energy, as well as specialized domestic firms such as MGM Transformer Company and Virginia Transformer Corp. No entity holds a share exceeding 15%, resulting in a moderate level of fragmentation. Scale players leverage integrated supply chains and R&D budgets to deliver high-efficiency models that align with DOE Phase 2 rules. Specialized firms compete on customization speed, localized service, and deep engineering support for niche applications, such as data-center redundancy or industrial heat pumps.
Strategic investment surged in 2024 and 2025. HitaUSEnergy allocated USD 1.75 billion to expand US capacity, targeting reduced lead times for advanced VPI coils. Eaton committed USD 340 million to its South Carolina plant, adding lines dedicated to North American grid standards. HD Hyundai Electric has launched medium-voltage production in Georgia, reflecting OEM confidence in the benefits of reshoring incentives. New entrants may encounter barriers in certification timelines and capital intensity; however, technology partnerships with storage integrators or heat-pump manufacturers offer alternative entry points.
Digitalization is the next frontier. ABB embeds fiber-optic temperature sensors for continuous thermal profiling, while Schneider Electric integrates EcoStruxure gateways for remote diagnostics. Vendors offering turnkey packages—transformers plus condition-monitoring software—differentiate themselves in utility bids by emphasizing the total cost of ownership. Competitive intensity will increase as domestic capacity expands and federal spending programs transition from award to execution phases.
United States Dry-Type Transformer Industry Leaders
-
ABB Ltd.
-
Schneider Electric SA
-
Siemens Energy Inc.
-
Eaton Corporation Inc
-
MGM Transformer Company
- *Disclaimer: Major Players sorted in no particular order
Market Opportunities and Future Outlook
A practical implementation window for suppliers is emerging from the multi-year changeover tied to the DOE distribution transformer efficiency standards finalized in April 2024 and effective for manufacturing from April 23, 2029. This is supporting demand for higher-efficiency dry-type designs and for services aimed at shortening time-to-deployment, including UL-1561 test-ready designs, standardized platforms that reduce re-qualification cycles, and engineering support for higher-loss sensitivity applications such as data centers and inverter-fed loads.
Domestic content alignment and localized production sit alongside technology opportunities. Buyers using federally funded grid and infrastructure programs increasingly prioritize Build America, Buy America-aligned sourcing, and NEMA Make it American certification has become a concrete procurement proof point for large electrical supply chains. On the demand side, CRS has highlighted an aging installed base of distribution transformers (about half older than 33 years), while growth in data center build-outs in Northern Virginia and Texas and the expansion of EV charging add load density and power-quality requirements that favor VPI coils, higher k-factor capability, and thermally robust designs for bidirectional operation in storage-coupled installations. Manufacturers expanding North American capacity since 2023, including projects cited for Hitachi Energy (South Boston, Virginia) and Siemens Energy (Charlotte, North Carolina), create openings for multi-year framework agreements tied to lead-time reduction and domestically manufactured components.
Recent Industry Developments
- June 2026: Schneider Electric announced that more than 20 of its US supply chain facilities are certified under the NEMA Make it American domestic content certification program. The certification supports customer qualification for federally funded projects and strengthens Schneider Electric's positioning for utility and data center electrification orders where domestic-content documentation is a bid requirement.
- March 2025: Schneider Electric announced an investment plan of more than USD 700 million through 2027 to expand and upgrade its US operations, citing demand from power infrastructure and AI-driven load growth. The program spans multiple states and targets supply-chain and production capacity that feeds equipment categories used in transformer-adjacent power distribution builds.
- April 2024: Schneider Electric announced a USD 140 million investment to expand its US manufacturing footprint to support critical infrastructure industries and data center demand. Added capacity and localization help address long lead times in electrical equipment supply chains, tightening coordination between transformer procurement and downstream switchgear and distribution gear availability.
Research Methodology Framework and Report Scope
Market Definition and Coverage
This market covers the value of dry-type transformers sold and installed in the United States, where insulation is air or resin based rather than oil filled. We count demand tied to new builds and replacements across common ratings, using both single-phase and three-phase applications.
Scope exclusions: We exclude liquid-filled transformers, and we exclude switchgear, cables, and standalone monitoring software when these are sold separately from the transformer.
Segmentation Overview
- By Power Rating
- Large (Above 100 MVA)
- Medium (10 to 100 MVA)
- Small (Up to 10 MVA)
- By Phase
- Single-Phase
- Three-Phase
- By Transformer Type
- Power
- Distribution
- By End-User
- Power Utilities (includes, Renewables, Non-renewables, and T&D)
- Industrial
- Commercial
- Residential
Data Sources, Market Sizing, and Validation
Desk Research
Desk research was used to set the base demand story and keep the sizing inputs realistic for the United States. We relied on public energy and grid sources such as the U.S. Energy Information Administration (EIA), U.S. Department of Energy programs and publications, the U.S. Census Bureau construction series, and Federal Energy Regulatory Commission (FERC) filings that signal network investment.
To link demand to procurement cycles, we also reviewed sources such as IEEE papers on transformer performance and loading, NFPA codes that affect indoor installation choices, and import and export statistics where relevant for component and equipment flows. These were supported by company annual reports, investor presentations, reputable press, and a paid subscription covering company financials and news to cross-check business mix and order commentary. The sources listed here are illustrative and not exhaustive, and many other references were used to collect, validate, and clarify the final dataset.
Primary Interviews and Surveys
Primary work focused on validating what gets purchased and at what price points across utility, industrial, commercial, and residential demand pools, then checking the split between distribution versus power dry-type units. We spoke with a mix of manufacturers, channel partners, engineering firms, and large buyers, and we used follow-up outreach when pricing or lead-time assumptions moved the model output in a visible way.
Distribution of primary research fieldwork respondents
| Company type | Respondent position |
|---|---|
| Top tier: 31% | CXOs: 13% |
| Mid tier: 54% | Functional/Unit leaders: 35% |
| Smaller Players: 15% | Managers: 52% |
Market-Sizing & Forecasting
The core model starts with a top-down build that reconstructs annual demand from U.S. electricity infrastructure activity and building-side electrical spend, then it is narrowed to where dry-type designs are typically specified. Once that demand pool is formed, we corroborate it with selective bottom-up checks, including sampled revenue roll-ups from key suppliers, channel checks on unit volumes, and an ASP times volume sanity check for common kVA brackets.
A few market fingerprints were treated as key inputs because they move totals in a clear way, including new commercial floor space additions, industrial project activity, grid upgrade spending signals, replacement cycles for installed electrical equipment, and the mix shift toward indoor and code-driven installations, including data centers. Pricing was handled through ASP ladders by rating and application, where we adjusted for copper and core material movements and for lead-time-driven pricing resets that interviews highlighted. For forecasting, scenario analysis was used around grid spending pace and construction demand, and each scenario was pressure-tested with primary feedback before the final trajectory was selected. Where bottom-up evidence was patchy for a niche application, we used conservative penetration assumptions and then revisited them during validation.
Data Validation & Update Cycle
Outputs were checked against independent signals, including public grid investment indicators, construction activity direction, and supplier commentary on order books, before the final values were signed off. When a segment showed an unusual jump or drop, the drivers were rechecked, followed by a second analyst review of inputs, formulas, and year-over-year logic.
The report is refreshed annually, and we also trigger interim updates when material events occur, such as sharp commodity price swings, policy changes, or supply constraints that alter delivered pricing and availability. Before delivery, an analyst completes a fresh review pass so the latest data points and validated assumptions are reflected in the market numbers.
Mordor Intelligence's United States Dry Type Transformer Market Sizing Compared With Other Published Estimates
Published market sizes for US dry-type transformers can vary because the market bucket is not always defined the same way, and because pricing timing is handled differently across estimates. In practice, the spread often comes from whether a figure covers dry-type only or bundles oil-immersed units, and whether it counts just distribution applications or also includes larger power transformers.
When copper-linked input costs and lead times move quickly, the year selected for exchange rates and the way ASPs are stepped up can shift the reported value even if unit demand is similar. By revalidating ASP ladders and year tagging of pricing close to publication, using distributor and buyer checks, Mordor Intelligence limits drift that can build up when older price points are carried forward.
Benchmark comparison
| Source | Market Size | Gaps in Research Methodology |
|---|---|---|
| Mordor Intelligence | USD 2.11 B (2025) | |
| Industry Research Bulletin A | USD 0.90 B (2023) | This figure is framed around dry-type distribution transformers, which can leave out dry-type power transformer demand and part of the utility-linked procurement that is not counted as indoor commercial and industrial installs. |
| Global Consultancy B | USD 5.21 B (2024) | This estimate is built for the broader U.S. power transformer market and includes multiple cooling types, so dry-type is not isolated and totals rise due to inclusion of oil-immersed units and wider rating coverage. |
The table indicates that most variance is explained by scope and year tagging, rather than by a single forecasting technique. Once the market is held to dry-type units in the United States and pricing is aligned to the stated year, the value sits between a distribution-only view and a broad transformer total, with steps that are traceable to practical inputs.
Key Questions Answered in the Report
How large is the United States Dry-Type Transformer Market in 2026?
The United States Dry-Type Transformer Market size is USD 2.28 billion in 2026, on track toward USD 3.4 billion by 2031.
What is driving the biggest demand spike for dry-type transformers?
DOE Phase-2 efficiency rules and residential electrification initiatives are generating the largest volume of replacement and new-build orders.
Why are single-phase transformers growing faster than three-phase units?
Home heat-pump installations, Level-2 EV chargers, and rooftop solar-plus-storage systems increase single-phase load, pushing utilities to upgrade pole-top units.
How do aluminum and copper price swings affect procurement?
Raw-material volatility can raise transformer costs by 10-15%, prompting utilities to include price-adjustment clauses in contracts or shift windings to lower-cost metals.
Will reshoring cut lead times quickly?
New factories come online in 2026-2027, so most buyers will still face extended delivery times through 2025.
Are dry-type transformers suitable for data centers?
Yes, compact, low-loss dry-type units with advanced cooling and redundancy features are now standard in data-center power designs, aided by federal tax incentives.