
Market Overview
| Study Period | 2020 - 2031 |
|---|---|
| Forecast Data Period | 2026 - 2031 |
| Historical Data Period | 2020 - 2024 |
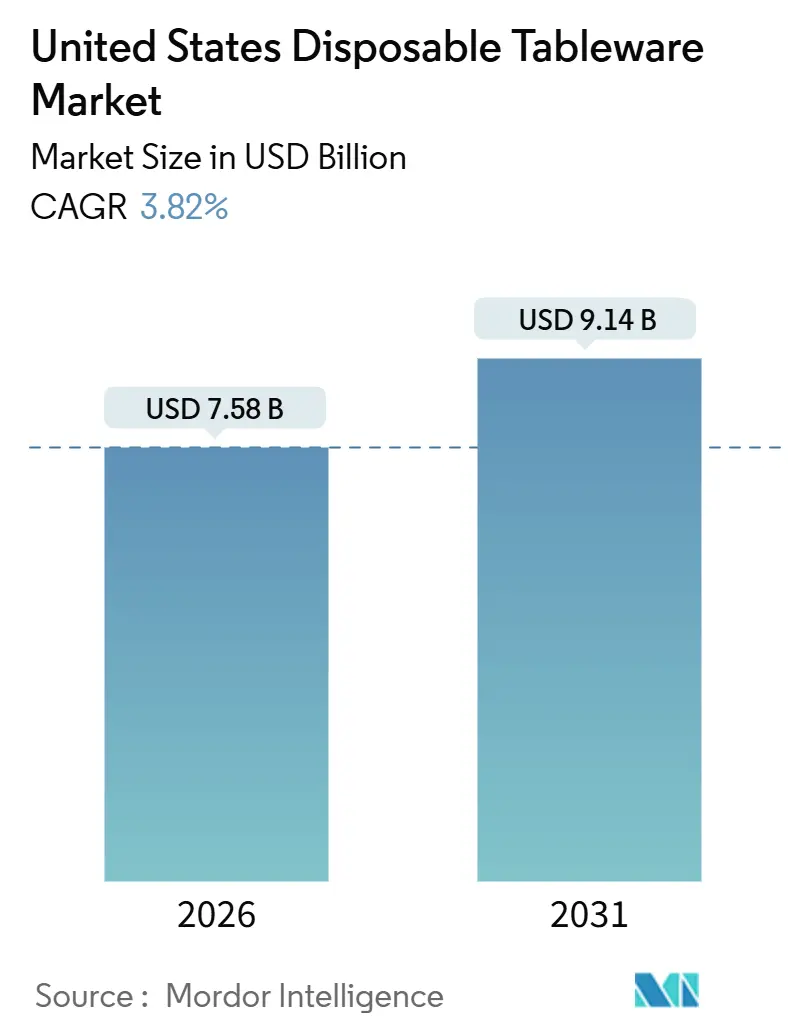
| Market Size (2026) | USD 7.58 Billion |
| Market Size (2031) | USD 9.14 Billion |
| Growth Rate (2026 - 2031) | 3.82 % |
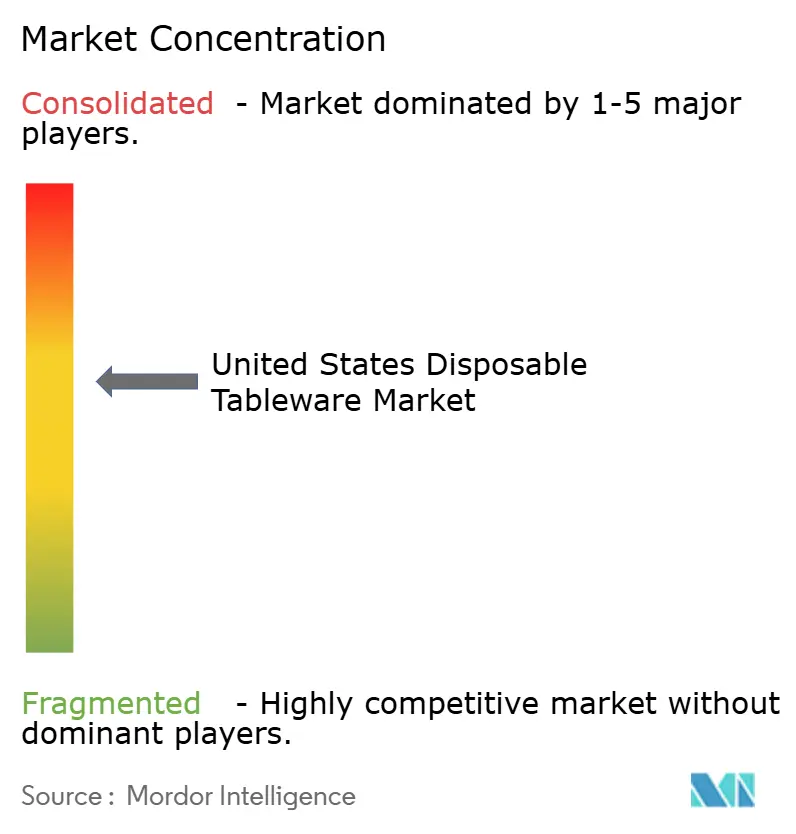
| Market Concentration | Medium |
Major Players *Disclaimer: Major Players sorted in no particular order Image © Mordor Intelligence. Reuse requires attribution under CC BY 4.0. | |
United States Disposable Tableware Market Analysis by Mordor Intelligence
The United States disposable tableware market size is USD 7.58 billion in 2026 and is projected to reach USD 9.14 billion by 2031, reflecting a 3.82% CAGR over the forecast period. Operators continue to standardize on single-use formats that support takeout, delivery, and high-throughput beverage programs. State-level restrictions on expanded polystyrene and non-essential single-use items are accelerating substitution toward paper, moulded fibre, and certified-compostable lines where compliance pressure is highest[1]Source: Sustainable Packaging Coalition, “Packaging Policy News: December 2025,” Sustainable Packaging Coalition, sustainablepackaging.org. Federal procurement policies under Secretarial Order 3407 (2022) targeted single-use plastics elimination, but May 2025 reversals by Interior Secretary Burgum disrupted frameworks, delaying private-sector transitions in tourism and retail industries. Capacity expansions in fibre-based tableware and portfolio realignments toward PFAS-free barriers reflect structural changes that support the availability of compliant products at scale.
Key Report Takeaways
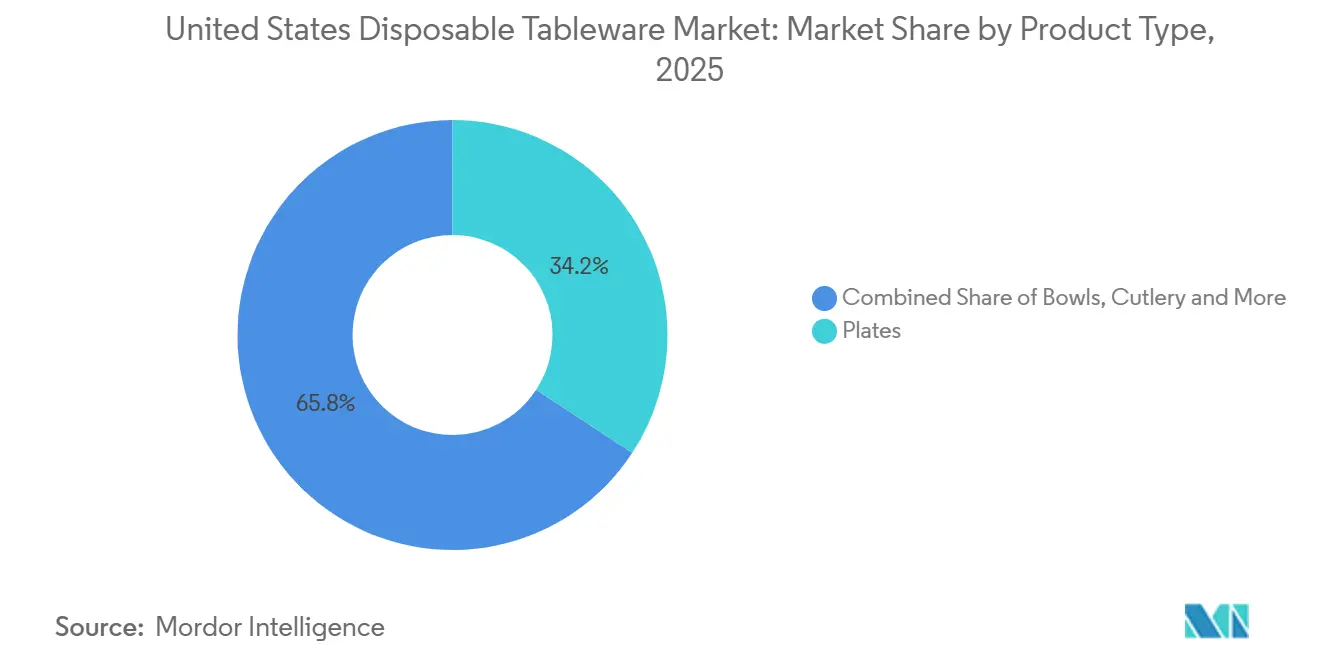
- By product type, plates led with 34.23% of the United States disposable tableware market share in 2025, while trays and containers are forecast to expand at a 4.94% CAGR to 2031.
- By material, plastic accounted for 47.92% of the United States disposable tableware market share in 2025, while bioplastics are projected to grow at a 5.13% CAGR through 2031.
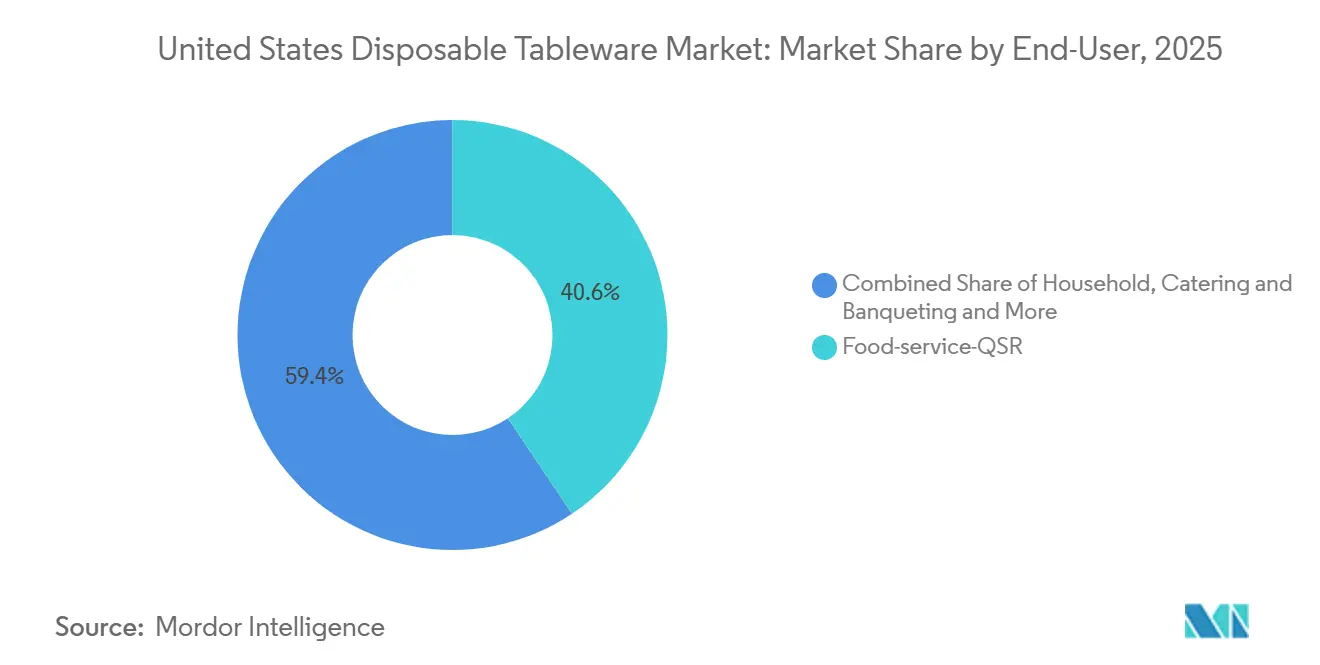
- By end-user, quick-service restaurants held 40.63% of the United States disposable tableware market share in 2025, while catering is set to expand at a 4.61% CAGR through 2031.
- By distribution channel, offline foodservice distributors held 54.91% of the United States disposable tableware market share in 2025, while online e-commerce channels are expected to grow at a 4.78% CAGR through 2031.
- By geography, the South region held 34.32% of the United States disposable tableware market share in 2025, and the West region is projected to record a 4.17% CAGR through 2031.
Note: Market size and forecast figures in this report are generated using Mordor Intelligence’s proprietary estimation framework, updated with the latest available data and insights as of January 2026.
United States Disposable Tableware Market Trends and Insights
Drivers Impact Analysis*
| Driver | (~) % Impact on CAGR Forecast | Geographic Relevance | Impact Timeline |
|---|---|---|---|
| Rising demand for convenient food-service solutions from QSRs | +1.2% | National, concentrated in the South and West urban corridors | Medium term (2-4 years) |
| Growth of e-commerce meal-kit & food-delivery services | +0.8% | National, strongest in Northeast metros and West Coast tech hubs | Short term (≤ 2 years) |
| Increasing on-the-go consumption & outdoor events | +0.5% | National, seasonal peaks in South and West during Q2 and Q4 | Short term (≤ 2 years) |
| Expansion of biodegradable and compostable product lines | +0.9% | West Coast and Northeast with organics mandates | Long term (≥ 4 years) |
| Surge in ghost-kitchen proliferation in Tier-2 cities | +0.6% | Midwest and South secondary MSAs | Medium term (2-4 years) |
| Corporate zero-waste catering programs | +0.4% | National, early adoption on the West Coast and institutions | Long term (≥ 4 years) |
| Source: Mordor Intelligence | |||
Rising Demand for Convenient Food-Service Solutions from QSRs
Quick-service formats keep the United States disposable tableware market on a stable footing because large networks rely on standardized, transit-ready packaging that moves quickly through drive-thru and delivery channels. Policy actions in major states have discouraged foam and certain single-use items, which pushes operators to align on compliant alternatives across multi-state footprints. This pattern reduces SKU complexity and favours paper, moulded fibre, and certified-compostable solutions in regions with strong enforcement. The combination of regulatory changes and scale purchasing reinforces consistent demand for plates, bowls, cups, lids, cutlery, and containers in the United States disposable tableware market.
Growth of E-commerce Meal-Kit & Food-Delivery Services
Online ordering, direct channels, and aggregator delivery require containers that keep food intact under stacking, transit, and varied hold times. Operators prioritize leak resistance, lid integrity, and tamper-evident packaging for main dishes, sides, and beverages, which leads to a higher use of trays, clamshells, bowls, and portion cups. Brands with multi-state operations select compliant packaging sets to avoid last-minute changes when local rules tighten, especially in the West and Northeast. Infrastructure access influences material picks, since compostable items need reliable collection and industrial processing to deliver intended end-of-life benefits. These conditions keep performance-focused single-use formats central to delivery-led growth in the United States disposable tableware market.
Increasing On-the-Go Consumption & Outdoor Events
Seasonal outdoor dining and high-traffic venues create demand spikes for plates, bowls, cups, lids, trays, and cutlery during peak months. Event organizers in leading states prefer compliant items and clear labelling to minimize contamination and meet municipal rules. West Coast programs often include organics collection, which can support food and packaging co-collection where facilities accept those items[2]Source: Closed Loop Partners, “Compostable Packaging Infrastructure Investment Report,” Closed Loop Partners, closedlooppartners.com. The availability of composting access remains uneven, which keeps many event series focused on fiber-based or recyclable selections that fit local conditions[3]Source: Sustainable Packaging Coalition, “New Composting Access Data 2025,” Sustainable Packaging Coalition, sustainablepackaging.org. As venue calendars expand, this mix sustains steady volume for single-use formats in the United States disposable tableware market.
Expansion of Biodegradable and Compostable Product Lines
PFAS restrictions in food-contact articles are prompting suppliers to replace legacy coatings with alternative barriers and to scale certified-compostable options. Producers have announced portfolio shifts to remove PFAS while maintaining grease and moisture performance for foodservice use cases. Policy updates in leading states reinforce the need for compliant alternatives and encourage faster catalogue updates by larger manufacturers. These moves are complemented by capacity investments in fibre-based lines that meet new standards for public and private procurement. As certified options expand, institutions and national accounts can scale consistent, compliant selections in the United States disposable tableware market.
Restraints Impact Analysis*
| Restraint | (~) % Impact on CAGR Forecast | Geographic Relevance | Impact Timeline |
|---|---|---|---|
| Stringent state-level bans on EPS and single-use plastics | -0.9% | West, Mid-Atlantic, select Northeast | Short term (≤ 2 years) |
| Volatility in pulp and paper input prices | -0.6% | National, stronger in import-reliant corridors | Medium term (2-4 years) |
| Emerging re-use subscription models in venues | -0.3% | West Coast metros and select institutions | Long term (≥ 4 years) |
| Limited industrial composting infrastructure | -0.5% | National, pronounced urban-rural divide | Long term (≥ 4 years) |
| Source: Mordor Intelligence | |||
Volatility in Pulp & Paper Input Prices
Fiber supply, energy costs, and logistics conditions drive variability in production costs for paper and moulded-fibre items. Integrated producers with captive pulp or large-scale contracts tend to manage volatility more effectively than smaller converters. Recent investments in Southern and Midwestern capacity indicate structural confidence in fibre-based demand, which supports regional supply depth and shorter lead times. Buyers balance cost variability with multi-year contracts and diversification by substrate to stabilize operations. This environment adds planning complexity and can slow switching decisions within the United States disposable tableware market.
Emerging Re-Use Subscription Models in Venues
Reusable container programs are expanding in controlled environments where returns and cleaning can be managed with on-site equipment and staff. Operators test deposit-return workflows and digital tracking in campuses and corporate facilities to reduce waste under stable conditions. Large packaging suppliers are partnering with reuse brands to learn deployment models and hedge exposure to policy shifts. These programs are still limited in scale and remain concentrated in select metros, which contains their near-term impact. The net effect is a localized restraint rather than a broad structural shift in the United States disposable tableware market.
*Our forecasts treat driver/restraint impacts as directional, not additive. The impact forecasts reflect baseline growth, mix effects, and variable interactions.
Segment Analysis
By Product Type: Transit-Optimized Containers Outpace Plates
Plates accounted for a 34.23% share of the United States disposable tableware market size in 2025, and trays and containers are projected to advance at a 4.94% CAGR through 2031. Delivery-centric models reward stackable footprints and tight lid seals that maintain temperature and texture under transit conditions. Multi-unit operators favour standardized sizes to simplify pick, pack, and order assembly. Beverage programs sustain steady volume for cups and lids across cold and hot occasions. These patterns keep procurement focused on predictable performance and fit across dayparts and menu builds in the United States disposable tableware market.
Delivery-only expansions illustrate the operational shift toward sealed containers, multi-compartment trays, and tamper-evident closures, especially in secondary metros with rising off-premise traffic. Regulatory transitions away from foam in key states encourage national brands to align on compliant containers to avoid sudden changes when rules tighten. These constraints support the relative outperformance of transit-optimized formats versus traditional plate-only setups. As a result, trays, clamshells, bowls, and portion-cup systems gain momentum across ordering channels in the United States disposable tableware market.


By Material Type: Regulatory Tailwinds Propel Bioplastics
Plastic retained 47.92% of the United States disposable tableware market share in 2025, while bioplastics are projected to grow at a 5.13% CAGR through 2031. PFAS restrictions in food-contact packaging are accelerating portfolio updates and barrier innovations that support compliant performance in grease and moisture applications. Vendors are removing PFAS and scaling alternative substrates, including moulded fibre and certified-compostable lines, to serve public-sector bids and large private accounts. Fiber-based capacity investments and egg-carton platform expansions provide supply-side reinforcement for moulded pulp and paperboard formats. This set of changes supports a durable shift toward compliant materials in the United States disposable tableware market.
Producers with integrated networks and regional plants are positioned to navigate feedstock volatility with shorter lead times and stronger quality control. New and expanded facilities in the South and Midwest indicate long-term confidence in fibre-based demand backed by policy tailwinds. As multi-state brands unify specifications, plastics remain in use where allowed, while fibre and compostable options gain traction in restricted jurisdictions. This balanced approach supports compliance while preserving operational continuity. The net effect is gradual mix evolution rather than abrupt displacement in the United States disposable tableware market.
By End-User: Ghost Kitchens Elevate QSR Dominance
Quick-service restaurants held 40.63% of the United States disposable tableware market share in 2025, and catering is projected to expand at a 4.61% CAGR through 2031. QSR purchasing emphasizes standardized containers, lids, and cutlery that can move across formats with minimal retraining and low error rates. Institutions adopt certified-compostable SKUs to support diversion goals where collection exists and where facilities accept food-contact packaging. Procurement teams seek consistent documentation and certifications to pass bid screens and operate across mixed markets. These needs keep end-user demand anchored to dependable and verifiable packaging in the United States disposable tableware market.
Delivery-only operations add predictable ordering patterns that favour sealed containers, tamper-evident closures, and stackable sizes. Institutions add long-duration contracts that support vendor investments in PFAS-free barriers and moulded fibre capacity. Catering growth aligns with client sustainability requests that require certified items and clear disposal instructions. These end-user dynamics preserve high-frequency consumption of plates, bowls, cups, lids, cutlery, and containers. The combined effect is stable, compliance-led adoption in the United States disposable tableware market.
By Distribution Channel: E-commerce Disrupts Foodservice Oligopoly
Offline foodservice distributors accounted for 54.91% of the United States disposable tableware market size in 2025, while online channels are projected to grow at a 4.78% CAGR through 2031. Broadline suppliers remain essential for multi-unit accounts that want consolidated deliveries and invoicing. Distributors also support compliance, certification tracking, and SKU vetting as state rules evolve, which raises the value of documentation and service support. E-commerce portals aggregate long-tail assortments and serve small and mid-sized operators with flexible ordering. That mix of offline and online access improves the availability of compliant products across regions in the United States disposable tableware market.
Large manufacturers are also building direct-to-business capabilities alongside distributor partnerships. Recent portfolio combinations broaden logistics reach, increase SKU depth, and make compliance-aligned assortments easier to deploy nationally. This dual approach helps brands respond to local policy shifts without disrupting service. As online channels scale, buyers still rely on distributor services for training and compliance support. The result is an omnichannel distribution structure in the United States disposable tableware market.
Geography Analysis
The South region accounted for 34.32% of the United States disposable tableware market size in 2025, and the West is projected to expand at a 4.17% CAGR through 2031. Southern share reflects a large base of quick-service and casual dining formats and ongoing investments in regional paper-based capacity, which tighten lead times and reinforce supply reliability. Western growth is tied to state-level restrictions that curb foam foodservice ware and require higher recovery performance, which drives substitution toward compliant lines. Municipal organics mandates and acceptance of compostable food-contact items in many facilities support scale use where programs operate. This policy and infrastructure alignment is a distinct feature of the West in the United States disposable tableware market.
The Midwest posts stable growth supported by delivery-only expansion into secondary metros and by supply-side investments in moulded fibre and paperboard. Regional plants support institutional buyers and private accounts that demand documented compliance and reliable deliveries. The Northeast combines dense urban demand with a regulatory environment that discourages specific single-use items and favours compliant alternatives. Organics program access continues to expand, although city-by-city differences remain important for end-of-life planning. These conditions shape procurement choices for institutions and national brands in the United States disposable tableware market.
Federal steps to phase out single-use plastics across public lands give the West a public-sector demonstration effect for compliant tableware selections. This influence extends beyond parks and concessions as suppliers and operators adapt labelling and certifications for broader use. The resulting standardization reduces switching costs when state or municipal rules tighten and improves training outcomes for staff. Where composting access is limited, buyers balance compostable benefits with practical considerations around disposal and contamination. These regional realities guide how products are selected and deployed in the United States disposable tableware market.
Regulatory Landscape
The United States disposable tableware market operates under FDA oversight for food-contact safety and marketing claims. The FDA regulates food-contact materials under the Federal Food, Drug, and Cosmetic Act and requires premarket authorization for new food contact substances, which affects substrate choices and testing requirements. State and local restrictions on packaging and single-use items, along with FTC guidance on environmental marketing claims under 16 CFR Part 260, also shape vendor communications and product labeling.
Key anchors include the May 8, 2025 Import Alert for Areca leaf and palm leaf dinnerware due to toxin migration concerns. At the federal level, Secretarial Order 3407 (2022) targeted elimination of single-use plastics in federal operations, and the May 2025 reversal disrupted public lands concession frameworks.
Value Chain Analysis
The value chain for disposable tableware in the United States runs from upstream sourcing of pulp, recycled fiber, and virgin materials through midstream converting and forming (including printing and coating) to downstream distribution and end-of-life pathways. Upstream input costs and availability differ by material category, with paper and fiber products tied to fiber supply and energy conditions, while plastic formats depend on internationally sourced resin.
Midstream production is handled by a mix of integrated producers and specialized converters. Downstream, broadline distributors support multi-unit customers, and distribution is increasingly influenced by e-commerce channels. End-of-life outcomes depend on local recycling and industrial composting acceptance, which in turn drives labeling and certification requirements for compostable and fiber-based products. Georgia-Pacific’s vertically integrated model, linking pulp production, manufacturing, and recycling operations, also illustrates how large players influence lead times and cost structures across the chain.
Competitive Landscape
The competitive field is moderately consolidated with multi-brand portfolios that span paper, moulded fibre, plastic, and compostable lines. Large players have invested in capacity, PFAS-free barriers, and certification-ready catalogues to fit policy-driven demand in key regions. Acquirers are combining logistics networks and broadening SKU depth to serve both distributor partners and direct enterprise accounts. This reach supports rapid deployment of compliant products and documentation across multi-state networks. These moves align portfolios with the needs of the United States disposable tableware market.
Recent combinations have unified complementary brand sets and created scale advantages in direct-to-business fulfillment. The largest of these transactions adds substantial SKU breadth and national coverage for food, beverage, and specialty packaging. Producers are also participating in reuse pilots and strategic investments to learn operational models and hedge long-term exposure to policy shifts. The combination of single-use innovation and selective reuse testbeds indicates an incremental approach to circularity. This balance is tuned to compliance and customer needs in the United States disposable tableware market.
Material innovation focuses on PFAS-free barriers, moulded fibre forming, and certifications that facilitate municipal acceptance and institutional bids. Vendors with integrated pulp and converting assets can better manage input volatility and lead times. Municipal and facility acceptance policies still vary by substrate and process, which makes labeling and documentation essential for scale use. These dynamics shape product roadmaps and capacity allocation across the United States disposable tableware market.
United States Disposable Tableware Industry Leaders
Dart Container Corporation
Georgia-Pacific LLC (Dixie)
Reynolds Consumer Products (Hefty)
Huhtamaki (Oscar Mayer Chinet)
Pactiv Evergreen Inc.
- *Disclaimer: Major Players sorted in no particular order

Market Opportunities and Future Outlook
Customized branded disposable tableware is gaining traction in multi-unit foodservice, with suppliers pointing to capacity expansions in fiber-based lines and PFAS-free barrier technologies as a way to scale compliant SKUs. The April 2025 completion of the Novolex and Pactiv Evergreen combination expanded national coverage and broadened the company’s brand and material portfolios, which supports coordinated packaging sets across regions that have different restrictions on single-use items.
Innovation themes center on lightweight and microwave-safe designs that fit delivery operations and high-throughput service. For environmental claims, institutional buyers typically require credible third-party certifications to clear bid screens. With composting infrastructure and organics programs still uneven across the country, products that use simpler material structures, provide clear disposal cues, and align with local collection realities tend to travel farther into regulated markets; West Coast organics programs and continued PFAS-free barrier transitions are key reference points for the compliant packaging shift.
Recent Industry Developments
- April 2026: Reynolds Consumer Products (Hefty) launched Peach Fabuloso scented trash bags as part of the Hefty Color Series with expanded distribution at major retailers. The move expands the branded packaging portfolio and strengthens presence in the disposable packaging ecosystem.
- March 2026: Georgia-Pacific LLC (Dixie) launched the Dixie Ultra Take-Two Interfold Napkin Dispenser. The dispenser expands point-of-use waste-reduction accessories for quick-service restaurants, improving operational efficiency and waste management, reinforcing tableware ecosystem footprint.
- February 2026: Reynolds Consumer Products (Hefty) expanded John Cena partnership to cover full portfolio under Strong Choice campaign. The expansion supports channel momentum and consumer pull for the Hefty brand in foodservice packaging.


Research Methodology Framework and Report Scope
Market Definition and Coverage
This market covers single-use tableware sold in the United States for food and beverage consumption, measured in revenue. It includes products meant to be discarded after use, whether they are paper-based, plastic-based, or fiber-based.
Scope exclusions: Reusable tableware, durable kitchenware, and small appliances are excluded even when sold through the same channels.
Segmentation Overview
- By Product Type
- Plates
- Bowls
- Cups & Lids
- Cutlery
- Trays & Containers
- Napkins & Others
- By Material Type
- Plastic
- Paper & Paperboard
- Bagasse / Molded Fiber
- Bioplastics (PLA, PHA)
- Aluminum Foil
- By End-User
- Household
- Food-service-QSR
- Food-service -Full-service Restaurants
- Catering & Banqueting
- Institutional (Schools, Hospitals)
- Others (Airlines, Events)
- By Distribution Channel
- Super/Hypermarkets
- Cash & Carry
- Food-service Distributors
- E-commerce Retail
- Online-Direct-to-Business Portals
- By Region
- Northeast
- Midwest
- South
- West
Data Sources, Market Sizing, and Validation
Desk Research
Desk research was used to set the market boundaries, identify the main demand pools, and sanity-check pricing and usage trends across the United States. We leaned on public data series and policy disclosures that shape single-use packaging demand, such as the US Census Bureau for population and spending context, the US Bureau of Labor Statistics for CPI and inflation signals, and the US International Trade Commission data to sense import pressure for tableware-related categories.
We also reviewed sources such as the US Food and Drug Administration for food-contact and materials guidance, and the US Environmental Protection Agency for waste and recycling context, along with association and standards body publications that track packaging and disposability trends. Company annual reports, investor presentations, press releases, and reputable news coverage helped map product mix changes and capacity additions. Where needed, select paid databases were used for company financials, patent lookups, and shipment-level trade checks. These desk sources are illustrative, not exhaustive, and many additional references were reviewed to collect, validate, and clarify inputs.
Primary Interviews and Surveys
Primary work was used to confirm what is actually being purchased and why, especially across foodservice operators, distributors, and packaging decision makers who see order patterns in real time. We also tested desk assumptions on material substitution, pack sizes, and pricing, and then refined the model where interview feedback pointed to clear gaps or timing differences across channels.
Distribution of primary research fieldwork respondents
| Company type | Respondent position |
|---|---|
| Top tier: 38% | CXOs: 13% |
| Mid tier: 43% | Functional/Unit leaders: 34% |
| Smaller Players: 19% | Managers: 53% |
Market-Sizing & Forecasting
Sizing starts with a top-down build where US consumption is reconstructed from a demand pool view tied to away-from-home food occasions, takeout and delivery intensity, and household use, which are then mapped to typical disposable tableware usage. To keep the totals realistic, results are corroborated through selective bottom-up approximations like sampled SKU price checks, channel markup checks, and supplier and distributor sense-checks on volume movement, before final totals are adjusted.
Key inputs used in the model include foodservice traffic and meal occasion mix, the pace of material shifting away from expanded polystyrene into paper and molded fiber, average selling price movement under inflation and resin or pulp cycles, mix changes across plates, cups, bowls, and cutlery, and the share of sales moving through retail versus foodservice distribution. Forecasting relies mainly on scenario analysis supported by a simple multivariate regression, where variables like inflation, food-away-from-home spend direction, and policy-driven substitution are used to guide the central case. When bottom-up signals are incomplete for smaller channels, gaps are handled using conservative penetration and mix assumptions that are later stress-tested in primary calls.
Data Validation & Update Cycle
Validation is done through multiple checks that compare the modeled market value against independent signals such as trade flow direction, observable price movement, and changes in foodservice and retail demand. Outliers are reviewed, and if the gap is large, follow-up outreach is triggered to re-check a key input like pricing cadence, material conversion timing, or channel mix.
Before sign-off, a second analyst reviews the logic, the math, and the link between each assumption and the supporting evidence, and then the full model is re-checked for internal consistency. Reports refresh annually, and interim updates are completed when major events materially change demand or pricing. Right before delivery, a final analyst pass is completed so clients receive the latest updated view.
Mordor Intelligence's United States Disposable Tableware Market Size Measured Against Other Published Estimates
Published market sizes for US disposable tableware can differ because category coverage and pricing logic are not handled the same way each time. In this market, the biggest differences usually come from whether adjacent items like food packaging are counted, and whether retail at-home demand is included alongside foodservice.
By tracking product-level mix changes and refreshing inflation-linked ASP inputs each update, Mordor Intelligence keeps the number tied to single-use plates, cups, bowls, and cutlery, rather than expanding into trays, clamshells, or broader disposable supplies.
Benchmark comparison
| Source | Market Size | Gaps in Research Methodology |
|---|---|---|
| Mordor Intelligence | USD 7.58 B (2026) | |
| Industry Association A | USD 8.31 B (2026) | Likely includes adjacent single-use food packaging items like trays and clamshells along with tableware, which expands the revenue pool beyond core tableware products. |
| Trade Journal B | USD 6.90 B (2025) | Uses an earlier base year and a narrower channel view that can undercount retail-led at-home demand, and it may not fully reflect recent price inflation in the category. |
The spread across sources mainly comes down to what gets included in the product basket and which year the prices are anchored to. When inclusions are kept consistent and assumptions are re-tested with channel feedback, the final total becomes easier to replicate and compare across planning cycles.


Key Questions Answered in the Report
What is the current size and projected growth of the United States disposable tableware market?
The United States disposable tableware market size is USD 7.58 billion in 2026 and is projected to reach USD 9.14 billion by 2031 at a 3.82% CAGR.
Which segments are expanding fastest within the United States disposable tableware market?
Trays and containers are projected to grow at a 4.94% CAGR, bioplastics at a 5.13% CAGR, online channels at a 4.78% CAGR, and catering at a 4.61% CAGR.
How are regulations shaping material choices in the United States disposable tableware market?
State-level rules discourage foam and PFAS in food-contact packaging, which accelerates a shift to PFAS-free barriers, molded fiber, and certified-compostable options.
What regional factors drive adoption patterns across the United States?
The South holds the largest 2025 share at 34.32%, while the West grows fastest due to policy and organics programs; local composting access often determines end-of-life pathways.
Which developments could influence supply reliability?
New United States paper-based capacity, fiber platform investments, and portfolio combinations increase SKU depth and improve compliance-aligned supply in regulated states.
How do institutional buyers affect demand in this space?
Institutions prioritize certified-compostable options and clear documentation for audits, which supports steady adoption where organics collection programs accept food-contact packaging.
Page last updated on:


 Your data is secure and never sold or shared.


