
Market Overview
| Study Period | 2020 - 2031 |
|---|---|
| Forecast Data Period | 2026 - 2031 |
| Base Year Market Size (2025) | USD 5.28 Billion |
| Market Size (2026) | USD 5.66 Billion |
| Market Size (2031) | USD 8.02 Billion |
| Growth Rate (2026 - 2031) | 7.21 % |
| Market Concentration | Medium |
Major Players *Disclaimer: Major Players sorted in no particular order Image © Mordor Intelligence. Reuse requires attribution under CC BY 4.0. | |
United States Digital X-ray Devices Market Analysis by Mordor Intelligence
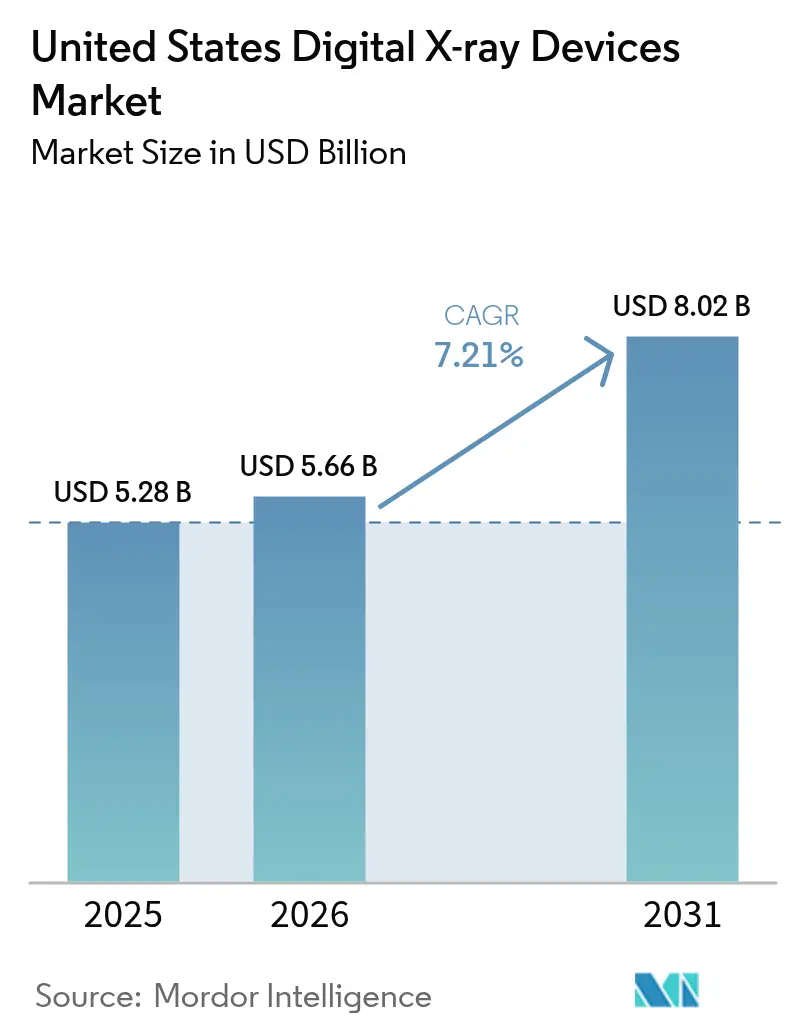
United States Digital X-ray Devices Market size in 2026 is estimated at USD 5.66 billion, growing from 2025 value of USD 5.28 billion with 2031 projections showing USD 8.02 billion, growing at 7.21% CAGR over 2026-2031.
The shift from conventional X-ray imaging to digital X-Ray imaging is a rapid process, and it is expected to become the most widely used imaging method in the United States.
The COVID-19 pandemic is expected to boost the growth of the digital x-ray devices market in view of the increasing demand for chest X-rays. Also, digital X-ray devices provide digital images, which is a very important advantage amid the current pandemic, as the maintenance of films could lead to a tedious workflow. Also, many players are actively involved in the development of advanced digital X-ray imaging solutions to be used for COVID-19 diagnosis. For instance, in May 2020, the United States FDA approved Aspenstate's AiRTouch Portable X-ray System to obtain rapid chest X-rays among the SARS-Cov-2 virus-infected patients. Thus, in view of the ongoing pandemic and the extensive use of imaging solutions for the accurate diagnosis and treatment of infection in patients, the digital X-ray devices market is expected to be significantly impacted.
The advantage of exposure to a lower radiation dose by patients is expected to boost the adoption to digital imaging and, thus, aid in the increase of workflow and efficiency, along with the increase in patients' safety. Currently, with the surging costs of medicines, lowering the cost per procedure while increasing safety is important for better patient care.
The Consolidated Appropriations Act of 2016, which favors digital imaging over other methods, reduces Medicare payments by 20% for providers using analog X-ray studies. Thus, for those performing imaging studies on computed/digital radiography equipment, payments may be reduced by 7% during 2018-2022 and 10% thereafter. This factor may positively influence the growth of the United States digital X-ray devices market.
Also, as per the research article titled 'Femoral Neck Fractures 2020', annually, there would be approximately 300,000 cases of hip fractures in the United States by 2030. The economic burden of hip fractures is among the top 20 expensive diagnoses, with approximately USD 20 billion spent on the management of this injury annually.
Thus, the growing prevalence of medical conditions that require X-ray imaging, increasing technological innovations, and government policies may aid the growth of the US digital X-ray devices market over the forecast period.
Note: Market size and forecast figures in this report are generated using Mordor Intelligence’s proprietary estimation framework, updated with the latest available data and insights as of 2026.
United States Digital X-ray Devices Market Trends and Insights
The Direct Radiography Segment is Expected to Witness a High CAGR Over the Forecast Period
Direct radiography is anticipated to observe significant growth and hold a major market share in the US digital X-ray devices market over the forecast period. The major factors driving the growth of the segment include the increasing research and development activities undertaken by key players for the innovation of novel products with sophisticated features and the high standards of healthcare facilities in the country.
Direct digital radiography (DDR) directly captures the image at the detector with no requirement for any intermediate interface. Thus, it aids in a flexible and smooth workflow. Hence, the added benefits of increased efficiency and productivity of direct radiography over other X-ray imaging technologies are boosting the demand for the increased development and launch of products based on direct radiography technology. For instance, in August 2020, Carestream Health, a United States-based medical device company, launched its DRX -Compass X-ray System, a digital unit for mid-tier hospitals and medical imaging centers worldwide that can be used by urgent care centers, orthopedics, and large radiology practices. Thus, they aimed to accelerate the commercialization of dynamic digital radiography in the US healthcare market. Thus, given the advanced features of direct radiography and the growing focus by key players on R&D activities, the segment is expected to witness tremendous growth in the United States over the forecast period
DDR systems provide a high-speed workflow for technologists and facilitate speeded-up patient management, which is especially important in outpatient settings where patients need to return to home or work. Less than 1 minute is needed between exposure and image acquisition.
Competitive Landscape
The digital X-ray devices market is moderately competitive, and a few companies are currently dominating the market. These companies include GE Healthcare, MinXray Inc., Varex Imaging Corporation, Carestream Health, and Fujifilm Holdings Corporation, among others. The competition in the market is majorly based on technological advances and the pricing of digital X-ray equipment. Additionally, major players have been involved in various strategic alliances, such as acquisitions and collaborations, along with the launch of advanced products, to secure key positions in the United States market.
United States Digital X-ray Devices Industry Leaders
-
MinXray, Inc.
-
Carestream Health
-
General Electric Company (GE Healthcare)
-
Fujifilm Holdings Corporation
-
Canon Medical Systems Corporation
- *Disclaimer: Major Players sorted in no particular order

Market Opportunities and Future Outlook
Replacement and upgrade demand in general radiography creates a clear runway for vendors, with industry commentary pointing to a replacement cycle as systems purchased around 2016 approach end-of-life. This is reinforced by US reimbursement mechanics that penalize analog imaging under the Consolidated Appropriations Act of 2016, keeping provider attention on moving to digital radiography and refreshing detectors and rooms to protect workflow and economics.
A second opportunity area is the shift from standalone hardware toward AI-enabled radiography workflows, supported by the FDA pathway for AI-enabled medical devices through the FDA Digital Health Center of Excellence and the AI/ML-Enabled Medical Device List. On the demand side, recent provider-side expansion and consolidation activity in outpatient imaging supports demand for scalable, standardized digital X-ray fleets and software layers, including RadNet forming a joint venture with Saint Alphonsus Health System to acquire five outpatient imaging centers in Boise, Idaho (with DeepHealth deployment referenced by the parties), and Lumexa Imaging adding four imaging centers across multiple US states. On the supplier side, new image-processing and detector innovations focused on low-dose and efficiency, including Rayence launching SHINE for static digital radiography (July 2026), indicate ongoing whitespace around dose reduction, throughput, and consistency, particularly in portable and high-utilization settings.
Recent Industry Developments
- June 2026: Carestream announced worldwide availability of its Lux HD 35 and Lux HD 43 glass-free digital X-ray detectors. The launch focuses on higher durability and consistent image quality, including a 100-micron pixel pitch and improved ingress protection. Providers seeking rugged detectors for high-throughput DR workflows are the target use case.
- September 2025: MinXray reported that its Impact Wireless Digital X-ray System advanced as one of three portable units in the second round of NASA testing for future human space exploration missions. The continued evaluation underscores the role of portable, wireless DR systems in demanding environments and supports differentiation on reliability and mobility.
- October 2024: FUJIFILM Healthcare Americas Corporation announced the US launch of the FDR Go iQ portable digital radiography system. This expands portable DR offerings for bedside imaging and supports hospital and outpatient providers looking for flexible roomless imaging capacity.
Research Methodology Framework and Report Scope
Market Definition and Coverage
For this methodology, the market covers revenue generated from digital X-ray imaging devices sold and used in the United States across medical and dental imaging settings, where images are captured through digital detectors or computed radiography systems.
Scope exclusions: We exclude analog film-based X-ray systems and do not treat installation, maintenance, or imaging services as separate revenue lines in the device market value.
Segmentation Overview
- By Application
- Orthopedic
- Cancer
- Dental
- Cardiovascular
- Other Applications
- By Technology
- Computed Radiography
- Direct Radiography
- By Portability
- Fixed Systems
- Portable Systems
- By End User
- Hospitals
- Diagnostic Centers
- Other End Users
Data Sources, Market Sizing, and Validation
Desk Research
Desk research started with clarifying how digital radiography is defined and how demand is formed across hospitals, diagnostic centers, and dental clinics. We referenced public and official materials such as the FDA device databases, the CDC and National Center for Health Statistics (for care delivery and imaging utilization context), CMS policy and payment references that influence imaging volumes, and USITC trade statistics for directional signals on imaging equipment movements.
We also reviewed company annual reports, investor presentations, product brochures, and reputable healthcare press to understand replacement cycles, portability trends, and detector adoption. For cross-checks on patents, approvals, and product launch timing, a paid patent database and a paid company financials and news subscription were used when needed. The desk sources listed here are illustrative only, and many other public documents were also referred to for data collection, validation, and clarification.
Primary Interviews and Surveys
Primary work was used to pressure-test the model assumptions that desk research cannot fully confirm, mainly around unit shipment mix, average selling price movement, and how quickly computed radiography is being replaced by direct radiography. We spoke with a mix of manufacturers, distributors, imaging department leaders, and service partners across the United States so that demand-side replacement timing and supply-side shipment expectations could be aligned before totals were finalized.
Distribution of primary research fieldwork respondents
| Company type | Respondent position |
|---|---|
| Top tier: 36% | CXOs: 12% |
| Mid tier: 49% | Functional/Unit leaders: 40% |
| Smaller Players: 15% | Managers: 48% |
Market-Sizing & Forecasting
Sizing was built using top-down and bottom-up checks, with the main structure starting from the US digital imaging equipment demand pool and then allocating it to digital X-ray based on replacement and adoption patterns by care setting. In practice, the model used modality upgrade rates (CR to DR), procedure mix by setting, and purchasing cycles to reconstruct annual device demand before values were derived.
To keep the totals realistic, we corroborated the outputs with selective bottom-up approximations such as sampled average selling prices by system type, channel checks on portable versus fixed mix, and sanity checks against reported imaging equipment revenue exposure from public filings. Key inputs used in the model included installed base turnover, portable system penetration in point-of-care use, detector pricing direction, typical capital budget timing in provider systems, and the share of dental imaging that is captured under digital X-ray devices. When data was missing at a detailed level, gaps were handled through ranges validated by interviews and then narrowed using the most consistent signals across sources.
Forecasting relied on scenario analysis supported by a short list of leading indicators that can be tracked each year, such as capital equipment spending outlook, outpatient shift for imaging, and the pace of DR replacement. The final forecast path was chosen after assumptions were reviewed against what interviewees expected for procurement timing and pricing behavior.
Data Validation & Update Cycle
Validation was done through stepwise triangulation, where outputs were compared against independent signals like implied unit volumes, expected replacement cycles, and the share of portable systems seen in channel discussions. Any large variances were flagged, investigated for input errors or scope leakage, and then reviewed again before sign-off.
We also run reasonability checks across years so that price and volume changes do not move in conflicting directions without a clear explanation. Reports are refreshed annually, and interim updates are made when material events occur, such as policy changes or major technology shifts. Before delivery, a fresh pass is completed to confirm the latest available public updates and incorporate any new interview feedback that affects key assumptions.
Mordor Intelligence's United States Digital X Ray Devices Market Size Compared Against Other Published Estimates
Published market sizes can vary even when the topic sounds the same, since each publisher may group different device types together, choose a different base year, or apply a different approach to pricing and replacement cycles. We see the largest spreads when digital X-ray is mixed with adjacent modalities or when old-year values are carried forward without re-checking the latest demand indicators.
Some external estimates fold in a wider radiography basket, including digital mammography under digital X-ray. In Mordor Intelligence, we count digital X-ray devices through the CR and DR technology lens and keep the sizing tied to device revenue in the United States, which prevents double counting across neighboring imaging categories.
Benchmark comparison
| Source | Market Size | Gaps in Research Methodology |
|---|---|---|
| Mordor Intelligence | USD 5.28 B (2025) | |
| Industry Data Publisher A | USD 5.12 B (2023) | Uses an earlier base year and includes an application basket that explicitly lists digital mammography, which can lift totals versus a device-only digital radiography view. The longer historical window can also smooth pricing swings that show up in more recent procurement cycles. |
| Global Market Press Release B | USD 5.40 B (2024) | Reports a global total rather than a US-only figure, so the number is not comparable without a regional split. It also summarizes revenue across many regions and segments at a high level, which limits visibility into what portion is strictly US device sales versus broader system configurations. |
Across the table, the main drivers behind the differences are geography alignment (United States only versus global), the inclusion of adjacent applications, and the choice of base year used for the starting value. By keeping the scope centered on US device revenue and validating key inputs like CR to DR replacement and portable mix through interviews, the estimate stays traceable to clear assumptions that can be revisited during updates.
Key Questions Answered in the Report
How big is the United States Digital X-ray Devices Market?
The United States Digital X-ray Devices Market size is expected to reach USD 5.66 billion in 2026 and grow at a CAGR of 7.21% to reach USD 8.02 billion by 2031.
What is the current United States Digital X-ray Devices Market size?
In 2026, the United States Digital X-ray Devices Market size is expected to reach USD 5.66 billion.
Who are the key players in United States Digital X-ray Devices Market?
MinXray, Inc., Carestream Health, General Electric Company (GE Healthcare), Fujifilm Holdings Corporation and Canon Medical Systems Corporation are the major companies operating in the United States Digital X-ray Devices Market.
What years does this United States Digital X-ray Devices Market cover, and what was the market size in 2025?
In 2025, the United States Digital X-ray Devices Market size was estimated at USD 5.66 billion. The report covers the United States Digital X-ray Devices Market historical market size for years: 2019, 2020, 2021, 2022, 2023 and 2024. The report also forecasts the United States Digital X-ray Devices Market size for years: 2026, 2027, 2028, 2029, 2030 and 2031.