
Market Overview
| Study Period | 2020 - 2031 |
|---|---|
| Forecast Data Period | 2026 - 2031 |
| Base Year Market Size (2025) | USD 8.25 Billion |
| Market Size (2026) | USD 9.83 Billion |
| Market Size (2031) | USD 23.57 Billion |
| Growth Rate (2026 - 2031) | 19.12 % |
| Market Concentration | Low |
Major Players *Disclaimer: Major Players sorted in no particular order Image © Mordor Intelligence. Reuse requires attribution under CC BY 4.0. | |
United States Digital Freight Forwarding Market Analysis by Mordor Intelligence
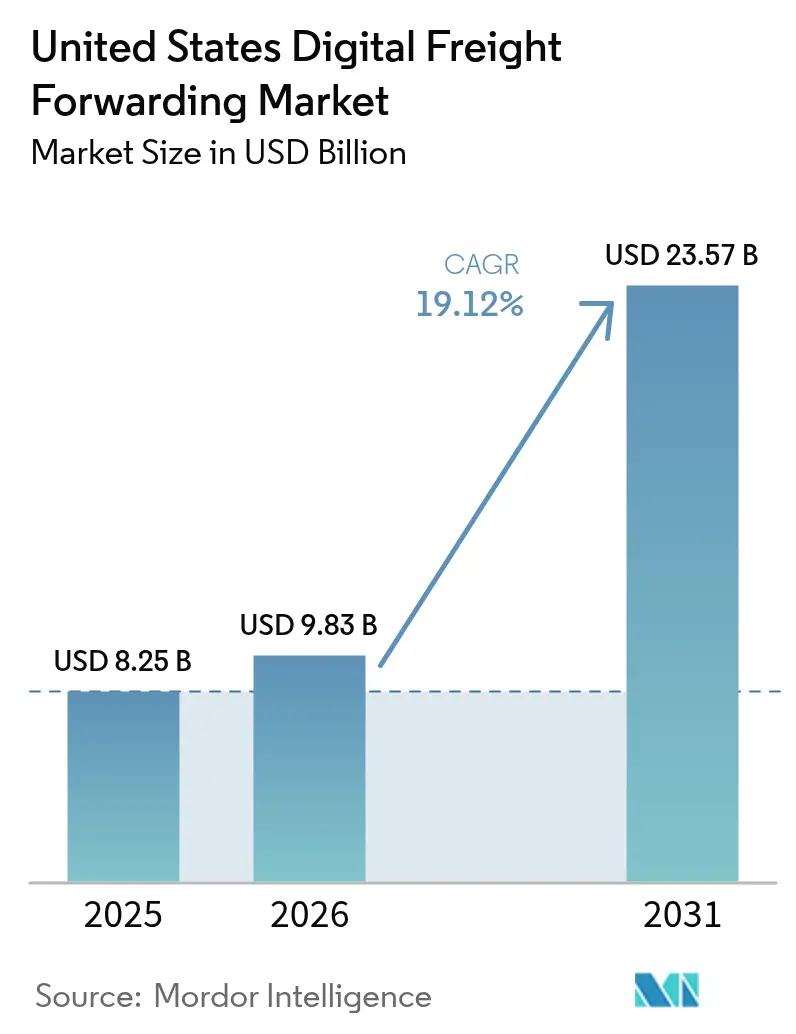
The United States Digital Freight Forwarding Market size was valued at USD 8.25 billion in 2025 and estimated to grow from USD 9.83 billion in 2026 to reach USD 23.57 billion by 2031, at a CAGR of 19.12% during the forecast period (2026-2031).
Escalating e-commerce parcel volumes, rapid near-shoring to Mexico, and the rollout of the Automated Commercial Environment (ACE) have placed real-time visibility, automated customs clearance, and API-driven collaboration at the heart of the United States digital freight forwarding market. Platforms that align with new SEC cyber-incident rules by maintaining SOC-2 compliance are attracting large shippers seeking resilient data infrastructures. Meanwhile, AI-powered pricing engines are mitigating volatile ocean spot rates, and near-shoring initiatives are refashioning cross-border trade corridors, which now exceed 320,000 annual freight movements. These forces collectively unlock fresh opportunities for agile providers to streamline costs, improve shipment reliability, and deepen customer loyalty.
Key Report Takeaways
- By function, Transportation Management captured 45.72% of the United States digital freight forwarding market share in 2025, whereas Value-added Services is advancing at an 10.94% CAGR through 2031.
- By end-user, Retail & E-commerce held 36.48% of the United States digital freight forwarding market size in 2025, while Healthcare & Pharma posts the highest growth at 11.86% CAGR to 2031.
- By deployment mode, Cloud solutions dominated with 65.32% share in 2025 and are also expanding fastest at 9.98% CAGR through 2031.
- By firm type, Large Enterprises accounted for 53.22% share in 2025, whereas the SME segment is rising at 9.05% CAGR to 2031.
- By U.S. region, the West led with 28.64% share in 2025; the South registers the fastest growth at 15.21% CAGR through 2031.
Note: Market size and forecast figures in this report are generated using Mordor Intelligence’s proprietary estimation framework, updated with the latest available data and insights as of 2026.
United States Digital Freight Forwarding Market Trends and Insights
Drivers Impact Analysis*
| Driver | % Impact on CAGR Forecast | Geographic Relevance | Impact Timeline |
|---|---|---|---|
| E-commerce boom driving small-parcel import volumes | +3.2% | National; West & Northeast focus | Medium term (2-4 years) |
| Demand for end-to-end shipment visibility & real-time analytics | +2.8% | National; early in West & South | Short term (≤ 2 years) |
| Digitized customs clearance via ACE & USMCA reduces dwell time | +2.1% | Border states; expanding nationwide | Long term (≥ 4 years) |
| SEC cyber-incident rules push SOC-2-compliant platforms | +1.9% | National; large enterprises | Medium term (2-4 years) |
| Near-shoring to Mexico spurs cross-border digital corridors | +3.4% | South & West | Long term (≥ 4 years) |
| Softening cyber-insurance rates unlock mid-market adoption | +1.8% | National; SME focus | Short term (≤ 2 years) |
| Source: Mordor Intelligence | |||


E-commerce Boom Driving Small-Parcel Import Volumes
U.S. e-commerce reached USD 833.8 billion in 2024, representing 15.5% of total retail, and cross-border parcels already account for 5% of that value. Parcel volumes are projected to hit 29 billion by 2029 at a 5% CAGR, flooding last-mile networks and forcing a shift toward high-velocity, low-value shipment orchestration. Digital freight forwarders are embedding automated customs algorithms and AI route optimization to manage thousands of daily entries under Entry Type 86. Real-time retail expectations compel carriers to deliver low-cost two-day shipping, intensifying pressure on traditional forwarders to digitize. Companies lacking these capabilities risk losing share in the United States digital freight forwarding market to technology-native rivals capable of processing small-parcel data at scale[1]“ACE and Automated Systems,” U.S. Customs and Border Protection, cbp.gov.
Demand for End-to-End Shipment Visibility and Real-Time Analytics
Only 20% of forwarders had comprehensive visibility in place by 2024, yet shippers increasingly rank reliability above pure speed. IoT sensors, cloud dashboards, and predictive analytics are replacing manual status emails, enabling proactive exception management. McKinsey notes 90% of U.S. consumers still prioritize cost, but on-time delivery remains mandatory. Uber Freight’s generative-AI platform illustrates the payoff: 24 million loads processed annually with dynamic ETA predictions and alternative routing suggestions. This capability increasingly differentiates providers as shippers demand data-rich service.
Digitized Customs Clearance via ACE and USMCA Reduces Dwell Time
CBP’s ACE modernization now automates cargo detention notices and prompts mandatory ACE IDs, cutting paperwork and port dwell time. USMCA provisions, including the Entry Type 86 de-minimis threshold, allow goods valued under USD 800 to clear faster, further lifting the United States digital freight forwarding market. Digital forwarders integrate ACE APIs with routing engines to supply real-time compliance checks, minimizing human error. As processing bottlenecks shrink, border throughput climbs, drawing more shippers toward API-ready platforms[2]“2024 WMS Software Report,” STIQ, stiqreport.com.
Near-shoring to Mexico Spurs Cross-Border Digital Corridors
Mexico overtook China as the United States’ top trading partner in 2024, posting USD 475.6 billion in bilateral trade. Foreign direct investment into Mexico is forecast to exceed USD 60 billion by 2027, underpinning 450 new factories along the border. Container flows from China to Mexico jumped 59.7% in January 2024 and another 26.2% by July, underscoring the pivot. Digital freight forwarders are embedding Carta Porte invoice modules, multi-modal tracking, and AI-powered ETA engines to orchestrate cross-border moves in near real time. These capabilities shorten clearance windows, enhance compliance, and strengthen shipper confidence in the United States digital freight forwarding market.
Restraints Impact Analysis*
| Restraint | % Impact on CAGR Forecast | Geographic Relevance | Impact Timeline |
|---|---|---|---|
| Fragmented carrier base slows API onboarding | -2.1% | National; fragmented regions | Medium term (2-4 years) |
| Volatile ocean spot rates hamper instant quoting accuracy | -1.8% | Coastal, import-heavy | Short term (≤ 2 years) |
| Ransomware incidents disrupt logistics tech platforms | -1.4% | National; tech-centric regions | Short term (≤ 2 years) |
| Rising trucking insurance premiums inflate brokerage costs | -2.3% | National; high-risk lanes | Medium term (2-4 years) |
| Source: Mordor Intelligence | |||
Fragmented Carrier Base Slows API Onboarding
The United States hosts more than 80,000 trucking carriers, many of which lack modern IT stacks, complicating platform integrations. Digital forwarders spend disproportionate resources on hybrid manual-digital workflows, delaying network scale-up. Although simplified onboarding kits and low-code API bridges help, regional disparities persist, and onboarding timelines lengthen, reducing the attainable growth rate for the United States digital freight forwarding market.
Volatile Ocean Spot Rates Hamper Instant Quoting Accuracy
Global ocean pricing swung sharply in 2024-2025 as capacity imbalances and geopolitical tensions altered sailing schedules. Digital pricing engines struggle to keep quotes aligned with real-time market swings, risking margin erosion. Incumbent forwarders with long-term contracts can undercut tech-native spot quotes, dulling competitive positioning. AI-based predictive models improve accuracy but cannot fully neutralize volatility, imposing a drag on service perception.
*Our forecasts treat driver/restraint impacts as directional, not additive. The impact forecasts reflect baseline growth, mix effects, and variable interactions.
Segment Analysis
By Function: Transportation Management Extends Digital Lead
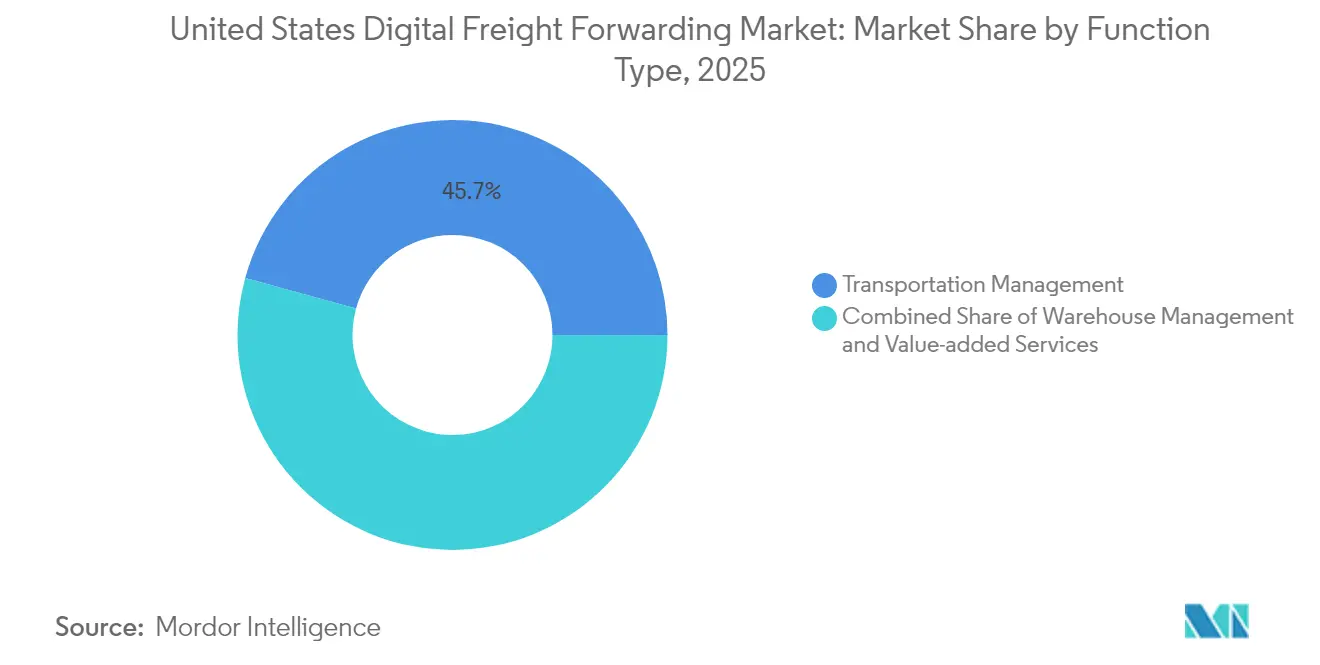
Transportation Management accounted for a 45.72% United States digital freight forwarding market share in 2025, underscoring shippers’ priority to optimize lane selection, carrier performance, and route planning. AI algorithms now balance freight mix across land, sea, and air to reduce empty miles and cut dwell time. Real-time APIs align drivers, warehouses, and customs brokers, enabling platforms to automate tendering across more than 400,000 U.S. truck drivers. This efficiency lets forwarders process high-velocity retail imports while sustaining service quality.
Value-added Services record the fastest 10.94% CAGR as shippers demand consolidated dashboards that blend customs brokerage, insurance, and trade-compliance analytics. Machine-learning models read commercial invoices, identify duty-savings opportunities, and suggest alternative Incoterms. The converging feature set encourages shippers to favor unified platforms, deepening revenue per account and amplifying scale within the United States digital freight forwarding market.


By End-users: Retail and E-commerce Remain Anchor Vertical
Retail & E-commerce captured 36.48% of the United States digital freight forwarding market size in 2025, fueled by 15.5% online retail penetration and the surge of low-value parcel imports. Omnichannel retailers integrate order-management systems with digital forwarder APIs to orchestrate store replenishment and consumer deliveries through a single interface. Reverse-logistics workflows also gain traction as return rates average 16% in apparel.
Healthcare & Pharma exhibit the highest 11.86% CAGR through 2031, reflecting strict temperature-control and traceability needs. FedEx’s sustainable aviation-fuel rollout and AI-enabled cold-chain insights illustrate demand for specialized lanes. Digital forwarders leverage sensor-laden packaging and regulatory-compliant data vaults to win contracts for time-sensitive biologics shipments.
By Deployment Mode: Cloud Platforms Drive Scalability
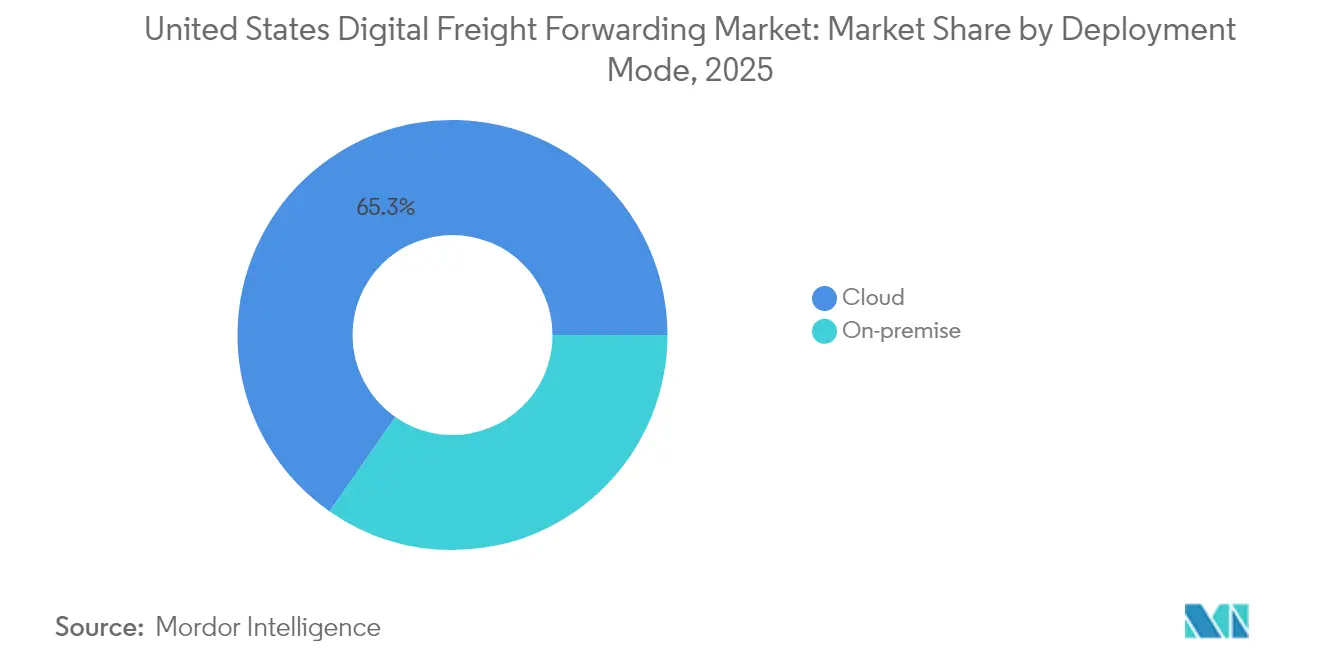
Cloud deployments claimed 65.32% share and continue to outpace on-premise systems at 9.98% CAGR DHL.COM. Multitenant architectures slash IT overhead and grant SMEs access to enterprise-grade modules through subscription models. Continuous integration pipelines ship new features weekly, such as AI fraud-detection and automated detention-fee tracking, bolstering stickiness.
On-premise remains a niche for heavily regulated shippers and government entities requiring air-gapped environments. Even here, hybrid solutions pipe sanitized data to the cloud for analytics while preserving local control, reinforcing the United States digital freight forwarding market’s migration toward flexible architectures.
By Firm Type: Large Enterprises Anchor Revenue, SMEs Accelerate Adoption
Large Enterprises provide 53.22% of platform revenue, leveraging complex global supply chains and higher freight spend that justify enterprise licenses. Their multi-modal tendering needs push vendors to integrate air, ocean, rail, and parcel modules into one pane of glass, while SOC-2 and ISO 27001 certifications remain non-negotiable.
SMEs grow at 9.05% CAGR as falling cyber-insurance premiums and low-code onboarding tools lower barriers. Vendors package best-practice workflows and embedded compliance checks to offset limited in-house expertise. These network effects attract more carriers, enriching rate options and fueling virtuous-cycle growth for the United States digital freight forwarding market.
Geography Analysis
The West accounts for 28.64% of the United States digital freight forwarding market, anchored by ports of Los Angeles and Long Beach, which move roughly 40% of U.S. container imports. Technology companies headquartered in California co-create APIs and beta-test machine-learning modules, accelerating commercial adoption. Persistent cybersecurity risks 40 million monthly attacks at the Port of Los Angeles make robust encryption and zero-trust frameworks table stakes for providers.
The South records the fastest 15.21% CAGR as Mexico became America’s top trading partner, driving 20,900 monthly truck crossings through Texas alone. Near-shored automotive and electronics plants rely on Carta Porte-compliant document flows and multi-modal coordination. Florida’s emergence as a hub for Latin American trade further widens regional demand for bilingual brokerage services and tariff-classification engines.
Northeast and Midwest corridors maintain steady growth. The Northeast benefits from pharmaceutical imports through Port NY/NJ and heightened e-commerce activity, while the Midwest’s automotive belt digitizes logistics to support EV battery supply chains. Investments such as Norfolk Southern’s USD 1 billion systemwide upgrades including five digital train-inspection portals enhance rail-based freight visibility. Together, these advances reinforce nationwide momentum in the United States digital freight forwarding market.
Regulatory Landscape
United States digital freight forwarding platforms operate across overlapping regimes for ocean, highway, and customs data. In ocean freight, intermediaries must comply with Federal Maritime Commission (FMC) ocean transportation intermediary requirements (licensing/registration and financial responsibility under 46 CFR Part 515). For highway brokerage and freight forwarding, the Federal Motor Carrier Safety Administration (FMCSA) financial responsibility framework remains a core compliance anchor, with a USD 75,000 minimum security requirement referenced for enforcement from January 16, 2026. This is pushing platforms to maintain verifiable bonding and tighten back-office controls.
Customs digitization is also shaping product design and integration priorities. In February 2026, U.S. Customs and Border Protection (CBP) advanced rulemaking to mandate electronic export manifest (EEM) submissions for vessel cargo via the Automated Commercial Environment (ACE), reinforcing API connectivity and structured data capture. In June 2026, CBP announced an indefinite suspension of the de minimis administrative exemption for non-postal modes for imports valued at USD 800 or less, which increases the share of shipments that must move through formal or informal entry procedures. That change adds compliance workload for high-velocity e-commerce and cross-border parcel flows that previously used streamlined processes. Separately, broker transparency proposals that require electronic provision of transaction records within 48 hours raise auditability and data-retention expectations across digital brokerage workflows.
Value Chain Analysis
The digital freight forwarding value chain in the United States runs from shipper procurement and order systems through a digital forwarder or broker platform layer (rate management, booking, documentation, and exception management). Carrier capacity providers supply truckload/LTL and ocean and air linehaul, while downstream nodes include ports, terminals, warehouses, and last-mile networks. Data infrastructure is now a first-order input: platforms integrate with ACE for customs workflows, embed compliance logic into booking and documentation, and use visibility and telemetry plus pricing engines to manage volatility across modes. Infrastructure and middleware providers support this chain by offering API-first connectivity and automation that forwarders embed into their own operating models, rather than relying only on stand-alone portals.
Two 2026 shifts add friction and new requirements at key handoff points. The U.S. Supreme Court decision in May 2026 (Montgomery v. Caribe Transport II) affirmed that FAAAA preemption does not bar state-law negligent selection claims against freight brokers, increasing the operational importance of defensible carrier onboarding, safety data capture, and documented tender decisions across digital platforms. On the execution side, platform-to-fulfillment integration has continued to deepen. Flexport expanded its Regional Fulfillment Network with a new node in Columbus, Ohio, and secured Shopify integration certification for its fulfillment network, tightening the linkage between inventory placement, freight movement, and customer delivery outcomes. In parallel, project44 reorganized in July 2026 by creating a dedicated AI-native infrastructure unit (LSP44) alongside its shipper-facing decision platform, reflecting further specialization of the software layer that connects shippers, forwarders, and carriers.
Competitive Landscape
The competitive field remains moderately fragmented even as consolidation accelerates. DSV’s EUR 14.3 billion (USD 15.78 billion) acquisition of Schenker closed in April 2025, birthing a 160,000-employee powerhouse forecasting DKK 9.0 billion (USD 1.33 billion) in annual synergies by 2028 DSV.COM. Traditional incumbents simultaneously revamp internal tech stacks; C.H. Robinson’s ACE-integrated platform now pushes real-time compliance alerts. Pure-play digital entrants such as Flexport deploy micro-services to interface seamlessly with shipper ERPs, while Uber Freight’s generative-AI tools automate tendering and lane forecasting across USD 20 billion in managed freight.
Strategic playbooks cluster into three groups. Legacy giants acquire assets to achieve end-to-end digital depth; tech-natives double-down on vertical specializations like cold chain; and orchestrator platforms aggregate niche providers via open APIs, offering modular value. White-space persists in healthcare logistics, where FDA compliance deters smaller entrants, and in cross-border e-commerce, where customs variability rewards algorithmic classification engines. As AI-driven pricing matures and cyber resilience becomes table stakes, competitive advantage hinges on data science talent, carrier network density, and the breadth of embedded value-added modules in the United States digital freight forwarding market.
United States Digital Freight Forwarding Industry Leaders
Flexport
Uber Freight
Convoy
C.H. Robinson (Navisphere)
Loadsmart
- *Disclaimer: Major Players sorted in no particular order


Market Opportunities and Future Outlook
Compliance-driven digitization and entry-procedure changes create immediate whitespace for platforms that automate customs and brokerage workflows at scale. CBP actions in 2026, including the move toward mandatory electronic export manifest submission via ACE and the suspension of the non-postal de minimis administrative exemption for USD 800-and-under imports, increase data, classification, and documentation needs for high-volume e-commerce and cross-border flows. Providers that package ACE-connected filing, automated record retrieval for broker transparency requests, and audit-ready transaction trails can shorten cycle times for shippers and reduce manual brokerage burden, particularly where shipment counts are high and values are low.
Infrastructure expansion and federal freight-data initiatives also reinforce demand for interoperable, multimodal orchestration that digital forwarders can monetize through transportation management and value-added modules. In 2026, several projects increased the addressable footprint for rail-connected and port-linked freight flows, including CSX opening a USD 495 million Baltimore rail tunnel project to enable double-stack moves along the I-95 corridor, the Port of Brownsville completing the Brazos Island Harbor Channel Improvement Project (52-foot channel depth), and city approval for BNSF Railway's USD 4 billion Barstow International Gateway in California. Alongside these physical nodes, the 2026 National Freight Strategic Plan and the U.S. Department of Transportation's March 2026 Request for Information on a National Strategy for Transportation Digital Infrastructure highlight national freight data schemas and advanced freight technology adoption. This creates a near-term opportunity for digital forwarders to align APIs, visibility data models, and security controls with emerging interoperability expectations while also supporting new inland-port and rail relay points.
Recent Industry Developments
- February 2026: Flexport published its Winter 2026 Technology Release, adding AI agents focused on customs, compliance, and cost optimization along with the Flexport Atlas supply chain modeling capability. The release reinforces the shift from digital booking portals toward embedded execution and decision automation for freight forwarding workflows.
- November 2025: Uber Freight announced a strategic investment in Better Trucks and expanded its commercial partnership to strengthen last-mile delivery coverage. The move extends Uber Freight’s end-to-end logistics positioning by linking linehaul planning with final-mile capacity and service levels for e-commerce shippers.
- September 2024: Uber Freight announced general access to Uber Freight Exchange: Contract, a digital procurement capability for contract freight. This broadens shipper adoption of structured, data-backed sourcing and supports tighter integration between procurement events and ongoing transportation execution.


Research Methodology Framework and Report Scope
Market Definition and Coverage
For this study, the market covers revenue earned in the United States from digital freight forwarding services where freight is quoted, booked, and managed through software-led workflows, including documentation and in-transit visibility tied to an actual forwarding transaction.
Scope exclusions: We exclude pure freight rate benchmarking tools, stand-alone shipment tracking software, and non-forwarding managed transportation services when there is no forwarding execution or liability in the service.
Segmentation Overview
- By Function
- Transportation Management
- Land
- Sea
- Air
- Warehouse Management
- Value-added Services
- Transportation Management
- By End-users
- Retail and E-commerce
- Manufacturing
- Healthcare and Pharma
- Automotive
- Others
- By Deployment Mode
- Cloud
- On-premise
- By Firm Type
- SMEs
- Large Enterprises and Government Entities
- By US Region
- Northeast
- Midwest
- South
- West
Data Sources, Market Sizing, and Validation
Desk Research
Desk research was used to frame the demand pool, define what "digital" means in day-to-day forwarding work, and collect reference indicators that can be checked against the model. We relied on public logistics and trade signals such as US Census Bureau trade statistics, Bureau of Transportation Statistics freight series, Federal Highway Administration freight indicators, and US Customs and Border Protection guidance on entry and documentation. We also reviewed Federal Maritime Commission materials and port or airport authority throughput releases where they help interpret mode shifts and gateway patterns.
To round out the picture, we reviewed SEC filings and investor presentations from relevant logistics firms, trade association publications such as IATA and AAPA, and reputable transportation press coverage to understand product positioning and rate behavior. In parallel, we used paid databases for company financials and news intelligence, and an import-export shipment-level database to sanity check lane intensity and shipment characteristics at a high level. The desk sources listed above are illustrative, not exhaustive, and many other public references were also used for data collection, validation, and research clarification during the work.
Primary Interviews and Surveys
Primary work focused on confirming how revenues are booked in digital forwarding programs, which services are commonly bundled, and how pricing shifts with capacity cycles. We spoke with a mix of forwarders, digital platform operators, shippers, and carrier-side contacts across major US gateways, so assumptions from desk research could be corrected and then applied consistently through the model.
Distribution of primary research fieldwork respondents
| Company type | Respondent position |
|---|---|
| Top tier: 33% | CXOs: 18% |
| Mid tier: 49% | Functional/Unit leaders: 32% |
| Smaller Players: 18% | Managers: 50% |
Market-Sizing & Forecasting
Sizing was built using a mix of top-down and bottom-up checks. We started with a demand-pool reconstruction that ties US freight activity to the share of moves that are arranged through forwarders and then executed via digital quoting, booking, and workflow steps. That top-down pathway was pressure-tested with selective bottom-up approximations, such as sampled digital-forwarding shipment volumes by mode multiplied by typical take rates, plus cross-checks using publicly visible revenue disclosures where available.
Key inputs used in the model included US import and export momentum by value, containerized and air cargo throughput trends at major gateways, the mix shift by mode (ocean, air, and land), adoption of online quoting and booking for forwarding transactions, and observable changes in take rates during tight and loose capacity periods. Where a bottom-up check had gaps (for example, limited disclosure for privately held operators), we filled them using conservative peer ranges validated in interviews, and we only scaled after the totals stayed consistent with trade and throughput indicators.
For forecasting, scenario analysis was used to reflect different capacity and pricing cycles, followed by an exponential smoothing step so the line does not overreact to short-term spikes in spot conditions. Assumptions on adoption and pricing were adjusted using consensus views from primary respondents, and then applied consistently across the forecast years so the trend remains explainable and repeatable.
Data Validation & Update Cycle
Outputs were validated through triangulation across three layers: desk indicators (trade and throughput series), the modeled demand and pricing drivers, and interview feedback on what changed in real operations. If a mode-level result moved too far away from independent signals, the underlying adoption, take rate, or mix assumptions were reopened and checked again before sign-off.
A second analyst review is completed to confirm the math, the logic behind each driver, and the alignment between narrative findings and the numbers. Reports are refreshed annually, and interim updates are made when material events occur, such as major regulatory changes, step-shifts in capacity, or sudden pricing shocks. Right before delivery, a final pass is done so clients receive the latest view that matches the most recent public data and market conversations.
Mordor Intelligence's United States Digital Freight Forwarding Market Size Versus Other Published Estimates
Published market numbers for US digital freight forwarding can vary because authors do not always count the same revenue streams, and the same year can be reported as either a calendar year, a rolling year, or a forward-looking current year. Differences also come from how pricing is handled during volatile freight cycles and from how quickly assumptions get refreshed after capacity conditions change.
Some external estimates appear to include broader digital freight management revenue that mixes forwarding with adjacent software-led services like stand-alone visibility or rate tools. For Mordor Intelligence, the market total counts only digital workflows tied to freight forwarding transactions in the United States, and it excludes stand-alone tracking, pure rate benchmarking tools, and non-forwarding managed transportation fees so the sizing stays linked to forwarding revenue.
Benchmark comparison
| Source | Market Size | Gaps in Research Methodology |
|---|---|---|
| Mordor Intelligence | USD 9.83 B (2026) | |
| Industry Marketplace A | USD 6.89 B (2024) | Uses an earlier base year and can reflect a different freight cycle point for rates and volumes, which can depress the run-rate if later recovery and adoption gains are not carried through. |
| Strategy Publisher B | USD 8.50 B (2025) | May blend forwarding execution with broader digital freight management features, and can apply a flatter take-rate progression by mode, which shifts totals versus a transaction-revenue view. |
Overall, the spread in the table is mainly explained by year selection and by what is treated as in-scope revenue versus adjacent software or management fees. By keeping inputs tied to US freight activity, mode mix, and adoption of digital booking in forwarding workflows, our estimate stays traceable to practical variables that can be rechecked as the market evolves.


Key Questions Answered in the Report
How large is the United States digital freight forwarding market in 2026?
The United States digital freight forwarding market size stands at USD 9.83 billion in 2026 and is set to grow rapidly at a 19.12% CAGR to 2031.
Which segment holds the largest market share by function?
Transportation Management leads with a 45.72% share, reflecting shipper focus on optimized routing and carrier coordination.
Why is the South region growing faster than other U.S. regions?
Near-shoring to Mexico and increased cross-border trade are propelling the South to a 15.21% CAGR through 2031.
What role does cloud deployment play in digital freight forwarding?
Cloud solutions account for 65.32% of deployments, offering scalable, subscription-based access to advanced analytics and real-time visibility.
How are AI tools reshaping freight forwarding operations?
AI supports predictive pricing, real-time ETA forecasting, and automated exception handling, enabling platforms such as Uber Freight to process 24 million loads annually.
Which end-user vertical is expanding fastest?
Healthcare & Pharma is the fastest‐growing end-user segment with a 11.86% CAGR, driven by stringent compliance and cold-chain needs.
Page last updated on:


 Your data is secure and never sold or shared.


