
Market Overview
| Study Period | 2020 - 2031 |
|---|---|
| Forecast Data Period | 2026 - 2031 |
| Base Year Market Size (2025) | USD 14.35 Billion |
| Market Size (2026) | USD 15.51 Billion |
| Market Size (2031) | USD 23.74 Billion |
| Growth Rate (2026 - 2031) | 8.89% CAGR |
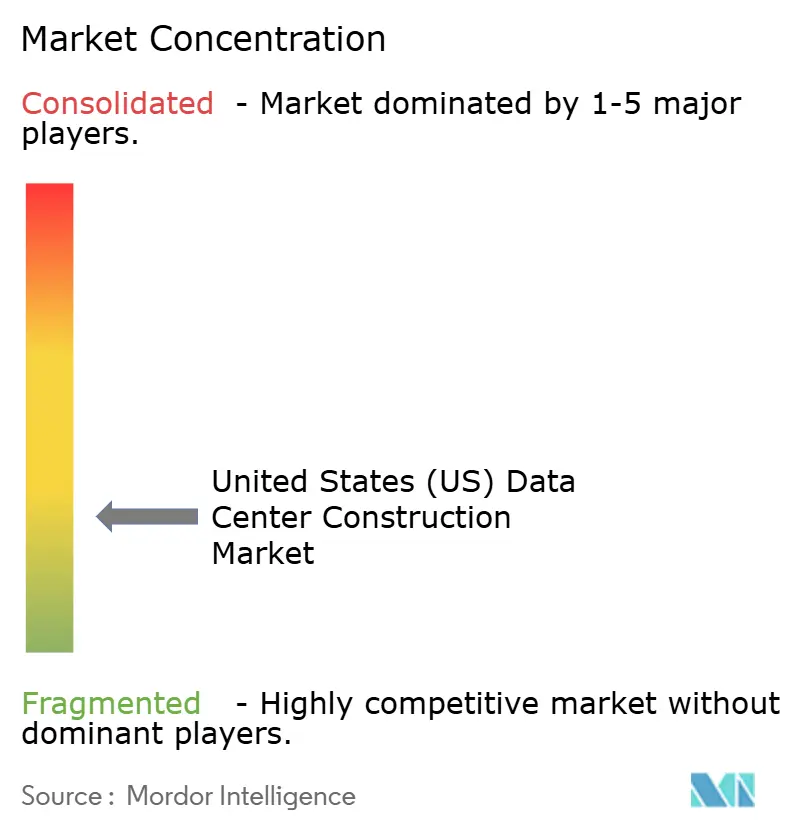
| Market Concentration | Low |
Major Players *Disclaimer: Major Players sorted in no particular order Image © Mordor Intelligence. Reuse requires attribution under CC BY 4.0. | |
United States Data Center Construction Market Analysis by Mordor Intelligence
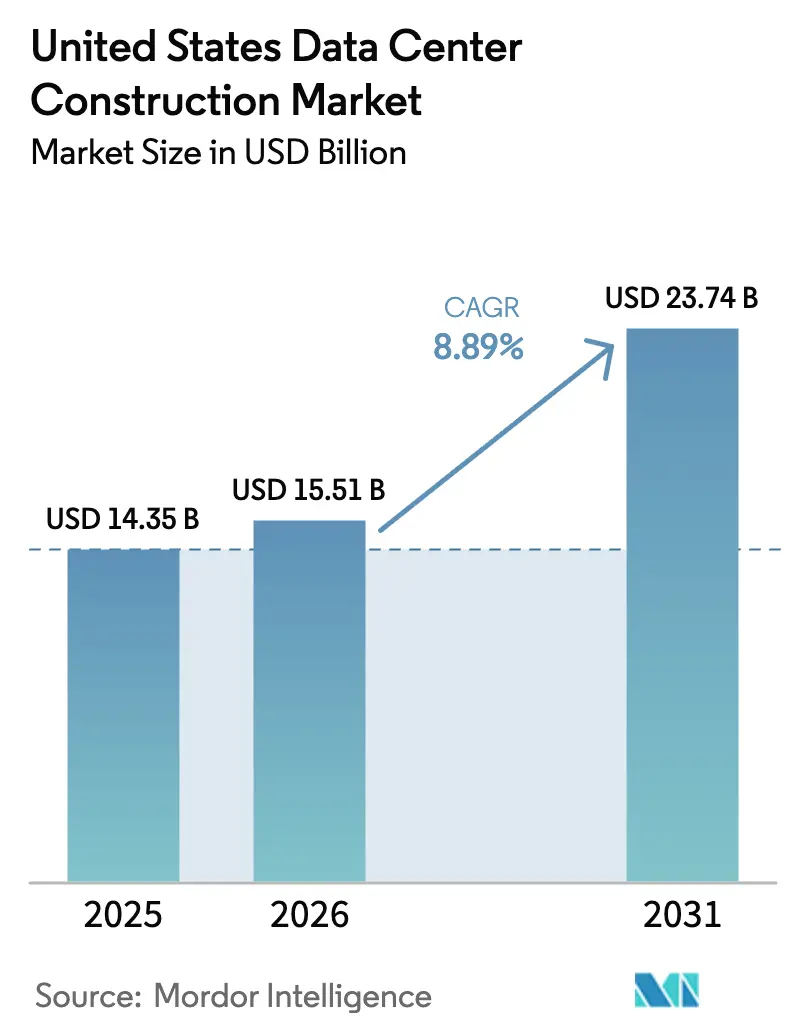
The United States (US) data center construction market size was valued at USD 14.35 billion in 2025 and is estimated to grow from USD 15.51 billion in 2026 to reach USD 23.74 billion by 2031, at a CAGR of 8.89% during the forecast period (2026-2031). Hyperscaler self-build pipelines now exceed 10 gigawatts, steering capital toward higher-density campuses that require liquid-cooling retrofits and on-site power generation. Electrical infrastructure captured 40.17% of 2025 spending, yet mechanical infrastructure is growing fastest at 9.87% as average rack power climbs from 8 kilowatts in 2024 to 15 kilowatts in 2026. Power-grid interconnection delays, multi-year transformer lead times, and land prices topping USD 1 million per acre in tier-1 hubs are redirecting projects to secondary metros that offer shorter utility queues and richer incentives. Environmental, social, and governance rules are pushing operators toward closed-loop liquid cooling and small modular reactors that decouple load growth from strained grids.
Key Report Takeaways
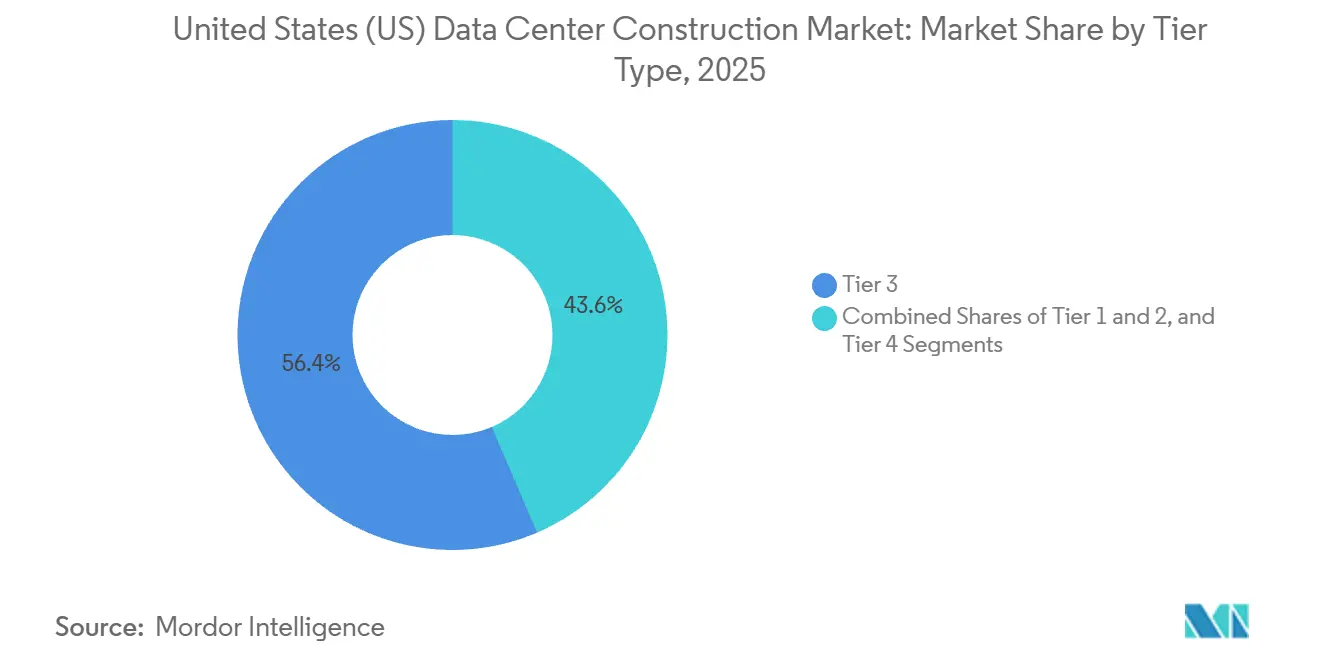
- By tier type, Tier 3 facilities led with 56.43% of the United States data center construction market share in 2025, while Tier 4 builds are positioned for a 9.12% CAGR through 2031.
- By data center size, hyperscale installations accounted for 64.31% of the United States data center construction market share in 2025 and are projected to advance at a 9.45% pace through 2031.
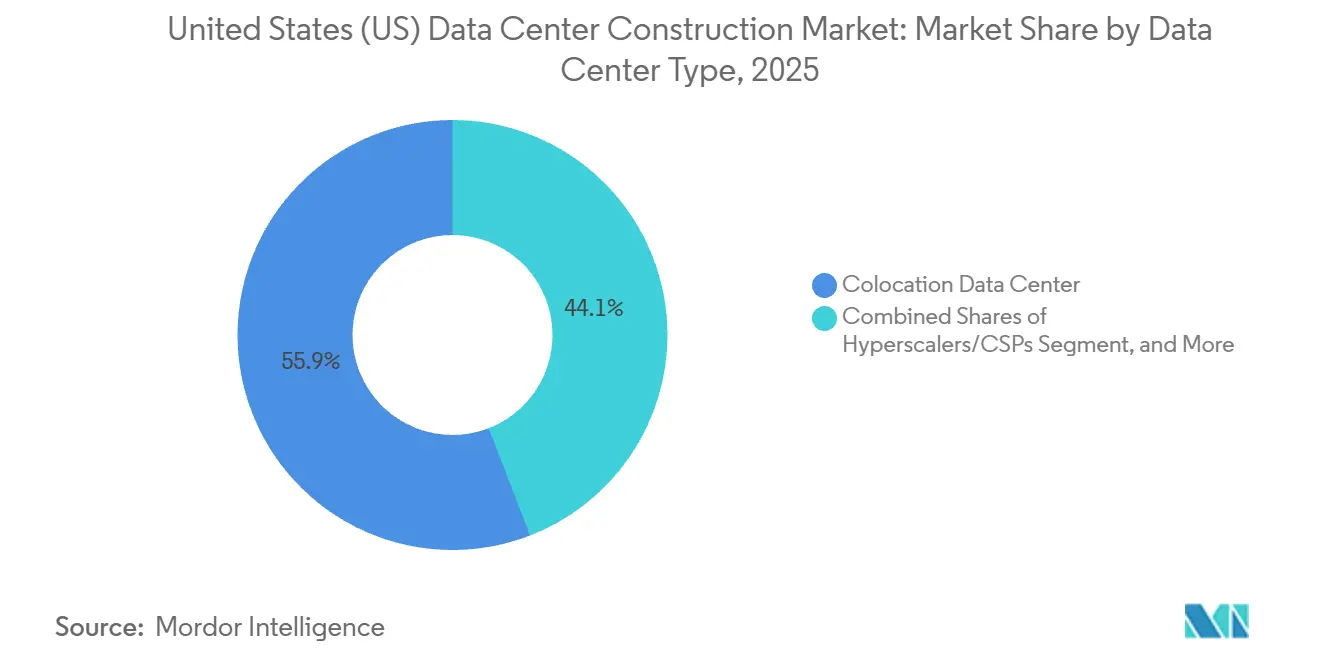
- By data center type, colocation providers accounted for 55.88% of 2025 spending, while hyperscalers were the fastest-growing segment at 9.75% as they internalize capacity.
- By infrastructure, electrical infrastructure accounted for 40.17% of 2025 outlays, whereas mechanical infrastructure is projected to post the strongest 9.87% CAGR to 2031.
Note: Market size and forecast figures in this report are generated using Mordor Intelligence’s proprietary estimation framework, updated with the latest available data and insights as of January 2026.
United States Data Center Construction Market Trends and Insights
Drivers Impact Analysis*
| Driver | (~) % Impact on CAGR Forecast | Geographic Relevance | Impact Timeline |
|---|---|---|---|
| Cloud, AI and Big-Data Workload Boom | +2.4% | Nationwide, focus on Northern Virginia, Silicon Valley, Phoenix, Dallas-Fort Worth | Medium term (2-4 years) |
| Hyperscale Self-Build Pipelines Above 10 GW | +2.1% | Nationwide, led by Virginia, Texas, Mississippi, Louisiana | Long term (≥ 4 years) |
| AI-Optimized Liquid-Cooling Retrofits Drive Rebuild Spend | +1.6% | Nationwide, early adoption in Northern Virginia, Silicon Valley, Chicago | Short term (≤ 2 years) |
| Edge and 5G Densification of Metro Clusters | +1.3% | Nationwide, early gains in New York, Los Angeles, Miami, Seattle | Medium term (2-4 years) |
| Federal and State Tax-Incentive Packages | +0.9% | Virginia, Texas, Ohio, Georgia, North Carolina | Short term (≤ 2 years) |
| On-Site Micro-Nuclear SMR Approvals Accelerate Greenfield Sites | +0.6% | Pennsylvania, Ohio, Virginia, emerging in Texas | Long term (≥ 4 years) |
| Source: Mordor Intelligence | |||
Cloud, AI and Big-Data Workload Boom
Generative AI inference clusters have doubled average rack loads, pushing design densities to 15 kilowatts in 2026 and an expected 25 kilowatts by 2028. Operators are retrofitting rear-door heat exchangers and direct-to-chip loops, which add USD 1.5 million to USD 2 million per megawatt to budgets. Amazon Web Services committed USD 11 billion to Pennsylvania sites, and Microsoft reserved USD 80 billion globally for AI-optimized campuses, illustrating hyperscaler capital redeployment.[1]Editorial Board, “Thermal Guidelines for Data Processing,” ASHRAE, ashrae.org With the United States hosting more than half of the world’s hyperscale inventory, demand is bifurcating between 100-megawatt campuses for training and sub-1-megawatt edge nodes for low-latency inference.
Hyperscale Self-Build Pipelines Above 10 GW
Amazon Web Services, Microsoft Azure, Google Cloud, and Meta together hold over 10 gigawatts of active projects. Meta confirmed a USD 10 billion Louisiana campus, and Google added USD 1 billion in Texas expansion, signaling migration to secondary markets where land and utility interconnection costs are up to 60% lower than tier-1 hubs. Hyperscalers now self-perform civil work, hire specialists for mechanical and electrical scopes, and compress schedules from 24 months to 18 months, reducing general-contractor addressable value by roughly 25%.
AI-Optimized Liquid-Cooling Retrofits Drive Rebuild Spend
Rack densities above 20 kilowatts make raised-floor air cooling thermodynamically inefficient. Direct-to-chip manifolds and rear-door heat exchangers are standard in new builds, and the legacy air-cooled base represents a USD 4-6 billion retrofit opportunity through 2031. Vertiv and Schneider Electric offer skid-mounted liquid-cooling units that cut downtime in half, while Microsoft and Meta piloted immersion-cooled racks in Arizona and Oregon. ASHRAE raised allowable inlet temperatures to 27 °C for liquid systems, reducing chiller capacity requirements by up to 20%.[2]Federal Energy Regulatory Commission, “Interconnection Reform Notice,” ferc.gov
Edge and 5G Densification of Metro Clusters
Latency-sensitive services require compute within 10 milliseconds of users, driving demand for 100-kilowatt to 2-megawatt edge nodes colocated with 5G hubs and retail points of presence. The Infrastructure Investment and Jobs Act allocates USD 65 billion to broadband backhaul that enables edge economics in rural markets. Verizon targets 100 edge locations by 2027, and AT&T plans 75 by 2026, each using prefabricated containers that install in six weeks, versus the 18-month timeline of conventional halls.
Restraints Impact Analysis*
| Restraint | (~) % Impact on CAGR Forecast | Geographic Relevance | Impact Timeline |
|---|---|---|---|
| Power-Grid Interconnection Delays (3-6 Years) | -1.8% | Nationwide, acute in Northern Virginia, Phoenix, Silicon Valley, Atlanta | Long term (≥ 4 years) |
| Transformer and Switch-Gear Supply-Chain Choke Points | -1.2% | Nationwide | Medium term (2-4 years) |
| Soaring Land Prices Around Tier-1 Metros | -0.7% | Northern Virginia, Silicon Valley, Phoenix, Dallas-Fort Worth | Short term (≤ 2 years) |
| ESG-Driven Municipal Moratoria on Water-Intensive Cooling | -0.5% | Mesa, Arizona; Prince William County, Virginia; emerging in California | Medium term (2-4 years) |
| Source: Mordor Intelligence | |||
Power-Grid Interconnection Delays (3-6 Years)
National queues exceed 2,600 gigawatts, stretching median approvals to five years. Dominion Energy alone lists 47 gigawatts of pending data-center load in Northern Virginia. Arizona Public Service froze new data-center hookups in late 2024, redirecting projects to Texas and Ohio. Developers are funding on-site peaker plants and small modular reactors that add USD 3 million to USD 5 million per megawatt but avoid queue risk, while Federal Energy Regulatory Commission reforms, slated for 2027, aim to streamline approvals.[3]Staff Author, “Microsoft Announces USD 80 Billion AI Data Center Plan,” microsoft.com
Transformer and Switch-Gear Supply-Chain Choke Points
Lead times for >100 megavolt-ampere transformers range from 24 to 30 months as electric-vehicle and renewable-energy projects compete with data-center demand. ABB and Siemens backlogs push delivery into 2027, forcing developers to pre-order 18 months ahead of groundbreaking. Some operators deploy multiple smaller transformers in parallel to reduce wait times, but this approach increases footprint and maintenance.
*Our forecasts treat driver/restraint impacts as directional, not additive. The impact forecasts reflect baseline growth, mix effects, and variable interactions.
Segment Analysis
By Tier Type: Fault Tolerance Fuels Tier 4 Momentum
Tier 3 sites held 56.43% share in 2025, favored for concurrent maintainability at a 20%-30% cost discount versus Tier 4 designs. However, fault-tolerant Tier 4 builds are on track for a 9.12% CAGR, the fastest within the United States data center construction market size. Banking, healthcare, and government tenants demand 99.995% uptime, prompting colocation operators to retrofit Tier 3 halls with dual utility feeds and 2N uninterruptible power supply racks. Uptime Institute’s 2024 survey showed 38% of U.S. builds sought Tier 4 certification, up from 29% in 2022, a jump driven partly by cyber-insurance underwriters.
Colocation leaders Equinix and Digital Realty are layering Tier 4 features onto existing campuses to secure premium workloads, while Amazon Web Services included multiple Tier 4 campuses in its USD 11 billion Pennsylvania program to support GovCloud clients. As more enterprises require fault-tolerant hosting, contractors focused on redundant electrical paths and liquid-cooled backup modules stand to gain the largest share of Tier 4 spending.


By Data Center Size: Hyperscale Dominance Redefines Economics
Hyperscale campuses above 10 megawatts controlled 64.31% of 2025 build volume and are projected to grow at 9.45% annually, underscoring their weight in the United States data center construction market. Economies of scale in power procurement, modular cooling, and labor reduce per-megawatt costs by as much as 40% against medium-sized halls, prompting cloud providers to favor 100-200 megawatt master-planned sites.
Medium facilities between 1 megawatt and 10 megawatts still serve hybrid colocation tenants but face slower growth as workloads shift to cloud. Small sub-1 megawatt facilities bifurcate into decommissioned enterprise rooms and rising edge nodes. Broadband subsidies and 5G densification make edge builds financially viable in tier-2 and rural metros, a niche where modular specialists like Mortenson and Balfour Beatty deliver turnkey enclosures in under 45 days.
By Data Center Type: Vertical Integration Compresses Colocation Margins
Colocation operators retained 55.88% share in 2025, yet hyperscalers are pacing the fastest 9.75% growth as they bring capacity in-house to manage latency, security, and cost. Amazon Web Services, Microsoft Azure, Google Cloud, and Oracle Cloud collectively added more than 3 gigawatts of owned footprint during 2024-2025, outstripping the expansion rate of the top five colocation firms.
Consolidation is underway: Digital Realty acquired Teraco and Equinix purchased MainOne in 2024 to bolster interconnection density and regional reach. Colocation players are differentiating through edge nodes, renewable-linked campuses, and hybrid-cloud on-ramps. Enterprise data centers continue to retire, yet compliance and latency needs keep retrofit budgets intact. Edge builds capture telecom interest as Verizon and AT&T deploy containerized compute near 5G radios.
By Infrastructure: Mechanical Spend Surges on Liquid Cooling
Electrical systems absorbed 40.17% of 2025 construction outlays, but mechanical systems are slated for the highest 9.87% CAGR through 2031 as liquid-cooling uptake accelerates. Tier 3 and Tier 4 designs demand redundant switchgear and dual utility feeds, keeping power distribution the largest electrical sub-segment. Battery energy storage modules are incrementally replacing diesel-only ride-through, while hydrogen fuel-cell pilots surface in select campuses.
Cooling leads mechanical growth. Vertiv’s 2024 results showed liquid-cooling revenue up 65% year-over-year, and Schneider Electric launched 42U racks rated at 50 kilowatts. Servers, racks, and storage increasingly ship in prefabricated data-hall modules that compress site labor by up to 30%, though this shift narrows general-contractor margins. Design-build firms that master prefabrication workflows and liquid-cooling integration capture outsized value.
Geography Analysis
Northern Virginia maintained roughly 25%-30% of 2025 national builds, yet five-year queue delays and USD 1 million-per-acre land costs are steering projects to states such as Pennsylvania, Mississippi, and Ohio. Amazon Web Services’ USD 11 billion Pennsylvania and USD 10 billion Mississippi commitments exemplify this diversification. Phoenix ranked second in 2025, but an Arizona Public Service moratorium and Mesa’s ban on water-cooled permits threaten future growth.
Silicon Valley expansion is cooling as land scarcity and environmental regulations are driving build costs to USD 15 million per megawatt, a 40% premium over the United States data center construction market average. Dallas-Fort Worth and Atlanta absorb displaced demand with competitive power rates, fiber density, and state tax exemptions. Google’s USD 1 billion Texas addition and Meta’s USD 10 billion Louisiana build highlight Gulf Coast momentum.
The Pacific Northwest leverages hydroelectric rates below USD 0.025 kWh, yet wildfire and transmission constraints cap growth. Emerging markets such as Indiana, North Carolina, and Ohio attract hyperscalers through proactive utility planning and decade-long sales-tax holidays on equipment. Edge densification clusters in New York, Los Angeles, Chicago, and Miami, where Verizon and AT&T deploy containerized compute within 10 milliseconds of end users.
Regulatory Landscape
US data center construction is shaped by federal trade, energy reliability, and environmental compliance regimes, with day-to-day permitting concentrated at the state and local levels. In January 2026, a Section 232 proclamation imposed 25% duties on certain imported semiconductors and derivative products, but it explicitly exempted products used in US data centers, limiting near-term capex exposure while keeping sourcing diligence relevant for long-lead electrical and IT-related components.
Grid integration oversight is tightening as large loads multiply. In April 2026, the Federal Energy Regulatory Commission (FERC) moved in Docket RM26-4-000 toward developing more uniform rules for large electrical loads of 20 MW or greater, a category that captures hyperscale campuses and large colocation expansions. On environmental oversight, the US Environmental Protection Agency (EPA) continues to anchor air permitting and emissions guidance under Clean Air Act frameworks. In June 2026, EPA Administrator Lee Zeldin stated the agency would not set nationwide environmental standards specific to the data center industry, so primary approval pathways remain centered on state and local permitting, water-use constraints, and community-led zoning processes.
Competitive Landscape
Market fragmentation persists despite billion-dollar project sizes. Turner Construction, DPR Construction, and AECOM hold the inside track on hyperscale awards thanks to mission-critical credentials and deep benches of specialized subcontractors. Hyperscalers self-perform civil work, outsource mechanical and electrical scopes, and favor prefabricated modules that cut onsite labor by 30% and shrink commissioning from 18 months to 12 months. Digital Realty’s modular data-hall template and QTS Realty Trust’s power-skid strategy illustrate this shift.
Mechanical-electrical specialists such as Jacobs Solutions and Black & Veatch earn higher margins on liquid-cooling retrofits and power upgrades that demand deep domain knowledge. Small modular reactor integration opens white space for contractors with nuclear licensing expertise, as shown by Amazon Web Services’ 5-gigawatt partnership with X-energy and Talen Energy’s 960-megawatt nuclear campus.
Edge projects favor regional firms able to deliver containerized halls in under six weeks, a niche filled by Balfour Beatty US and Mortenson Construction. Contractors investing in building information modeling, digital twins, and off-site fabrication secure 15%-20% cost advantages, winning repeat hyperscaler contracts and expanding market share.
United States Data Center Construction Industry Leaders
AECOM
Turner Construction
DPR Construction
Holder Construction
Skanska USA
- *Disclaimer: Major Players sorted in no particular order

Market Opportunities and Future Outlook
Power-secured site development has become a key route for new construction value as interconnection timelines extend and utilities scrutinize very large loads. In March 2026, the Department of Energy announced a public-private partnership to develop the PORTS Technology Campus in Pike County, Ohio, targeting a planned 10 GW data center and 10 GW of on-site power generation on a repurposed federal-industrial site. This project illustrates a campus-scale path that combines land, energy infrastructure, and permitting strategy, expanding construction scope beyond traditional shells and fit-outs to include substations, generation tie-ins, and integrated mechanical-electrical packages designed for higher rack densities.
Mechanical and retrofit-intensive build scopes also represent a clear whitespace area as rack power rises (15 kW average in 2026 in this report context). Operators are leaning into direct-to-chip and rear-door heat exchanger deployments rather than legacy air-only designs. Hyperscaler commitments are also pushing additional capacity into secondary, power-advantaged geographies: Meta expanded its Richland Parish, Louisiana, Hyperion campus to a stated 5 GW capacity, with a reported investment commitment reaching USD 50 billion by July 2026. Meanwhile, permitting risk has become more visible in some states, with New York enacting a one-year moratorium on new hyperscale data center environmental permits in July 2026 as it develops a sector GEIS. That shift increases the value of early-stage environmental, community engagement, and entitlement planning.
Recent Industry Developments
- July 2026: Turner Construction highlighted progress on the expansion of Meta's Richland Parish, Louisiana, data center project, which the owner has scaled to target 5 GW of IT capacity. The update underscores the market shift toward gigawatt-class campuses in secondary power-advantaged regions, raising demand for high-throughput delivery methods and repeatable electrical and mechanical packages.
- February 2026: Turner Construction announced it was selected as one of the contractors for Meta's reported USD 10 billion data center campus in Lebanon, Indiana, described as a 4 million square foot project designed for up to 1 GW of capacity. The selection signals contractors are being pulled earlier into mega-campus programs, where power, long-lead equipment, and prefabrication strategy shape schedule performance.
- October 2024: Google announced a USD 1 billion campus expansion in Texas, adding 300 MW of capacity and pairing on-site solar plus battery storage as part of its energy strategy. The project reinforced Texas as a major destination for large builds and increased the importance of integrating energy infrastructure and commissioning requirements into the construction scope.


Research Methodology Framework and Report Scope
Market Definition and Coverage
This market covers the value of services and materials used to plan, design, and build data center facilities in the United States, including core and shell work and the key electrical and mechanical fit-out needed to make the site operational.
Scope exclusions: We exclude server and IT hardware purchases, routine facility maintenance, modular container rentals, and colocation lease or service revenues.
Segmentation Overview
- By Tier Type
- Tier 1 and 2
- Tier 3
- Tier 4
- By Data Center Size
- Small
- Medium
- Large
- Hyperscale
- By Data Center Type
- Colocation Data Center
- Hyperscalers/Cloud Service Provider (CSPs)
- Enterprise and Edge Data Center
- By Infrastructure
- Electrical Infrastructure
- Power Distribution Solution
- Power Backup Solutions
- Mechanical Infrastructure
- Cooling Systems
- Racks and Cabinets
- Servers and Storage
- Other Mechanical Infrastructure
- General Construction
- Services - Design and Consulting, Integration, Support and Maintenance
- Electrical Infrastructure
Data Sources, Market Sizing, and Validation
Desk Research
Desk research was used to map the U.S. construction demand pool and the cost drivers that shift spending year to year. We mainly pulled public signals such as the U.S. Census construction spending series, U.S. Bureau of Labor Statistics producer price and labor cost indices, and U.S. Energy Information Administration power demand context, and then matched those with planning and permitting context from sources such as state and local economic development agencies.
To keep inputs grounded, we also reviewed engineering and safety references and adoption signals from sources such as ASHRAE publications, NFPA guidance, and IEEE materials where relevant to electrical and cooling systems used in modern facilities. Company filings, investor presentations, and reputable business press were then used to validate project pipelines and typical contracting patterns. We also used a paid subscription focused on company financials and project intelligence to cross-check the revenue mix for construction-led activities. This list is not exhaustive, and we relied on additional public sources during data collection, validation, and clarifications throughout the research process.
Primary Interviews and Surveys
Primary work was used to pressure-test the spend model using real project behavior, especially around what gets counted as construction versus adjacent spending. We spoke with a mix of general contractors, specialty electrical and mechanical contractors, engineering and design teams, and owner-side project managers, and the discussions covered major U.S. build clusters as well as secondary markets where new power capacity is being unlocked.
Input themes included typical cost splits between electrical, mechanical, and general construction, commissioning and fit-out norms, timing of transformer and switchgear procurement, and how liquid cooling and higher rack densities are shifting budgets and schedules.
Distribution of primary research fieldwork respondents
| Company type | Respondent position | Region |
|---|---|---|
| Top tier: 32% | CXOs: 14% | |
| Mid tier: 53% | Functional/Unit leaders: 33% | |
| Smaller Players: 15% | Managers: 53% |
Market-Sizing & Forecasting
Sizing starts with a top-down build from the U.S. data center construction demand pool, where planned and active capacity additions, new campus builds, and major expansions are translated into annual spend using observed cost-per-megawatt ranges and typical infrastructure splits. To keep the number realistic, we corroborate it with selective bottom-up checks, such as sampled project budgets, contractor revenue exposure to data center work, and channel checks on equipment and installation intensity, and we adjust when coverage is uneven across states or project sizes.
A few market fingerprints were tracked because they consistently influence construction value. These include new capacity under construction (MW), the electrical-to-mechanical share shift as densities rise, lead times for transformers and switchgear that can delay spend recognition, adoption of liquid cooling retrofits versus greenfield builds, and regional permitting and interconnection timelines that change the delivery calendar. For forecasting, scenario analysis is used so alternate paths can be tested for power availability constraints, cost inflation, and the pace of hyperscale and colocation build commitments. Final assumptions are then aligned to what interviewees see in near-term backlogs and bid activity.
Data Validation & Update Cycle
Model outputs are checked against independent signals such as reported construction investment levels, observed MW pipelines in key hubs, and movements in construction cost indices that should show up in pricing. When a variance looks large, we review the input drivers, and the team re-contacts selected experts to confirm whether the shift is scope, timing, or a real demand change.
Before sign-off, the dataset goes through a multi-step analyst review with consistency checks across years, currency timing, and the logic for cost splits between major systems. Reports are refreshed annually, and interim updates are made when material events occur, such as major shifts in power access, unusually large project announcements, or sharp cost swings. Right before delivery, a final pass is completed so the published view reflects the latest validated information.
Mordor Intelligence's United States Data Center Construction Market Size Versus Other Published Estimates
Published values for U.S. data center construction often differ widely because the same phrase can be used for different baskets of spending. Some sources treat construction as a broad capital deployment concept, while others restrict it to contractor-delivered build and fit-out work tied to operational facilities.
The main gap comes from mixing building activity with owner-side technology and operating revenue streams. Mordor Intelligence counts construction and fit-out work in the United States but excludes server procurement, modular container rentals, and colocation lease revenues, which keeps the number tied to actual construction delivery.
Benchmark comparison
| Source | Market Size | Gaps in Research Methodology |
|---|---|---|
| Mordor Intelligence | USD 14.35 B (2025) | |
| Real Estate Advisory A | USD 31.50 B (2024) | This figure is presented as total capital deployment, and the scope detail is limited, so it can blend construction with wider investment buckets and timing effects that do not track delivered construction value consistently. |
| Industry Bulletin B | USD 47.72 B (2029) | This estimate is framed as investment and includes a broad set of solution categories and systems, and it is also a different year, so inflation assumptions and aggressive build schedules can lift totals versus a construction-only scope. |
The spread in the table is mainly explained by what is counted and when it is counted, not by a disagreement that data centers are expanding quickly. By keeping the scope linked to building and fit-out spend and then checking it against MW pipeline signals and cost indices, we end up with a value that can be traced back to clear project drivers and repeated each refresh cycle.


Key Questions Answered in the Report
What annual growth rate is forecast for United States data center construction?
Spending is anticipated to rise at an 8.89% CAGR from 2026 to 2031.
Which tier category is expanding fastest?
Tier 4 facilities, designed for 99.995% uptime, are expected to grow at 9.12% per year through 2031.
Why are hyperscalers choosing to self-build?
Self-builds let hyperscalers control latency, security, and power sourcing while reducing per-megawatt costs by up to 40%.
What supply-chain bottleneck most affects project schedules?
Large power transformers face 24-30-month lead times, often delaying project kick-off.
How are operators cooling higher-density racks?
Direct-to-chip and immersion systems are standard in new halls, whereas legacy sites add rear-door heat exchangers during retrofits.
Which regions are attracting new mega-campuses?
Pennsylvania, Mississippi, Texas, and Ohio lead due to shorter utility queues, lower land costs, and sizeable tax incentives.
Page last updated on:


