
Market Overview
| Study Period | 2020 - 2031 |
|---|---|
| Forecast Data Period | 2026 - 2031 |
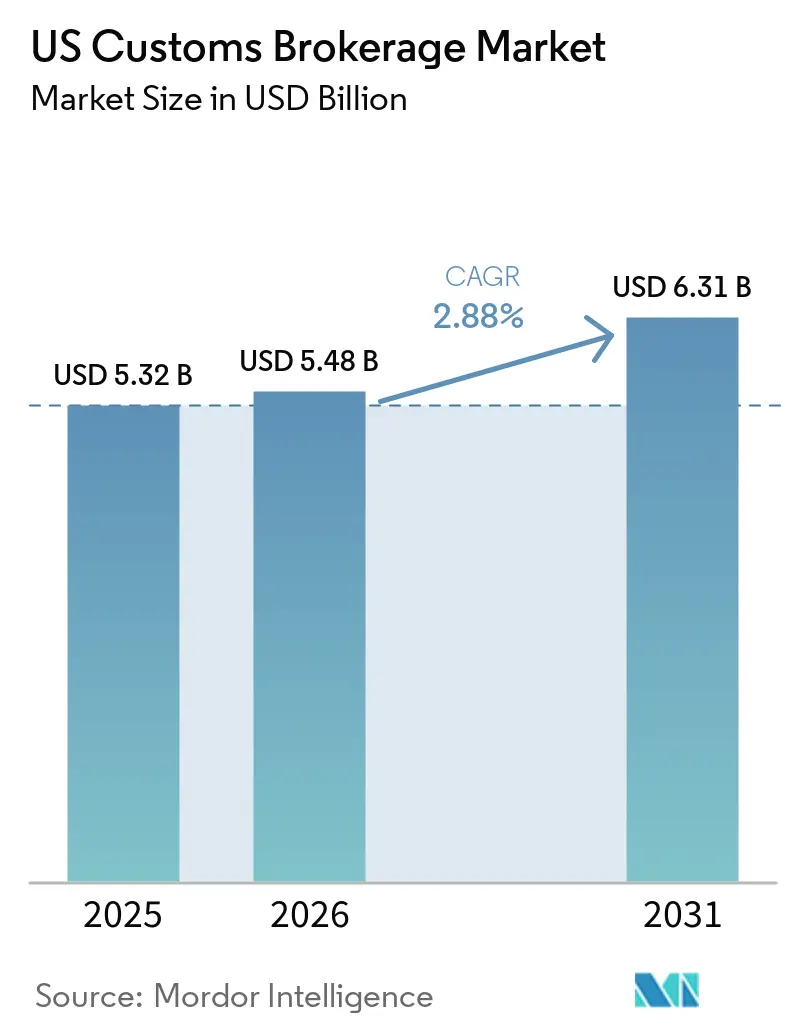
| Base Year Market Size (2025) | USD 5.32 Billion |
| Market Size (2026) | USD 5.48 Billion |
| Market Size (2031) | USD 6.31 Billion |
| Growth Rate (2026 - 2031) | 2.88 % |
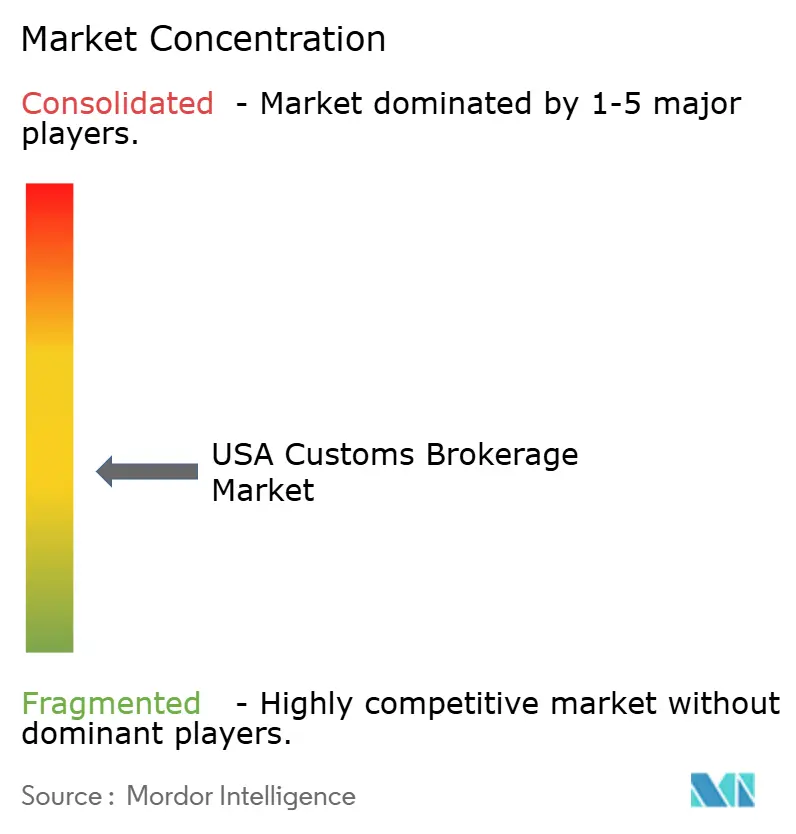
| Market Concentration | Medium |
Major Players *Disclaimer: Major Players sorted in no particular order Image © Mordor Intelligence. Reuse requires attribution under CC BY 4.0. | |
US Customs Brokerage Market Analysis by Mordor Intelligence
The US Customs Brokerage Market size is estimated at USD 5.48 billion in 2026, and is expected to reach USD 6.31 billion by 2031, at a CAGR of 2.88% during the forecast period (2026-2031).
Import volumes have normalized above pre-2020 levels, yet brokers contend with rapidly shifting tariffs, forced-labor scrutiny, and digitization mandates that compress traditional fee structures while opening new advisory revenue streams. Integrated freight forwarders bundle clearance with transportation and warehousing, capturing scale efficiencies that squeeze standalone broker margins. In parallel, digital-first platforms grow at double-digit rates as importers demand API connectivity and real-time status visibility. Nearshoring to Mexico channels more traffic through Southwest land crossings, where cross-border expertise commands a complexity premium. Automotive and electric-vehicle components lead segment acceleration as new USMCA rules elevate origin-verification and labor-value documentation requirements.
Key Report Takeaways
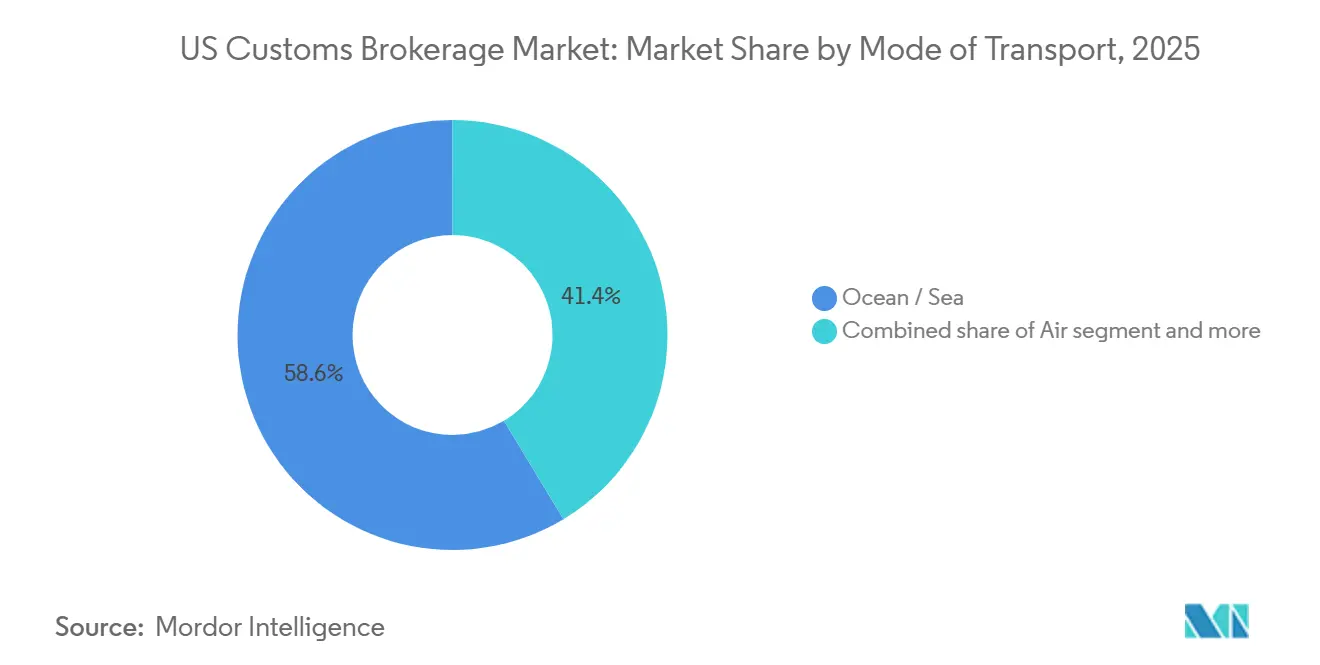
- By mode of transport, ocean freight led with 58.63% revenue share in 2025; air cargo is projected to expand at a 4.09% CAGR through 2031.
- By broker type, forwarder and 3PL-integrated operators held 65.46% of the United States customs brokerage market share in 2025, while pure customs brokers recorded the highest forecast CAGR at 3.51%.
- By importer size, large enterprises accounted for 42.69% of the United States customs brokerage market size in 2025, and SMEs/micro-shippers are advancing at a 4.72% CAGR to 2031.
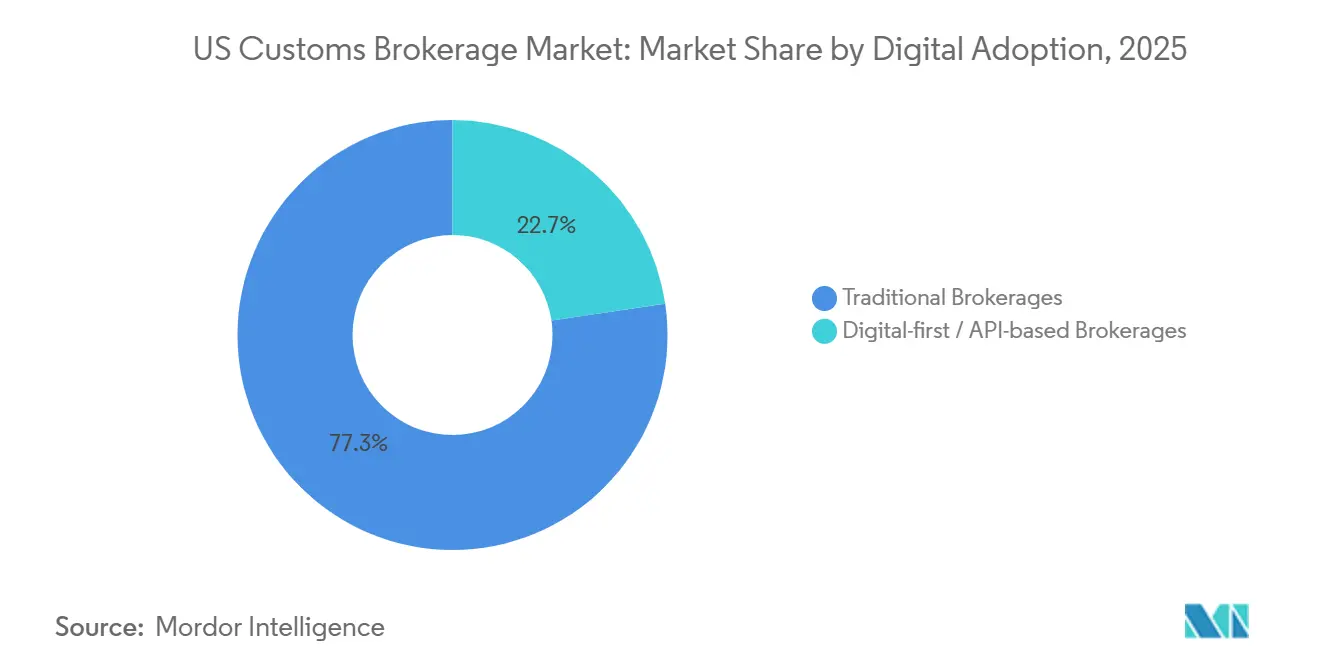
- By digital adoption, traditional brokerages controlled a 77.32% US customs brokerage industry share in 2025; digital-first platforms are expanding at a 10.45% CAGR.
- By end-user industry, retail and e-commerce captured 30.15% share of the United States customs brokerage market size in 2025, and automotive and EV are growing at a 5.64% CAGR.
- By geography, the West region led with 32.61% share in 2025, while the Southwest region is pacing growth at a 4.67% CAGR.
Note: Market size and forecast figures in this report are generated using Mordor Intelligence’s proprietary estimation framework, updated with the latest available data and insights as of January 2026.
Market Trends and Insights
Drivers Impact Analysis of US Customs Brokerage Market*
| Driver | (~) % Impact on CAGR Forecast | Geographic Relevance | Impact Timeline |
|---|---|---|---|
| Import volumes rebounding | +1.0% | National, West, Northeast | Short term (≤ 2 years) |
| Tariff and trade-agreement complexity | +0.9% | Automotive and manufacturing hubs | Medium term (2-4 years) |
| Customs digitization (ACE, PGA) | +0.7% | National, tech-forward regions | Medium term (2-4 years) |
| Rise of e-commerce micro-importers | +0.6% | Urban e-commerce hubs | Short term (≤ 2 years) |
| Monetization of ACE data | +0.5% | National | Long term (≥ 4 years) |
| 21st Century Customs Framework | +0.4% | National | Long term (≥ 4 years) |
| Source: Mordor Intelligence | |||
Digitization and Automation of Customs Processes
Automated Commercial Environment adoption stands at 98%, handling above 35 million formal entries annually. Integration with partner agencies has compressed clearance cycles from days to hours. Leading brokers deploy machine-learning classification tools that achieve more than 95% code-assignment accuracy, cutting manual touchpoints and freeing staff for advisory work[1]. CBP’s 2024-2028 IT roadmap earmarks USD 1.8 billion for blockchain pilots and AI-based risk scoring, further raising the technology bar for market participants.
Rise of E-commerce Micro-Importers Requiring High-Frequency Clearances
More than 400,000 US businesses imported goods in 2025, up 60% since 2019, with micro-importers representing 38% of the total. Digital brokers have responded with self-service portals and flat-fee models that appeal to entrepreneurs seeking transparent pricing. Platforms such as Amazon Global Logistics streamline cross-border fulfillment, yet many small shippers misclassify goods or overlook labeling rules, amplifying compliance risk. Brokers balancing automation with proactive education win loyalty in this dispersed client base.
Monetization of ACE Data into Value-Added Analytics Services
Large brokers leverage aggregated entry data to benchmark duty spend, identify optimization opportunities, and forecast regulatory change patterns. Proprietary dashboards visualize clearance times and PGA hold frequencies, enabling importers to fine-tune logistics strategy. Some brokers license anonymized trade-flow intelligence to third parties, creating new revenue streams that reward early investment in cloud infrastructure and data-science teams.
CBP “21st Century Customs Framework” Unlocking New Broker Roles
The framework proposes tiered broker accreditation tied to compliance history, technology integration, and data-sharing commitments. Elite status promises expedited release and lower examination rates, offering brokers a tangible competitive edge. Firms investing in supply-chain transparency tools and ESG due diligence platforms are positioning themselves to capitalize on these forthcoming benefits.
Restraints Impact Analysis of US Customs Brokerage Market*
| Restraint | (~) % Impact on CAGR Forecast | Geographic Relevance | Impact Timeline |
|---|---|---|---|
| Trade-policy volatility | −0.5% | Import-dependent sectors nationwide | Short term (≤ 2 years) |
| Forced-labor and ESG compliance costs | −0.4% | China-linked supply chains | Medium term (2-4 years) |
| Shortage of licensed brokers | −0.7% | Specialized niches | Long term (≥ 4 years) |
| DIY self-filing software | −0.6% | Low-value high-frequency shipments | Medium term (2-4 years) |
| Source: Mordor Intelligence | |||
Shortage of Licensed Customs Brokers Driving Wage Inflation
The October 2025 Customs Broker License Exam posted a sub-15% pass rate, while the average broker age exceeds 43 years. Mid-level licensed professionals now command salaries 20-30% higher than 2022 levels. Smaller firms without automation budgets face service constraints as veteran staff retire.
Expansion of DIY Self-Filing Software Eroding Fee Margins
Platforms such as Flexport and Freightos price entries at USD 25-50, well below traditional broker rates[2]. Routine shipments migrate to self-service channels, leaving brokers to compete on high-touch compliance work. Subscription and retainer models are gaining traction as firms seek revenue predictability in the face of transactional erosion.
*Our forecasts treat driver/restraint impacts as directional, not additive. The impact forecasts reflect baseline growth, mix effects, and variable interactions.
US Customs Brokerage Market Segment Analysis
By Mode of Transport:
Ocean Holds Scale While Air Gains MomentumOcean freight held 58.63% of the United States customs brokerage market share in 2025 as importers favored cost-efficient containerized shipping[3]. The United States customs brokerage market size tied to air cargo is projected to grow at a 4.09% CAGR through 2031 as e-commerce and time-sensitive industries prioritize speed. Express integrators leverage integrated clearance to shorten cycle times, while land-border truck and rail entries gain ground in the Southwest corridor.
Container reliability improvements following pandemic disruption have reinforced the ocean’s cost advantage, yet recurring labor actions and slot allocation constraints spur some shippers to shift high-value goods to air despite the premium freight cost. Brokers with multi-modal expertise are best positioned to capture clients that balance speed and cost across seasonal demand cycles.

By Broker Type:
Integrated Operators Dominate as Pure-Play Brokers SpecializeForwarder-linked and 3PL-integrated operators controlled a 65.46% share in 2025, reflecting shippers’ preference for single-invoice logistics solutions that bundle clearance, carriage, and warehousing. Pure customs brokers grew at a 3.51% CAGR as complex verticals such as FDA-regulated goods and foreign-trade-zone operations demanded specialized knowledge.
The acquisition of Livingston International by Purolator for USD 684.4 million in February 2025 underlines consolidation momentum as integrated operators seek deep compliance capabilities. Niche brokers respond by doubling down on vertical intelligence and personalized service that larger networks struggle to replicate.
By Importer Size:
SMEs Accelerate While Enterprises Explore Hybrid FilingLarge enterprises captured 42.69% of the United States customs brokerage market size in 2025, supported by multi-broker panels and embedded compliance teams. SMEs and micro-shippers are registering a 4.72% CAGR due to accessible digital-broker offerings and cross-border e-commerce programs.
Volume discounts enable corporates to negotiate aggressive fee schedules, placing margin pressure on brokers. Conversely, SMEs prioritize simplicity and education, rewarding brokers that provide intuitive portals and transparent pricing. Mid-market importers gravitate toward brokers offering a blend of cost efficiency and subject-matter expertise without enterprise-level overhead.
By Digital Adoption:
API Brokerage Disrupts Legacy WorkflowsTraditional brokerages held a 77.32% share in 2025, yet digital-first players are advancing at a 10.45% CAGR as importers integrate clearance data with ERP and e-commerce systems. The United States customs brokerage market size attributable to digital-only platforms is expected to triple by 2031 if current adoption trends persist.
Legacy firms accelerate technology upgrades to protect share, investing in robotic process automation and cloud-native SaaS tools. Those that succeed blend decades of regulatory know-how with modern data architectures, delivering a hybrid value proposition that resonates with risk-averse shippers.
By End-use Industry:
Retail Leads, Automotive & EV Sets the PaceRetail and e-commerce accounted for 30.15% of the US customs brokerage industry size in 2025, fueled by high-frequency parcel imports. Automotive and EV posted the fastest CAGR at 5.64% as battery and component shipments surged under USMCA rules.
Electronics and semiconductors gain momentum on the back of CHIPS Act incentives, while life-science imports require premium FDA documentation that lifts brokerage revenue per entry. Brokers with automotive rule-of-origin specialists and battery compliance expertise are well placed to ride the sector’s uptrend through 2031.
Geography Analysis
The West handled 32.61% of 2025 brokerage revenue through mega ports in Los Angeles, Long Beach, Oakland, and Seattle. Proximity to Asian suppliers and established drayage ecosystems support scale advantages, yet importers diversify to Gulf and East Coast gateways to mitigate labor disruption and congestion risk.
The Southwest is the fastest-growing region at a 4.67% CAGR, as nearshoring to Mexico channels automotive and electronics flows through Laredo, Nogales, and El Paso. Brokers with bilingual staff and cross-border regulatory expertise command premium fees. Southbound supply chains generate offsetting export clearances that further boost transactional volume.
The Southeast leverages Panama Canal expansion and capital upgrades at Savannah and Charleston to capture discretionary cargo. The Northeast remains critical for European trade and high-value goods through the Port of New York and New Jersey, while Midwest land ports manage robust Canada trade despite transitional challenges linked to Canada’s new accounting system.
Regulatory Landscape
Customs brokerage in the United States is governed by U.S. Customs and Border Protection (CBP) under 19 CFR Part 111, which covers licensing, permitting, recordkeeping, and brokers' responsibility for maintaining supervision and control. CBP has also been signaling modernization priorities, including its September 2025 Next Generation Framework (NGF) Broker Modernization Issue Paper, which emphasizes technology integration and stronger governance practices as part of the operating baseline.
In June 2026, the Executive Order titled Strengthening Customs Enforcement directed the Department of Homeland Security to establish enhanced vetting for customs brokers and importers, and to define importer-of-record good standing requirements within 180 days. This increases the compliance burden on brokers to screen clients and document due diligence. Separately, FMCSA financial responsibility requirements (minimum USD 75,000 in financial security) apply for broker and freight forwarder operating authority, tightening operational risk controls for logistics providers that also hold broker or forwarding authority.
Value Chain Analysis
The customs brokerage value chain starts with importers, from enterprises through micro-importers, and their upstream sellers. It then moves through transportation providers (ocean carriers, airlines, and cross-border truck/rail operators) and port or terminal ecosystems where shipment data is generated. Brokers operate at the orchestration layer, collecting commercial documents, classifying goods, preparing entry and entry summary data, arranging bonds, coordinating duties and fee payment, and managing admissibility requirements tied to partner government agencies via single-window infrastructure.
Digitization is centered on CBP's Automated Commercial Environment (ACE), which supports filing, status messages, and government holds. CBP is progressing toward ACE 2.0 to improve visibility and interoperability. Recent ACE-driven process changes have introduced new checkpoints across the chain, including updated filer-code validation logic that can reject entries when filer codes are inactive or improperly linked, and a June 2025 increase in HTS numbers per entry summary line (from 8 to 32) that supports more complex declarations while increasing data-quality demands. CBP's ACE Manifest Modernization schedule (Release 1 for April 2026 and Release 2 for May 2026) also requires brokers and their software providers to update interfaces for manifest and in-bond workflows. In parallel, Revenue Modernization efforts are moving collections to online platforms such as Pay.gov, reducing port-level paper processes while increasing the need for clean, system-ready datasets.
Competitive Landscape
The United States customs brokerage market exhibits moderate fragmentation, with the top five firms holding 42% combined share. Consolidation is driven by technology scale ambitions as evidenced by Purolator’s Livingston takeover. C.H. Robinson reports more than 3 million shipping tasks automated via generative AI, underscoring a pivot toward digital labor[4].
Leading brokers deploy AI-driven classification engines, blockchain-based origin verification, and predictive analytics dashboards to lower error rates and unlock advisory revenue. Strategic partnerships with fintechs deliver trade-credit and duty-deferral options that tie brokerage services to importer working-capital flows.
Smaller specialists defend share through vertical focus in pharmaceuticals, aerospace, and apparel that demand bespoke compliance attention. Market dynamics are coalescing around a bifurcated structure where large digitalized networks compete on price and throughput, while niche players win complex, high-margin assignments.
US Customs Brokerage Industry Leaders
-
FedEx Corporation
-
Expeditors International
-
C.H. Robinson
-
Livingston International
-
UPS Supply Chain Solutions
- *Disclaimer: Major Players sorted in no particular order
US Customs Brokerage Market Companies Covered in this Report
- Expeditors International of Washington, Inc.
- C.H. Robinson Worldwide, Inc.
- UPS Supply Chain Solutions
- FedEx Logistics
- Livingston International (acquired by Purolator)
- DHL Global Forwarding
- Kuehne + Nagel Inc.
- DSV (incl. DB Schenker)
- A.N. Deringer, Inc.
- Flexport, Inc.
- CEVA Logistics (Acquired by CMA CGM)
- OEC Group
- BDP International
- SEKO Logistics
- Kerry Logistics (USA)
- Nippon Express
- GEODIS USA
- C.H. Powell Co.
- Alba Wheels Up International
- GHY USA Inc.
Market Opportunities and Future Outlook
Enforcement-led compliance services represent a concrete whitespace area as CBP and DHS move toward tighter controls on importer eligibility and broker due diligence. The June 2026 Executive Order, Strengthening Customs Enforcement, directs enhanced vetting for brokers and risk-based changes to importer-of-record standing. That creates demand for customer-screening workflows, documentation governance, and advisory services that help importers demonstrate compliant operating presence and provide the transparency CBP is seeking.
Technology-enabled brokerage operations also create openings tied to CBP modernization milestones. ACE Manifest Modernization releases scheduled for April 2026 (Release 1, including in-bond processing updates) and May 2026 (Release 2, including air and rail manifest interface updates) will require importers, carriers, brokers, and software intermediaries to update integrations and data validation logic. Providers that can package API connectivity, audit-ready recordkeeping, and automated classification and exception handling into repeatable offerings should capture spend from both traditional brokerages modernizing legacy systems and importers expanding self-service filing but seeking controlled oversight for complex entries.
Recent Industry Developments in US Customs Brokerage Market
- June 2026: The White House issued the Executive Order, Strengthening Customs Enforcement, directing DHS and CBP to tighten importer and broker vetting and to define new good-standing requirements on an accelerated timeline. The order increases the compliance workload around importer-of-record qualification, documentation, and broker due diligence, lifting the value of advisory-led brokerage services alongside transaction processing.
- May 2025: CBP implemented the Bond Centralization Program, standardizing surety processing across ports. The change shifts bond handling toward more uniform workflows, reducing port-by-port variance and pushing brokers to align internal controls and customer onboarding with centralized bond requirements.
- February 2025: Purolator acquired Livingston International for USD 684.4 million, expanding its North American customs clearance footprint. The deal reinforced consolidation dynamics by giving integrated logistics networks more scale in compliance resources and technology investment, while also increasing competitive pressure on smaller standalone brokerages.
US Customs Brokerage Market Report Scope and Research Methodology
Market Definition and Coverage
This market covers the revenues earned in the United States from customs brokerage services that help import shipments get cleared, including entry filing support, classification, bond handling, and release coordination with CBP across major transport modes.
Scope exclusions: We exclude domestic freight forwarding, transloading, bonded warehousing revenue, outbound export filing services, and brokerage activity that takes place inside Foreign Trade Zones.
Segments Covered in This Report
- By Service Type
- Customs Clearance
- Trade Compliance Advisory
- Duty Drawback & Refund Services
- Freight Forwarding-Linked Brokerage
- By Mode of Transport
- Ocean
- Air
- Truck
- Rail
- By End-user Industry
- Consumer Goods & Retail
- Automotive
- Electronics & Hi-Tech
- Agriculture & Food
- Pharmaceuticals & Healthcare
- By Client Size
- Enterprise Importers (more than $50 M annual imports)
- Mid-market Importers ($5-50 M)
- Small & Micro Importers (less than $5 M)
- By Geography
- Northeast
- Midwest
- Southeast
- Southwest
- West
Data Sources, Market Sizing, and Validation
Desk Research
Desk research was used to set the operating context for customs brokerage demand and to anchor a few hard constraints for the model, before assumptions were checked in the field. Public, non-paywalled sources such as U.S. Customs and Border Protection updates and enforcement statistics, U.S. International Trade Commission data, U.S. Census Bureau trade series, Bureau of Transportation Statistics releases, and U.S. Department of Transportation freight indicators were reviewed to understand import flows, mode mix, and compliance friction.
We also reviewed importer and logistics disclosures in annual reports, investor presentations, association and port authority publications, and reputable press coverage on rule changes and peak season conditions. Where needed, paid subscriptions were used selectively for company financials and monitoring, and shipment-level import or export records were used to cross-check directionally how volumes moved by lane and mode. The desk sources listed here are not exhaustive, and many other sources were used for collection, validation, and clarification during the work.
Primary Interviews and Surveys
Primary work focused on interviews and structured surveys with brokerage practitioners, compliance specialists, and operational managers supporting importers and logistics intermediaries across the United States. To close gaps that desk sources could not answer cleanly, we validated typical pricing mechanics, service attachment rates, and how duty drawback, compliance advisory, and bonded corrections behave across modes and customer sizes.
Distribution of primary research fieldwork respondents
| Company type | Respondent position |
|---|---|
| Top tier: 34% | CXOs: 15% |
| Mid tier: 48% | Functional/Unit leaders: 36% |
| Smaller Players: 18% | Managers: 49% |
Market-Sizing & Forecasting
The core sizing logic starts from a top-down build, where import entry activity and mode-level import flow signals are used to reconstruct the demand pool that typically requires a broker. Once that demand pool is formed, it is translated into revenue using realistic pricing and service mix assumptions that reflect how brokerage is billed in practice. To keep results grounded, we then run selective bottom-up approximations, such as sampled broker revenue-to-entry ratios, channel checks on typical entry fees, and a small set of supplier roll-ups where disclosure is available.
Key inputs that shape the model include U.S. import volumes by mode, shifts in entry complexity (for example, higher compliance needs in regulated goods), the share of importers that outsource filings versus self-file, the attach rate of trade compliance advisory, and the prevalence of duty drawback and refund support. Forecasting uses scenario analysis supported by expert views on trade policy direction, e-commerce parcel clearance pressure, port and border congestion patterns, and how automation changes time spent per entry. Where bottom-up evidence is thin for smaller providers, revenue is inferred using importer-count ranges and normalized assumptions that are re-tested in primary calls.
Data Validation & Update Cycle
Totals and growth rates are validated through triangulation across independent signals, followed by variance checks at the mode level and by major service lines so outliers are easy to spot. When a mismatch shows up, the drivers are traced back to the exact assumption that created it, and then the affected inputs are reworked and reviewed before sign-off.
The report is refreshed annually, and interim updates are triggered when material events occur, such as major CBP rule changes, tariff actions, or sustained disruptions that change entry volumes and service mix. Before delivery, an analyst performs a final pass to capture the most recent public indicators and any fresh expert inputs so clients receive an updated view.
Mordor Intelligence's United States Customs Brokerage Market Estimate Compared With Other Published Estimates
Published market values for U.S. customs brokerage can differ even when the topic sounds identical, because researchers do not always count the same revenue streams or apply the same volume and pricing anchors. Differences also show up when the base year is not aligned, when currency timing is handled differently, or when assumptions are not checked with practitioners.
The biggest gap drivers in this market are usually whether brokerage inside Foreign Trade Zones is included, whether export filing services are blended into the total, and whether forwarding or warehousing revenues get pulled in as a shortcut. Another common spread comes from how entry fee progression is treated, since some models assume a flat fee per entry while others reflect mix shifts into higher-touch compliance and post-entry work, which changes the effective average revenue per clearance.
Benchmark comparison
| Source | Market Size | Gaps in Research Methodology |
|---|---|---|
| Mordor Intelligence | USD 5.32 B (2025) | |
| Global Consultancy A | USD 3.99 B (2024) | Uses a narrower revenue lens that drops duty drawback support and several compliance-led post-entry services, and it also appears to undercount e-commerce driven informal and low-value entry activity. |
| Trade Journal B | USD 5.20 B (2024) | Builds totals mainly from a flat per-entry fee assumption and limited uplift for complex entries, which can miss the pricing mix effect from advisory work and corrections. |
Overall, the spread points back to scope choices and the way pricing is linked to entry complexity rather than to simple import volume alone. By keeping FTZ brokerage and export filings out of scope and by checking implied revenue per clearance against primary feedback, the final number stays easier to trace and repeat, which is the control applied by Mordor Intelligence.
Key Questions Answered in the Report
How large is the United States customs brokerage market in 2026?
The United States customs brokerage market size reached USD 5.48 billion in 2026 and is projected to expand steadily through 2031.
What is the expected growth rate for customs brokerage services through 2031?
The market is forecast to grow at a 2.88% CAGR between 2026 and 2031, driven by rising import volumes and expanding advisory services.
Which broker segment is growing the fastest?
Digital-first platforms are advancing at a 10.45% CAGR as importers seek API connectivity and real-time visibility.
Why is the Southwest region the fastest growing geography?
Nearshoring to Mexico and higher USMCA trade flows are lifting clearance volumes at Southwest land ports, supporting a 4.67% CAGR.
What impact do self-filing platforms have on traditional brokers?
DIY software compresses transaction fees for routine entries, prompting brokers to pivot toward high-value compliance advisory and subscription pricing models.
Which end-user industry shows the strongest growth momentum?
Automotive and EV imports lead growth with a 5.64% CAGR due to battery component flows and stringent USMCA origin-verification rules.