
United States Customer Technical Support Services Market Size and Share
Market Overview
| Study Period | 2020 - 2031 |
|---|---|
| Forecast Data Period | 2026 - 2031 |
| Base Year Market Size (2025) | USD 10.06 Billion |
| Market Size (2026) | USD 10.82 Billion |
| Market Size (2031) | USD 15.61 Billion |
| Growth Rate (2026 - 2031) | 7.60 % |
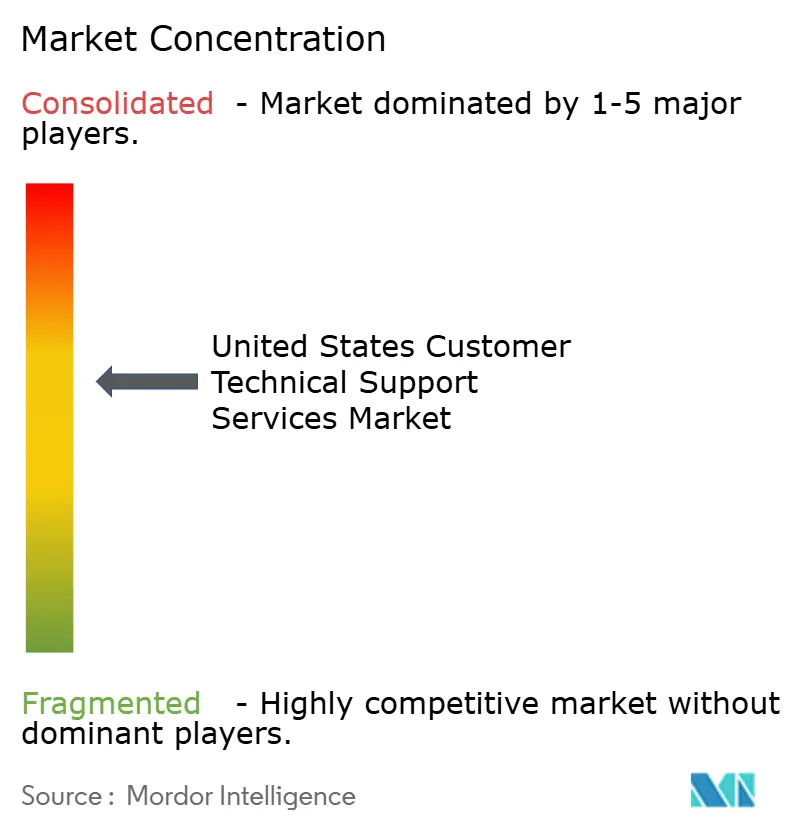
| Market Concentration | Medium |
Major Players *Disclaimer: Major Players sorted in no particular order Image © Mordor Intelligence. Reuse requires attribution under CC BY 4.0. | |
United States Customer Technical Support Services Market Analysis by Mordor Intelligence
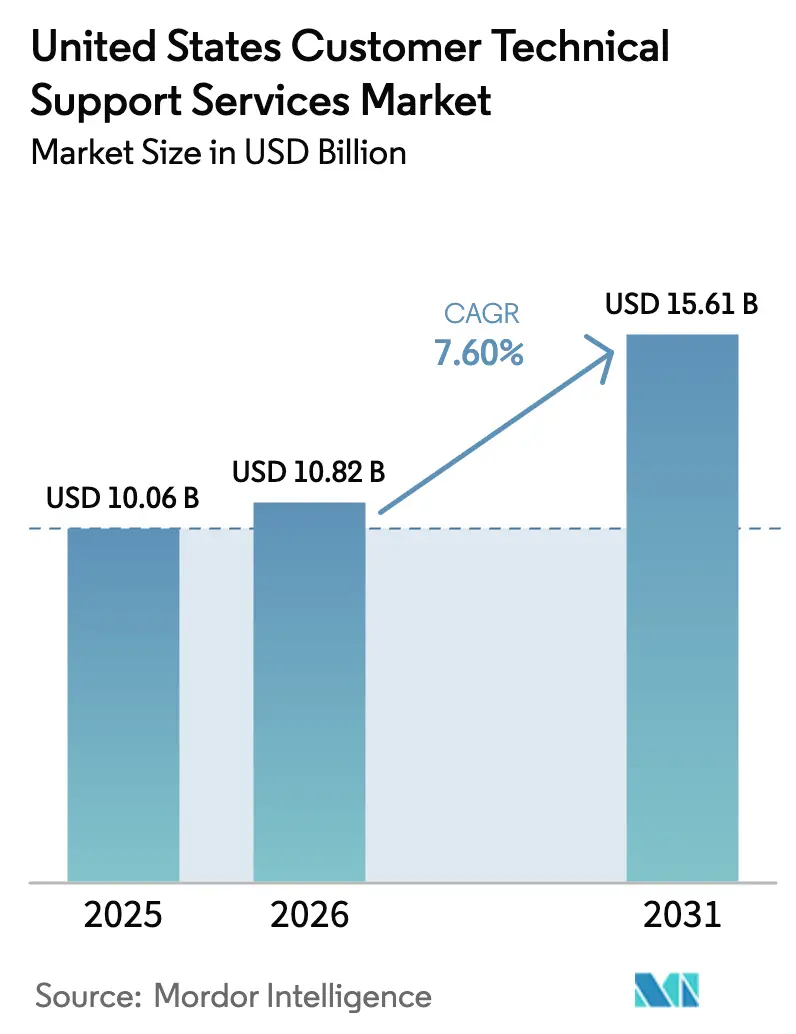
The customer technical support services market size in 2026 is estimated at USD 10.82 billion, growing from 2025 value of USD 10.06 billion with 2031 projections showing USD 15.61 billion, growing at 7.60% CAGR over 2026-2031. Momentum comes from the rapid uptake of smart-home devices, the expanding remote-work culture and rising adoption of predictive AI diagnostics. Traditional computers and laptops remain the core workload driver, but connected living-room ecosystems are deepening demand for multi-device assistance. Remote and online delivery models dominate because they trim cost per ticket and widen geographic reach, while subscription support bundles are anchoring recurring revenue strategies. Competitive intensity is moderate as telecom carriers, device makers and specialist outsourcers race to embed generative AI in resolution workflows and to secure first-call closure advantages.
Key Report Takeaways
- By service type, remote and online technical support led with 42.80% of customer technical support services market share in 2025, whereas self-service and automated support is projected to expand at an 8.02% CAGR through 2031.
- By device type, computers and laptops accounted for a 33.90% slice of the customer technical support services market size in 2025, while smart-home devices are growing fastest at an 8.55% CAGR to 2031.
- By channel, voice and call-center interactions held a 38.70% share of the customer technical support services market size in 2025, and social-media support shows the highest growth at an 8.18% CAGR.
- By end-user industry, residential consumers commanded 54.10% of customer technical support services market share in 2025, yet small and medium enterprises are set to post the strongest 7.78% CAGR during the forecast horizon.
Note: Market size and forecast figures in this report are generated using Mordor Intelligence’s proprietary estimation framework, updated with the latest available data and insights as of 2026.
United States Customer Technical Support Services Market Trends and Insights
Drivers Impact Analysis*
| Driver | (~) % Impact on CAGR Forecast | Geographic Relevance | Impact Timeline |
|---|---|---|---|
| Increasing requirement for software updates | +1.8% | National, concentrated in tech hubs | Medium term (2-4 years) |
| Proliferation of smart-home devices | +2.1% | National, higher adoption in suburban areas | Long term (≥ 4 years) |
| Growing complexity of consumer electronics | +1.5% | National, uniform distribution | Medium term (2-4 years) |
| Expansion of remote-work culture | +1.4% | National, concentrated in metropolitan areas | Short term (≤ 2 years) |
| Adoption of predictive-AI diagnostics | +0.9% | National, early adoption in enterprise segments | Long term (≥ 4 years) |
| Rise of subscription tech-support bundles | +0.8% | National, higher penetration in affluent demographics | Medium term (2-4 years) |
| Source: Mordor Intelligence | |||
Proliferation of Smart-Home Devices
Smart-home installations are reshaping support demand as households juggle device compatibility, cybersecurity and network performance issues. IoT-connected thermostats, cameras and appliances now require technicians who can handle interoperability across multiple protocols and platforms. Healthcare-linked smart-home solutions for remote patient monitoring amplify compliance requirements around HIPAA data handling. Vendors such as Mavenoid have introduced specialized protocols for medical-grade equipment, signaling a deeper need for certified support talent. These dynamics are lifting ticket volumes and lengthening average handling times for residential calls.[1]
Growing Complexity of Consumer Electronics
Hardware makers embed AI features, cloud connectivity and subscription applications in devices, turning post-purchase care into an ongoing relationship. Firmware updates, algorithm tuning and data-privacy inquiries often converge in a single case, driving multi-layered workflows. Apple’s switch to subscription-only AppleCare+ underscores a shift from episodic repairs to lifecycle management.[2] As AI accelerates, support teams must tackle questions about model performance, personalization and consent, raising training obligations and boosting resolution times.
Expansion of Remote-Work Culture
Remote work penetration rose from 19.9% to 23.6% nationally, lifting demand for support that extends beyond office firewalls into home networks. Technical agents are now asked to optimize Wi-Fi mesh setups, secure VPN endpoints and integrate productivity suites across mixed operating systems. Providers are investing in screen-sharing diagnostics and self-install kits that lower truck rolls while ensuring compliance with corporate cybersecurity policies. The distributed workforce trend is therefore anchoring remote-first support design.[3]
Adoption of Predictive-AI Diagnostics
Predictive analytics is turning support from reactive to proactive by spotting anomalies before users log tickets. Machine-learning models categorize issues, trigger automated patches and prioritize high-risk cases, reducing downtime and trimming average handling time by up to 75%. Successful deployment calls for high-quality telemetry, clear KPIs and a workforce skilled in data interpretation. Investment in these platforms is climbing as providers chase first-contact resolution gains and customer-experience differentiation.
Restraints Impact Analysis*
| Restraint | (~) % Impact on CAGR Forecast | Geographic Relevance | Impact Timeline |
|---|---|---|---|
| Rising tech-support-related fraud | -1.2% | National, concentrated in vulnerable demographics | Short term (≤ 2 years) |
| High labor and compliance costs | -0.9% | National, higher impact in regulated industries | Medium term (2-4 years) |
| Data-privacy concerns in remote diagnostics | -0.7% | National, stricter enforcement in California | Medium term (2-4 years) |
| Self-service cannibalizing paid support | -1.1% | National, accelerated in tech-savvy demographics | Long term (≥ 4 years) |
| Source: Mordor Intelligence | |||
Rising Tech-Support-Related Fraud
Consumer losses from scams topped USD 175 million in 2023, prompting the Federal Trade Commission to tighten telemarketing rules and impose stronger record-keeping on inbound support calls. Fraudulent voice cloning and deepfake tactics erode trust and push legitimate providers to adopt multi-factor authentication, verified channels and real-time fraud detection. Compliance spend is rising, particularly for outsourcers servicing elderly or low-literacy segments.
Self-Service Cannibalizing Paid Support
AI chatbots and knowledge bases now handle 30-40% of tickets with higher accuracy and faster turnaround than manual triage. While this lifts customer satisfaction for routine queries, it trims billable human-agent volumes and compresses enterprise margins. Provider strategies therefore balance automation with premium live assistance for complex issues, acknowledging that 71% of users still prefer human help when troubleshooting escalates.
*Our forecasts treat driver/restraint impacts as directional, not additive. The impact forecasts reflect baseline growth, mix effects, and variable interactions.
Segment Analysis
By Service Type: Remote Support Maintains Leadership
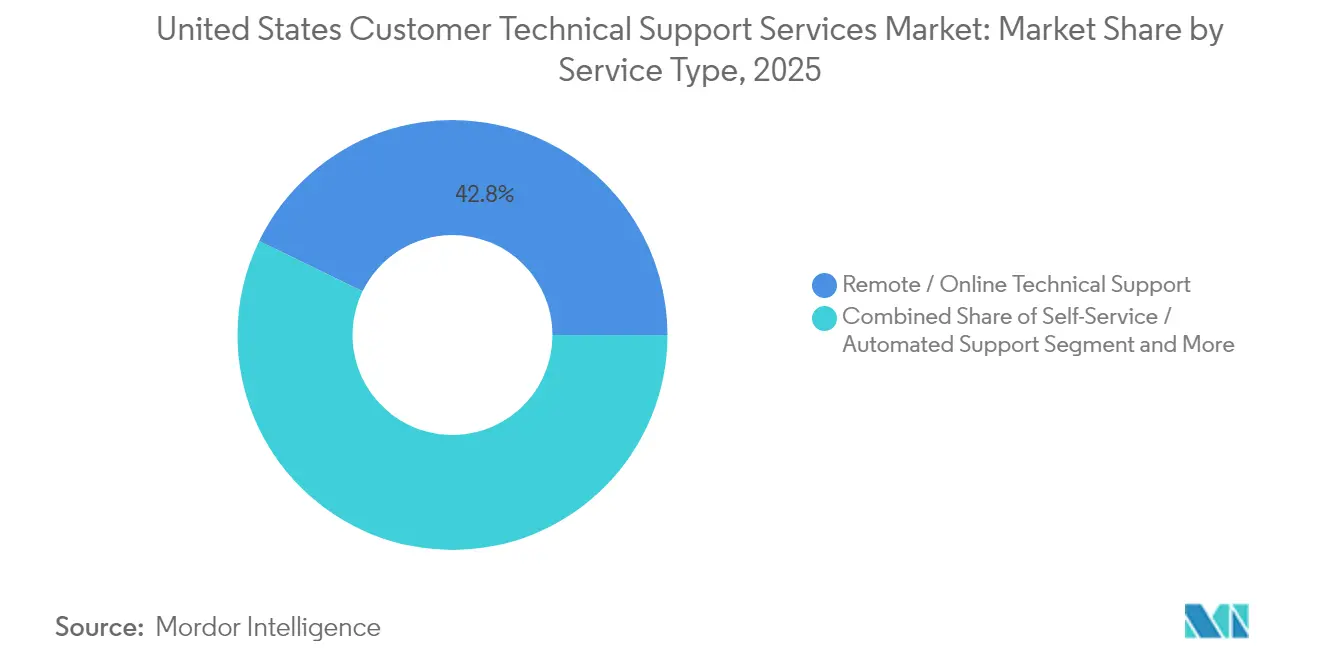
Remote and online assistance accounted for 42.80% of the customer technical support services market size in 2025, reflecting its cost-effective reach and compatibility with distributed work patterns. Subscription-driven programs, such as AppleCare+ and Best Buy memberships, improve lifetime value by bundling priority access, claims handling and device replacement. The self-service and automated support segment, growing at an 8.02% CAGR, benefits from conversational AI and video walkthroughs that resolve simple issues without agent intervention. On-site support remains crucial for enterprise infrastructure rollouts and intricate hardware faults, while managed outsourced support gains traction among budget-constrained SMEs seeking specialized talent. Providers that blend remote diagnostics with field services secure stickier contracts, particularly in regulated verticals that mandate physical verification.
The shift toward predictive maintenance is already reshaping ticket mix. AI engines surface firmware irregularities, prompting pre-emptive outreach that heads off failures and cuts warranty costs. As these capabilities mature, remote resolution is expected to reach 70% of total tickets by 2030, consolidating its market dominance and widening the gap with purely reactive models.

By Device Type: Smart-Home Acceleration Outpaces Legacy Computing
Computers and laptops held 33.90% customer technical support services market share in 2025, tied to their foundational role in productivity and gaming. Smart-home devices, however, register the fastest 8.55% CAGR through 2031 as households adopt connected thermostats, video doorbells and voice assistants. These ecosystems generate cross-device conflicts that elevate troubleshooting complexity. Smartphones and tablets occupy a mature yet stable niche, with calls centering on OS upgrades, cloud sync and app permissions. Consumer electronics such as televisions and consoles see moderate lift, spurred by streaming service integrations and rising esports engagement.
Wearables and ancillary IoT sensors extend support scope into health data and privacy compliance. HIPAA considerations grow in importance when smart-home hubs interface with remote patient monitoring solutions. Providers that certify technicians in medical-device protocols and encryption standards gain an edge when courting healthcare payers and hospital groups.
By Channel: Voice Dominates but Digital Channels Surge
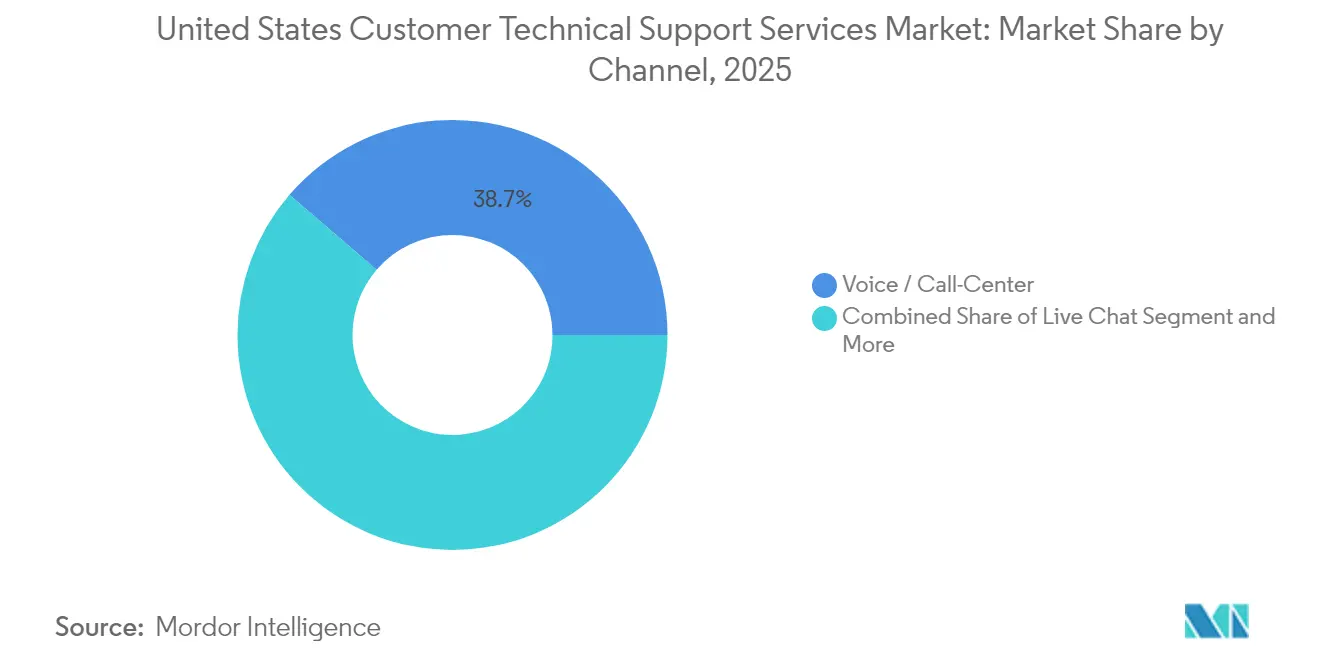
Voice interactions retained 38.70% of the customer technical support services market size in 2025 as callers seek real-time reassurance for complex issues. Investment in AI-guided agent assist and natural-language IVRs is pushing first-call resolution above 90% for leading players such as Verizon’s Project 624. Email and live chat continue to bridge the gap between asynchronous convenience and detailed troubleshooting, while in-app support embeds contextual help directly into software interfaces.
Social media support, growing at an 8.18% CAGR, caters to digitally native consumers expecting rapid brand engagement on public platforms. Providers must balance transparency with data-privacy obligations as sensitive information often surfaces in open threads. Generative AI is enabling sentiment analysis that prioritizes escalations and guides agents toward empathic resolutions.
By End-User Industry: SME Momentum Reconfigures Demand
Residential consumers contributed 54.10% of 2025 revenue, underscoring the ubiquity of multi-device households. Small and medium enterprises, advancing at a 7.78% CAGR, welcome outsourced expertise that keeps pace with cloud migrations, security audits and industry-specific compliance. Their lean staffing models amplify the appeal of managed subscriptions that bundle hardware coverage, software updates and cybersecurity monitoring. Large enterprises continue to purchase high-touch services, focusing on AI-powered analytics, hybrid-cloud orchestration and global service-level agreements.
Differences between enterprise and SME needs are widening. Enterprises demand strategic road-mapping, AI governance and zero-trust security architectures, whereas SMEs prioritize affordability, rapid deployment and consolidated dashboards that simplify oversight. Vendor portals offering tiered service options therefore tailor depth of engagement to organizational maturity.
Geography Analysis
Regional dynamics mirror technology adoption patterns and infrastructure availability. Coastal hubs such as Silicon Valley, Seattle and Austin show the highest ticket density because of concentrated device ownership and early uptake of smart-home ecosystems. These metro areas also host clusters of remote workers whose reliance on cloud collaboration tools raises support complexity. Suburban regions witness accelerating demand as households retrofit legacy wiring with mesh Wi-Fi and smart security systems.
Regulatory variations introduce divergent compliance burdens. California’s Consumer Privacy Act raises documentation and consent requirements for remote diagnostics, prompting providers to deploy stricter data-handling protocols for west-coast tickets. Fraud incidence skews toward states with larger senior populations, necessitating targeted awareness campaigns and multi-factor verification at first contact.
Infrastructure investment is mitigating historical service gaps. Verizon’s planned USD 20 billion acquisition of Frontier Communications aims to extend fiber to 25 million premises across 31 states, unlocking higher-bandwidth remote support and lower latency for AR-based troubleshooting. Talent pools also influence coverage: regions with dense higher-education networks supply ready technicians, whereas rural areas struggle with recruitment, pushing providers toward centralized virtual agent models.
Regulatory Landscape
US customer technical support operations sit under a mix of telecom modernization rules and cross-cutting cybersecurity, privacy, and consumer-protection requirements that affect remote diagnostics, identity verification, and record-keeping. In March 2026, the Federal Communications Commission (FCC) adopted a Report and Order (FCC 26-19) aimed at accelerating network modernization to all-IP infrastructure, and in April 2026 it finalized a Report and Order that simplifies technology transition discontinuance rules, supporting carriers as they retire legacy services that many support programs still troubleshoot.
On the security side, federal standards and guidance increasingly shape procurement and delivery expectations for enterprise and public-sector support desks. NIST published SP 800-172 Rev. 3 in May 2026 for enhanced security requirements to protect Controlled Unclassified Information in nonfederal systems, followed by SP 800-70r5 (May 2026) on secure configuration checklists and SP 800-18r2 (June 2026) on security, privacy, and cybersecurity supply chain risk management plans. These updates raise the compliance bar for providers handling remote access, telemetry, and device configuration across regulated customer environments.
Value Chain Analysis
The value chain starts with OEMs, telecom operators, software vendors, and retailers that define support entitlements (warranty, subscription bundles, and enterprise SLAs) and instrument products with logs and diagnostics that enable remote resolution. Delivery is carried out through a mix of in-house contact centers and specialist outsourcers, supported by CCaaS platforms, knowledge management, workforce tools, and field-service networks for cases that cannot be resolved remotely, while hyperscalers increasingly provide the AI and data infrastructure that powers agent assist, automation, and routing.
Recent partnerships show how AI platforms and service integrators are becoming upstream dependencies for support performance. Optimum expanded its collaboration with Google Cloud in May 2025 to apply Vertex AI and Gemini models for inquiry automation and agent assistance, and Verizon rolled out AI-powered customer experience initiatives in June 2025 using Google Cloud Gemini, including expanded live-chat coverage and an escalation program for complex issues. In enterprise outsourcing and managed services, Cognizant expanded its partnership with Lineage in July 2025 to apply agentic AI and predictive analytics in customer care, while Ricoh USA managed technical support and warranty fulfillment for AMETEK ESP (agreement finalized April 2024), illustrating how third-party providers absorb triage plus fulfillment steps to shorten response times.
Competitive Landscape
Market structure is moderately fragmented. Integrated hardware-software brands such as Apple, Microsoft, and Dell secure loyalty through proprietary ecosystems and bundled warranty programs. Specialist service firms, including Geek Squad and Asurion, compete on nationwide coverage and device-agnostic expertise, while business-process outsourcers like Concentrix and HCLTech leverage economies of scale to deliver omnichannel support to enterprise clients.
AI capability is the primary battleground. Verizon’s Gemini-powered workflow reports 95-96% first-call resolution, shrinking agent minutes, and boosting satisfaction. HCLTech and Microsoft are co-developing generative AI playbooks that embed “next-best” prompts into agent desktops, reducing training time and standardizing quality. M&A activity is accelerating: Capgemini’s USD 3.3 billion WNS takeover augments its Intelligent Operations portfolio, while IBM’s USD 6.4 billion HashiCorp purchase strengthens hybrid-cloud support for regulated workloads.
United States Customer Technical Support Services Industry Leaders
-
Infosys Limited
-
HCL Technologies
-
Accenture plc
-
Tata Consultancy Services
-
IBM Corporation
- *Disclaimer: Major Players sorted in no particular order
Market Opportunities and Future Outlook
Opportunity is widening for providers that productize secure, AI-enabled remote diagnostics while keeping clear routes to human assistance. Emerging transparency and consumer-protection scrutiny around AI in service interactions creates room for compliant operating models, particularly for high-volume consumer and SME support programs that rely on automation. In July 2026, the FTC proposed a policy statement clarifying that Section 5 of the FTC Act covers deceptive AI claims, which raises the stakes for how support providers market chatbot capabilities and how they disclose automation in customer interactions.
A second opportunity is modernizing operating models and tooling as customer behavior shifts toward external generative AI tools for self-resolution, which affects deflection patterns and escalations. Providers that integrate agent assist, intelligent routing, and cross-functional swarming can capture complex cases that spill over from third-party GenAI usage, while documenting disclosures and escalation flows in line with proposals such as the CHATBOT Act (H.R. 7985 introduced March 2026) and state activity like California AB-1609 on chatbot disclosure and access to a human agent. These shifts also reinforce demand for standardized security configurations and supply chain risk controls aligned to newer NIST publications (SP 800-172 Rev. 3, SP 800-70r5, and SP 800-18r2) when support teams manage privileged remote access and configuration changes.
Recent Industry Developments
- June 2026: HCLTech launched an enhanced version of its Fluid Contact Center solution with Cisco, adding AI and cloud-enabled capabilities for customer engagement. The upgrade strengthens HCLTech's contact-center transformation stack for enterprises migrating to modern CCaaS and AI-driven agent workflows.
- September 2025: Tata Consultancy Services partnered with Vodafone Idea to implement an AI-driven business support system platform (TCS HOBS) to improve personalization and automation in customer experience. The deployment highlights how telecom operators are using AI-enabled platforms to rework service operations and reduce friction in high-volume support environments.
- August 2024: Infosys expanded its collaboration with ServiceNow to provide end-to-end managed services supported by its AI-powered ESM Cafe solution. The move broadens Infosys-led delivery for service management and customer support operations on a widely used enterprise workflow platform.
Research Methodology Framework and Report Scope
Market Definition and Coverage
This market covers paid services delivered to US customers to troubleshoot, diagnose, and resolve issues with devices and related software. It spans channels such as voice, chat, email, social media, and in-app support, including on-site visits, remote support, self-service automation, and managed or outsourced delivery.
Scope exclusions: We exclude general customer care that is not technical in nature, along with internal IT helpdesk work done only for a companys own employees.
Segmentation Overview
- By Service Type
- On-site Technical Support
- Remote / Online Technical Support
- Self-Service / Automated Support
- Managed (Outsourced) Technical Support
- By Device Type
- Computers and Laptops
- Smartphones and Tablets
- Smart-Home Devices
- Consumer Electronics (TV, Consoles)
- Others (Wearables, IoT)
- By Channel
- Voice / Call-Center
- Live Chat
- Social Media
- In-App Support
- By End-User Industry
- Residential Consumers
- Small and Medium Enterprises
- Large Enterprises
Data Sources, Market Sizing, and Validation
Desk Research
Desk research was used to anchor the model in real US demand signals for technical help across consumer and business devices. We reviewed public statistics and guidance such as US Bureau of Labor Statistics occupational data, US Census business and services indicators, Federal Communications Commission publications for telecom service context, and Bureau of Economic Analysis price and spending series where relevant. We also used public sources like SEC filings, investor presentations, and reputable press to understand service-mix shifts toward remote support, self-service, and managed delivery.
To stress-test scale, inputs were cross-checked with patent databases for automation trends, public procurement notices where technical support is bundled into contracts, and broad shipment or installed-base indicators for computers, smartphones, and connected devices from official or association channels. A paid subscription for company financials and news intelligence was used selectively to standardize provider revenue disclosures and to track major contract wins or operating changes. This list is not exhaustive, and many other public sources were also used for data collection, validation, and clarification.
Primary Interviews and Surveys
Primary work focused on interviews and surveys with service providers, managed support teams, channel partners, and buyer-side operations leaders who oversee support delivery and budgets. These conversations were used to confirm service-scope boundaries, typical pricing movement by channel, and how self-service and AI diagnostics are changing ticket volumes and escalation patterns across residential, SMB, and large enterprise users.
Distribution of primary research fieldwork respondents
| Company type | Respondent position |
|---|---|
| Top tier: 29% | CXOs: 14% |
| Mid tier: 56% | Functional/Unit leaders: 38% |
| Smaller Players: 15% | Managers: 48% |
Market-Sizing & Forecasting
Sizing starts with a top-down build where device installed base and usage intensity are translated into an addressable support demand pool, then filtered through penetration of paid support, channel mix, and outsourcing rates in the United States. We used market fingerprints such as ticket volumes per active device cohort, the split between remote and on-site resolution, average handling and escalation patterns, and the adoption pace of self-service and automated diagnostics that can deflect basic issues.
Those totals were then corroborated using selective bottom-up approximations, including sampled provider revenue run-rates, channel checks on contract pricing, and a simple volume times average price logic for key device groups like computers and laptops, smartphones and tablets, and smart-home devices. When smaller-provider disclosures were thin, gaps were handled with peer-group benchmarks and sensitivity ranges that were validated again through interviews. Forecasts were produced using scenario analysis supported by a light multivariate regression view, where drivers like connected-device growth, remote-work support loads, outsourcing appetite, and pricing pressure by channel were adjusted to align with expert expectations.
Data Validation & Update Cycle
Outputs are checked through triangulation, where model results are compared against independent indicators such as provider hiring trends, reported services revenue direction, and changes in ticket deflection from automation. Outliers are reviewed in a second pass, and we re-contact interviewees when a key assumption shifts, for example, a visible change in outsourcing mix or a sharp move in remote support pricing.
Before sign-off, the dataset and formulas go through multi-step analyst review so unit assumptions, currency timing, and year mapping stay consistent. Reports are refreshed annually, with interim updates when material events occur, and a final pre-delivery check is completed so clients receive the most current view available.
Mordor Intelligence's United States Customer Technical Support Services Market Size Compared With Other Published Estimates
Published market values for US customer technical support services can vary quite a bit, even when the topic sounds the same, because the underlying scope and counting rules are rarely identical. Differences usually come from what is treated as technical support versus general customer care, how self-service automation is monetized, and whether on-site visits and managed or outsourced delivery are counted consistently.
The biggest gaps tend to show up around bundled support that is packaged with device sales or telecom plans, and around whether self-service and automated support is counted only when it is a paid service line item. Some estimates also apply aggressive price growth across voice and digital channels without validating it through contract checks, while others convert multi-year contracts into annual value in different ways. Counting only paid technical-resolution services across channels, and tying volumes to device cohorts and outsourcing rates, is what keeps the 2025 total aligned to measurable demand signals, a choice applied by Mordor Intelligence.
Benchmark comparison
| Source | Market Size | Gaps in Research Methodology |
|---|---|---|
| Mordor Intelligence | USD 10.06 B (2025) | |
| Industry Association A | USD 8.90 B (2025) | Uses a narrower definition that leans toward outsourced contact-center style support and often excludes on-site technical visits and paid support tied to smart-home and consumer electronics cohorts. |
| Regional Consultancy B | USD 11.70 B (2025) | Appears to fold non-technical customer care and broader CX operations into the total, and applies higher assumed price progression across channels without clear validation from contract and channel checks. |
The spread across published numbers mostly comes down to what is counted as technical support, and how bundled and automated support is treated in revenue terms. Our approach stays traceable because the total can be walked back to device demand pools, channel mix, and paid-service penetration, and then it is sanity-checked with provider disclosures and buyer-side feedback.
Key Questions Answered in the Report
What is the current size of the customer technical support services market in the United States?
The market is valued at USD 10.82 billion in 2026.
How fast is the customer technical support services market expected to grow?
It is projected to advance at a 7.60% CAGR, reaching USD 15.61 billion by 2031.
Which service type leads the market?
Remote and online technical support holds the largest 42.80% share.
Which device category is growing quickest?
Smart-home devices post the highest 8.55% CAGR due to rising IoT adoption.