
Market Overview
| Study Period | 2020 - 2031 |
|---|---|
| Forecast Data Period | 2026 - 2031 |
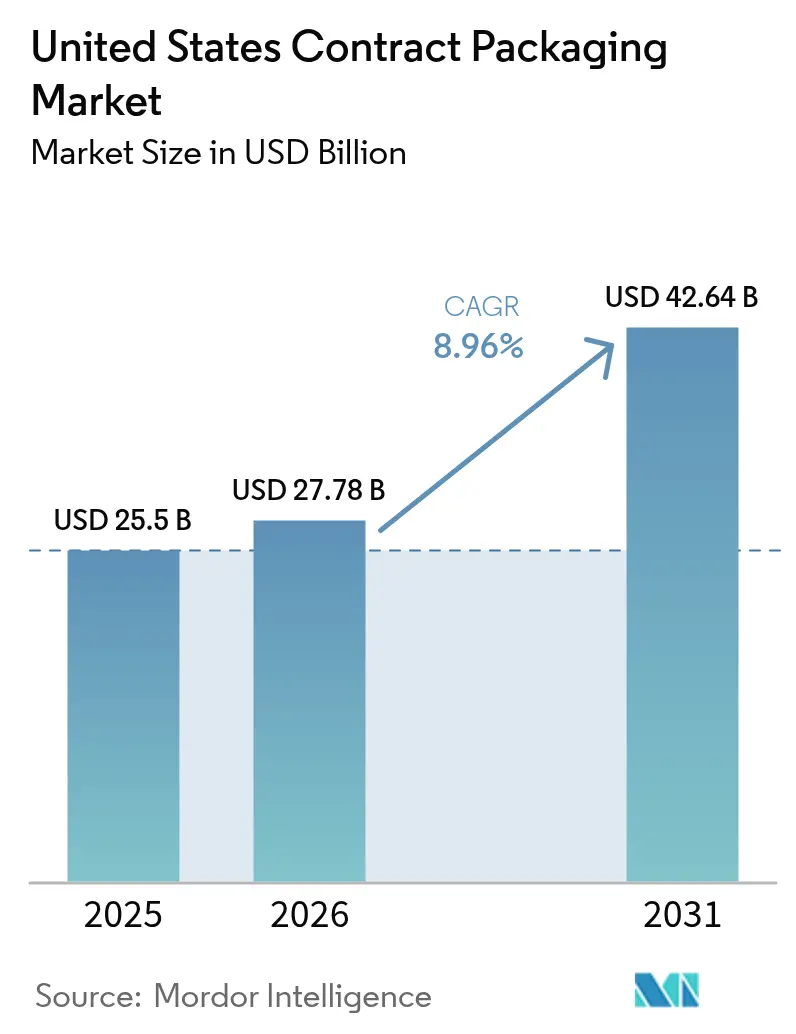
| Base Year Market Size (2025) | USD 25.50 Billion |
| Market Size (2026) | USD 27.78 Billion |
| Market Size (2031) | USD 42.64 Billion |
| Growth Rate (2026 - 2031) | 8.96 % |
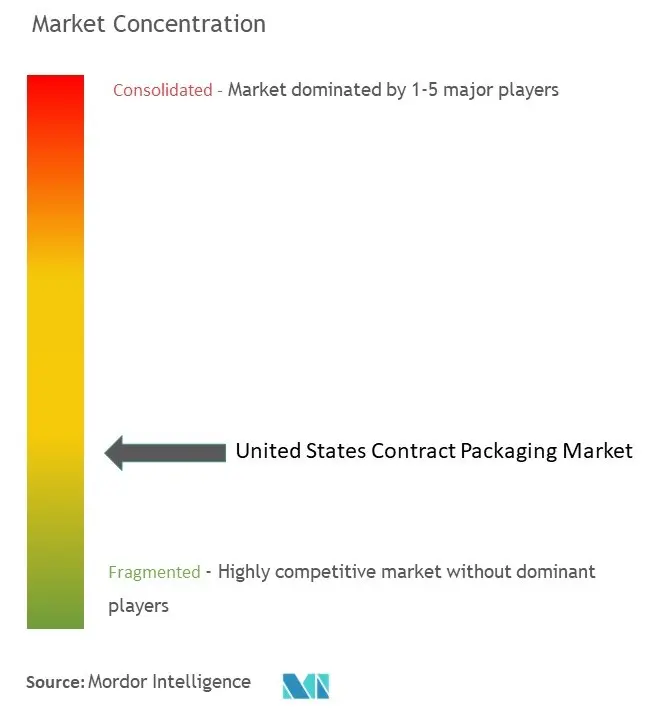
| Market Concentration | Low |
Major Players *Disclaimer: Major Players sorted in no particular order Image © Mordor Intelligence. Reuse requires attribution under CC BY 4.0. | |
United States Contract Packaging Market Analysis by Mordor Intelligence
The United States contract packaging market size was valued at USD 25.50 billion in 2025 and estimated to grow from USD 27.78 billion in 2026 to reach USD 42.64 billion by 2031, at a CAGR of 8.96% during the forecast period (2026-2031). Regulatory momentum, led by the US Food and Drug Administration’s pending front-of-package nutrition-labeling rule, is reshaping packaging specifications and timetables, while the explosive rise of e-commerce fulfillment continues to reward vendors able to deliver agile, right-sized formats. Labor shortages across manufacturing hubs are accelerating robotics adoption, and federal reshoring incentives worth USD 280 billion are stimulating new domestic capacity for pharmaceutical and food contract packagers. At the same time, consumer and legislative pressure for eco-friendly materials is steering demand toward biodegradable and bio-based substrates, encouraging suppliers to align automation, material science, and regulatory expertise inside integrated service models. Together, these dynamics confirm that the United States contract packaging market has evolved from a tactical cost-reduction option into a strategic lever for supply-chain resilience and compliance.
Key Report Takeaways
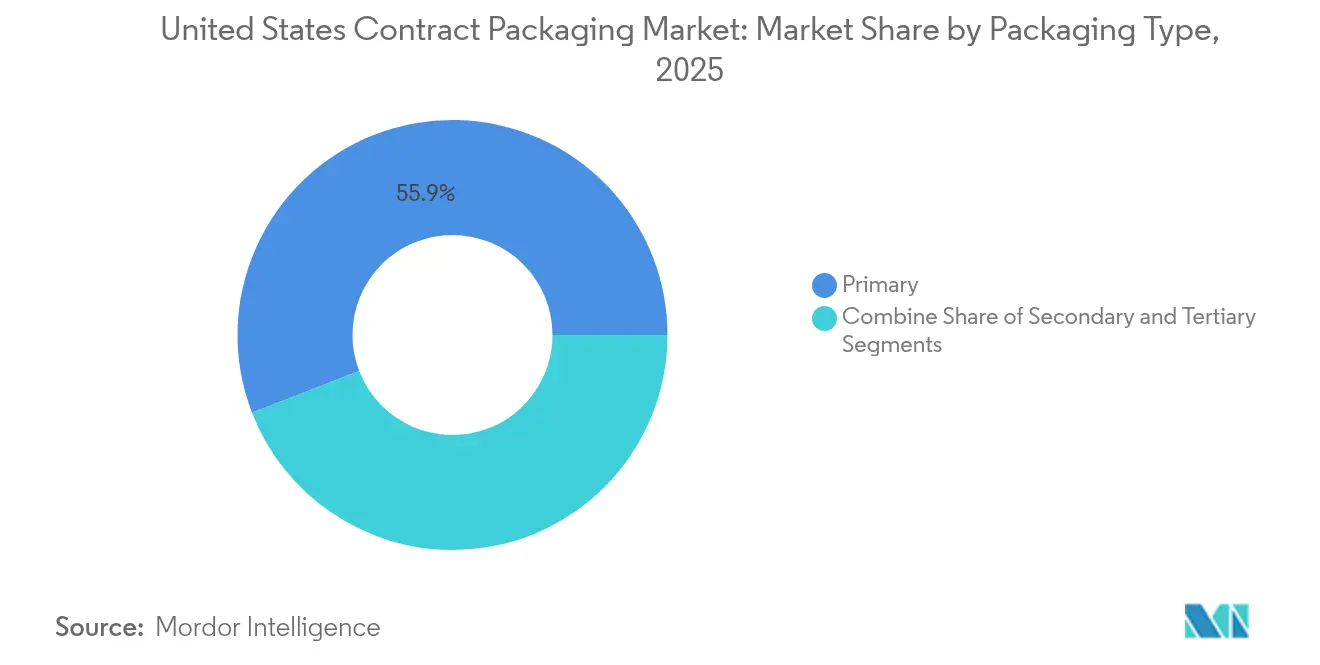
- By packaging type, primary packaging led with 55.88% of United States contract packaging market share in 2025; the segment is expanding at an 11.25% CAGR through 2031.
- By end-user industry, the food sector accounted for 35.06% revenue share in 2025, while pharmaceuticals are projected to grow at a 13.74% CAGR to 2031.
- By service offering, filling and assembly commanded 36.12% share of the United StatesS contract packaging market size in 2025, whereas fulfillment and logistics record the highest projected CAGR at 12.70% through 2031.
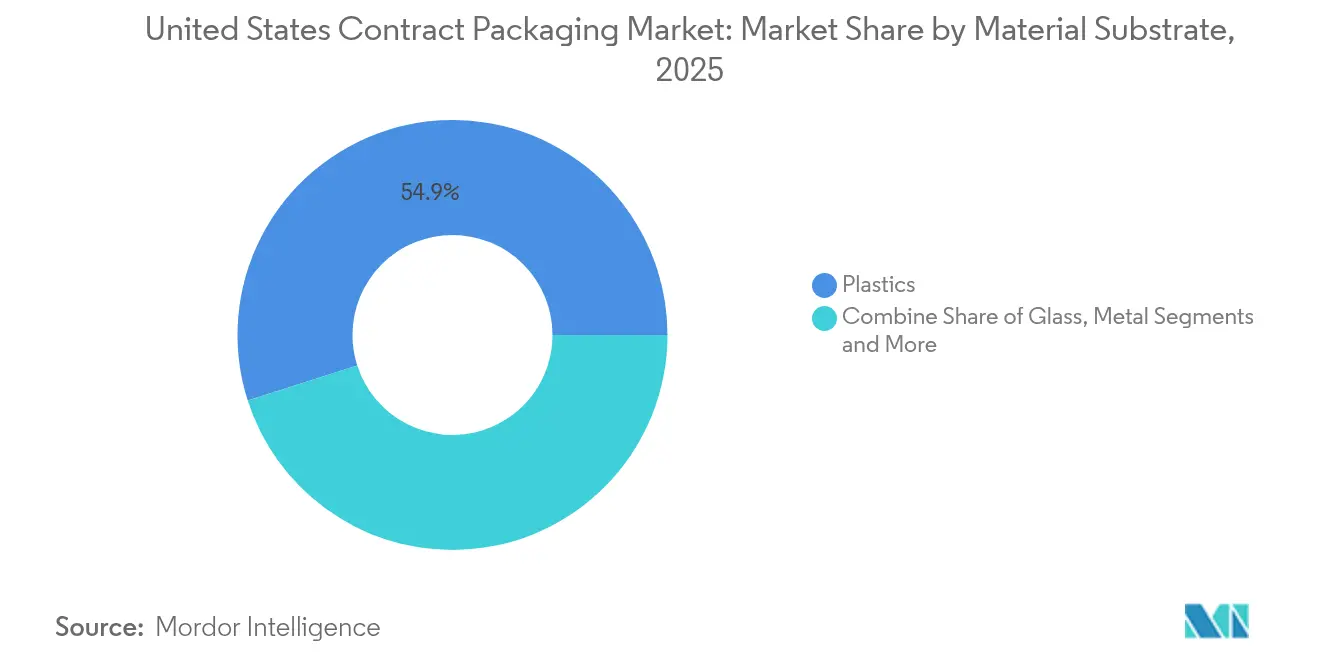
- By material substrate, plastics retained 54.92% share in 2025, yet biodegradable and bio-based options are advancing at a 12.97% CAGR.
- By automation level, semi-automated lines held 32.12% share in 2025, while robotics-integrated systems are rising fastest at 13.70% CAGR.
Note: Market size and forecast figures in this report are generated using Mordor Intelligence’s proprietary estimation framework, updated with the latest available data and insights as of 2026.
United States Contract Packaging Market Trends and Insights
Drivers Impact Analysis*
| Driver | (~) % Impact on CAGR Forecast | Geographic Relevance | Impact Timeline |
|---|---|---|---|
| E-commerce boom drives agile co-packing demand | +1.2% | National, concentration in logistics hubs | Short term (≤ 2 years) |
| Pharma and nutraceutical outsourcing surge | +1.5% | Northeast and Southeast manufacturing corridors | Medium term (2-4 years) |
| Labor shortages accelerate robotics adoption | +0.9% | Midwest and Southern manufacturing regions | Medium term (2-4 years) |
| FDA FOP labeling rule spurs relabeling needs | +0.8% | National, early adoption in major metro areas | Short term (≤ 2 years) |
| Reshoring incentives lift domestic demand | +0.7% | Southern states and Rust Belt regions | Long term (≥ 4 years) |
| Eco-friendly packaging mandates and preferences | +0.6% | California, Northeast, urban markets | Long term (≥ 4 years) |
| Source: Mordor Intelligence | |||
E-commerce Boom Drives Agile Co-packing Demand
The rapid expansion of online retail continues to rewrite packaging economics for brand owners. Dimensional-weight shipping policies reward formats that minimize wasted air, pushing co-packers to redesign primary and secondary packs for lighter, tighter footprints. A surge in ready-to-drink coffee, projected to be worth USD 64.78 billion by 2032, illustrates how category-specific growth fuels line extensions that require flexible filling and labeling capability. Contract packagers able to combine AI-driven demand forecasting with rapid changeovers capture a larger share of e-commerce programs, reinforcing the strategic relevance of the United States contract packaging market for omnichannel brands.
Pharma and Nutraceutical Outsourcing Surge
Heightened regulatory scrutiny and a pipeline of complex biologics are driving drug makers to expand external partnerships. Virtual pharmaceutical firms have cut development costs by up to 50% by leaning on specialized packagers that can manage formulation, sterile fill-finish, and serialization in one workflow The need for precise dosing systems for GLP-1 therapies further raises the bar for contamination control, turning capacity expansions such as Novo Nordisk’s USD 4.1 billion North Carolina facility into anchor opportunities for the United States contract packaging market. [1]Feliza Mirasol, “Novo Nordisk Targets USD 4.1 Billion Expansion,” biopharminternational.com As a result, co-packers that hold Annex 1 expertise and vaccine-grade cleanroom certifications are transitioning from transactional vendors to strategic supply-chain partners.
Labor Shortages Accelerate Robotics Adoption
A tightening industrial labor pool has pushed robot suppliers to forecast a rebound in US installations during 2024 as manufacturers move projects off hold. In packaging halls, articulated robots now control pick-and-place tasks for irregular SKUs, while AI vision systems improve uptime by eliminating manual adjustment. Case studies such as Crider Foods’ retort room, where headcount fell from 20 to 4 employees and water use dropped 66%, demonstrate the productivity gains that justify investments even for mid-size vendors. These successes reinforce the competitive differentiation of automation-ready providers across the United States contract packaging market.
FDA FOP Labeling Rule Spurs Relabeling Needs
The FDA’s proposal to mandate front-of-pack nutrition icons by 2028 is set to generate a multiyear surge in label redesign, material qualification, and inventory write-offs. Large brands above the USD 10 million sales threshold face tight compliance windows, encouraging them to leverage contract packagers with turnkey artwork management and digital print capacity. The projected USD 3.2 billion cumulative opportunity aligns precisely with co-packers that maintain high-mix, low-volume lines capable of parallel SKU rollouts. This dynamic underscores how regulatory events translate directly into expanded revenue for the United States contract packaging market.
Restraints Impact Analysis*
| Restraint | (~) % Impact on CAGR Forecast | Geographic Relevance | Impact Timeline |
|---|---|---|---|
| Rising logistics and cold-chain costs | -1.1% | National, acute impact on temperature-sensitive products | Short term (≤ 2 years) |
| High cap-ex for automation | -0.9% | Manufacturing-intensive regions | Medium term (2-4 years) |
| Fragmented supplement/FOP compliance burden | -0.7% | National, multi-state operations | Short term (≤ 2 years) |
| Brand owners insource core SKUs under inflation | -0.6% | National, high-margin products | Medium term (2-4 years) |
| Source: Mordor Intelligence | |||
Rising Logistics and Cold-Chain Costs
Geopolitical disruptions in the Red Sea and canal corridors have pushed spot freight rates well above long-term averages, adding volatility to domestic inventory planning. [2]UNCTAD, “Freight Rates and Maritime Transport Costs,” unctad.org Temperature-controlled segments carry even higher risk, as limited reefer container availability inflates landed costs for biologics and premium food products. Brand owners are passing those expenses upstream, pressuring contract packagers to widen working-capital buffers or renegotiate delivery terms. AI-derived demand forecasts, like those deployed by Americold, help mitigate uncertainty but cannot fully erase cost swings, constraining profit margin expansion within the United States contract packaging market.
High Cap-ex for Automation
Packaging machinery shipments reached USD 10.9 billion in 2024, a level that underscores the sizable up-front cash commitment required to transition from manual lines to robotics. Mid-tier co-packers often face limited access to low-cost financing, slowing adoption despite known efficiency benefits. Integration complexity compounds the hurdle because retrofitting legacy conveyors and vision systems entails extended downtime and specialist engineering fees. These realities temper the pace at which the United States contract packaging market can fully automate.
*Our forecasts treat driver/restraint impacts as directional, not additive. The impact forecasts reflect baseline growth, mix effects, and variable interactions.
Segment Analysis
By Packaging Type: Primary Packaging Dominates Innovation
Primary packaging accounts for 55.88% of United States contract packaging market share in 2025, and its 11.25% CAGR signals that the segment will capture most incremental revenue through 2031. Demand concentrates in injectable kits, child-resistant vials, and smart blister packs that monitor adherence. Increased personalization in oncology and diabetes therapies pushes fill volumes lower and SKU counts higher, favoring agile filling lines with quick-change tooling. Secondary packaging continues to service club-store displays and retail multipacks, yet innovation intensity remains lower as brands channel capital toward intelligent primary containers.
The segment is also where smart packaging technologies take root. QR-enabled packs provide provenance data, while NFC tags collect patient feedback for real-world evidence programs. Investments such as Gerresheimer’s USD 180 million expansion in Georgia underline the capital requirements for medical-grade plastics and injection-molded inhalers. As a result, the United States contract packaging market sees primary packaging evolve from a passive enclosure to a digitally connected interface.


By End-user Industry: Pharmaceutical Growth Outpaces Food Dominance
The food segment remains the largest revenue contributor at 35.06% in 2025, yet pharmaceuticals are advancing at a 13.74% CAGR, twice the overall market rate. This divergence mirrors drug makers’ willingness to outsource highly specialized fill-finish and labeling steps that demand Grade C cleanrooms and real-time environmental monitoring. Updated Annex 1 sterilization guidance adds further impetus by ratcheting up contamination control requirements.
Ready-to-eat and functional beverage lines continue to allocate volume to the United States contract packaging market, but growth moderates as brands mature their direct-to-consumer supply chains. In contrast, Eli Lilly’s and Novo Nordisk’s multi-billion-dollar North Carolina builds are channeling a fresh wave of injectable demand toward regional co-pack partners. Over the forecast horizon, pharmaceutical outsourcing is therefore expected to narrow the historical gap with food in overall contribution to the United States contract packaging market.
By Service Offering: Fulfillment Integration Drives Growth
Filling and assembly generated 36.12% of total 2025 revenue, yet fulfillment and logistics services are on track for a 12.70% CAGR, reflecting a pivot toward end-to-end execution models. Omnichannel brands want a single partner for pack, pick, and last-mile coordination, and they reward suppliers that can link packaging data to inventory systems in real time. The shift also helps co-packers defend margins by adding high-value distribution tasks that rely on systems integration rather than manual labor.
Formulation and blending remain niche but vital for nutraceutical powders and drink mixes, whereas packaging and labeling services face workflow disruption from the FDA’s forthcoming nutrition icon, increasing the importance of late-stage digital print. Veritiv’s USD 60 million acquisition of AmeriPac highlights how fulfillment capability has become a meaningful differentiator inside the United States contract packaging market.
By Material Substrate: Sustainability Reshapes Material Choices
Plastics retained 54.92% revenue share in 2025, yet biodegradable and bio-based substrates are expanding at 12.97% CAGR as consumer goods companies race to hit 2027 waste-reduction pledges. Brands specify sugar-cane, seaweed, and mushroom-based materials not only for environmental credentials but also for brand storytelling. The United States contract packaging market size attached to sustainable pharma packs alone is projected to grow at more than twice the rate of conventional plastics.
Paper and paperboard absorb e-commerce volume because retailers prefer curbside-recyclable solutions that match their sustainability scorecards, while metals maintain relevance in aseptic food and aerosol formats. Glass continues to dominate specialty injection vials where chemical inertness is mandatory, even if weight limits its use in direct-to-consumer shipping. Ongoing innovations in barrier coatings are expected to improve oxygen and moisture resistance of compostable films, widening adoption across the United States contract packaging market.
By Automation Level: Robotics Integration Accelerates
Semi-automated lines still control 32.12% of 2025 revenue, but robotics-integrated systems are rising fastest at 13.70% CAGR, a trend fueled by labor scarcity and stringent quality metrics in pharmaceuticals. Machine vision now inspects fill heights on every vial and rejects variances in real time, supporting zero-defect pledges demanded by drug sponsors. Small-batch changeovers executed through cobots reduce downtime for e-commerce SKUs, improving overall equipment effectiveness.
Manual operations linger in hand-crafted personal-care kits and high-mix promotional packs, where the economics of robotics remain unattractive. Fully automated high-speed lines dominate beverage can and PET bottle filling, but even these plants increasingly retrofit collaborative robots for palletizing tasks. The measurable productivity and traceability gains from automation validate capital plans and strengthen the long-term competitiveness of the United States contract packaging market.
Geography Analysis
The Northeast retains the highest concentration of pharmaceutical contract packaging plants, leveraging legacy proximity to large drug developers and a dense network of cleanroom component suppliers. FDA compliance expertise and a skilled workforce give the region a structural advantage, but its growth rate lags warmer states due to higher real estate and energy costs. The Southeast, led by North Carolina, Georgia, and Florida, is now the fastest-expanding territory in the United States contract packaging market, propelled by multi-billion-dollar biologics and injectables investments from Novo Nordisk, Eli Lilly, and Gerresheimer. Workforce-training partnerships with community colleges improve talent pipelines, reducing one of the historical bottlenecks for high-spec pharmaceutical lines.
Midwestern states continue to dominate food and beverage co-packing because of their established processing plants and central logistics corridors. However, aging facilities face mounting cap-ex requirements to accommodate robotics and sustainable substrates, prompting some operators to seek joint ventures for capital infusion. Rising cold-chain costs particularly affect dairy and ready-meal contract packagers, nudging them toward regional micro-fulfillment models that shorten delivery distances.
On the West Coast, California’s stringent recycled-content mandates accelerate adoption of alternative materials, positioning the region as a test bed for compostable and bio-based innovations. The technology sector’s need for static-safe and temperature-controlled electronics packaging further diversifies regional demand. Meanwhile, the South and Southwest benefit from the CHIPS Act and federal infrastructure funds, drawing global electronics and food brands to build nearshore assembly hubs. Texas and Arizona packaging vendors report record quoting activity for 2025 production slots, confirming the broadening geographic reach of the United States contract packaging market.
Regulatory Landscape
The United States contract packaging market operates under overlapping federal rules for labeling, safety, and quality across end uses. For drugs, FDA current good manufacturing practice requirements (21 CFR Part 211) drive validation, documentation, and change-control expectations across packaging and labeling operations, while quality ownership remains with the drug product owner. This structure reinforces the use of written Quality Agreements to define responsibilities in contract manufacturing arrangements. For consumer commodities, the Fair Packaging and Labeling Act framework (administered by FDA and FTC depending on commodity) anchors core label elements such as identity, net quantity, and responsible party information, shaping artwork control and late-stage labeling services.
Beyond FDA and FTC, several specialized regimes affect packaging specifications and supplier qualification. The Consumer Product Safety Commission enforces the Poison Prevention Packaging Act requirements for child-resistant packaging for designated hazardous household substances, which influences closure systems and testing protocols for select categories. Federal procurement and defense supply chains add another compliance layer through Defense Logistics Agency packaging and marking guidance and related standards references, including packaging and marking requirements tied to defense procurement that can trigger supply discrepancy reporting and payment holds when nonconforming. This has pushed some contract packagers to build dedicated government-compliant packaging processes and inspection workflows.
Value Chain Analysis
The value chain starts with brand owners and product sponsors (food, beverage, pharmaceutical, personal care, and other CPG segments) that set specifications, forecasts, and compliance requirements. It then flows to contract packagers and contract manufacturers that execute formulation and blending (where applicable), filling and assembly, packaging and labeling, and increasingly fulfillment and logistics. Upstream inputs include packaging substrates (plastics, paper and paperboard, glass, metals, and biodegradable/bio-based materials), closures and components, inks and labels, and packaging machinery and automation suppliers that support high-mix changeovers and inspection. Compliance and quality systems run across the chain, especially for regulated products where CGMP-aligned documentation, traceability, and release processes influence line design and operating procedures.
Execution typically moves from inbound material receipt and verification to line changeover, pack operations, quality checks, serialization and label control (where required), case packing and palletizing, and outbound distribution to retail, e-commerce nodes, or customer DCs. In 2024, reported bottlenecks clustered around processing, primary packaging, and secondary packaging steps, driven by downtime from changeovers and equipment issues. As e-commerce and sustainability requirements increase SKU complexity and material variability, digital tooling has become more visible in sourcing and coordination, including industry platforms such as the Contract Packaging Association's CoPack Connect RFQ marketplace launched in June 2026 to connect brand requirements with contract packaging and manufacturing providers.
Competitive Landscape
Competition remains moderately fragmented. Catalent’s pending acquisition by Novo Holdings exemplifies the consolidation logic: large buyers seek advanced sterile capacity, global regulatory credentials, and digital quality systems that take years to replicate organically. Financial sponsors continue to acquire mid-size co-packers and invest in robotics integration, hoping to unlock multiple expansion through higher utilization and bundled fulfillment services.
Technology capability is becoming the prime axis of differentiation. Providers deploying AI-driven quality analytics offer sub-2-sigma defect rates, a threshold that wins long-term contracts with pharmaceutical innovators. Automation also feeds sustainability targets by lowering rework and waste, reinforcing the business case for capital-heavy players. Smaller regional firms defend share through flexible scheduling, low minimum order quantities, and proximity to niche customers, but they face rising pressure to finance robotics and compliance upgrades to stay relevant in the United States contract packaging market.
Strategic alliances extend beyond acquisitions. Thermo Fisher’s management has signaled that the Catalent transaction will unlock network optimization synergies by spreading fill-finish volumes across complementary sites, illustrating how integrated footprints create customer stickiness. Veritiv’s 2024 purchase of AmeriPac added omnichannel fulfillment to its packaging distribution platform, demonstrating that downstream logistics can be a strong adjacency for co-packers. Emerging disruptors are likewise pairing automation with regional footprints to win reshoring programs, supporting a dynamic yet fragmented competitive field.
United States Contract Packaging Industry Leaders
Aaron Thomas Company
Multipack Solutions LLC
Pharma Tech Industries
Reed-Lane Inc.
Sharp Packaging Services
- *Disclaimer: Major Players sorted in no particular order

Market Opportunities and Future Outlook
Regulatory-driven packaging redesign and data readiness are creating near-term whitespace for providers that combine packaging execution with compliance support. The FDA's proposed front-of-pack nutrition icon initiative referenced in the market overview, alongside core US labeling requirements under FDA/FTC frameworks, increases demand for artwork management, label control, and late-stage digital print workflows that can support parallel SKU rollouts without service disruption. For food producers, FSMA Section 204 traceability requirements with enforcement effective July 20, 2028 elevate the value of contract packagers that can capture and exchange critical tracking data as part of packaging and fulfillment operations, especially for brands seeking standardized processes across multiple co-pack sites.
Sustainability compliance and reporting are another active opportunity area as requirements fragment at the state level. Seven states have enacted packaging extended producer responsibility laws (California, Colorado, Maine, Maryland, Minnesota, Oregon, and Washington), and programs are moving into operational reporting milestones such as the Circular Action Alliance deadline on May 31, 2026 for 2025 packaging data. This raises the need for auditable material bills of materials and packaging-data governance. Meanwhile, state restrictions such as California SB 343 limits on recyclability claims (effective October 4, 2026) and Maine's PFAS restrictions for certain food-contact packaging (beginning May 25, 2026) accelerate material transitions that can require requalification and equipment adjustments. That dynamic supports project-based demand for contract packagers with material science capability, access to compliant substrate suppliers, and the capital base to adapt lines for PCR and mono-material structures.
Recent Industry Developments
- June 2026: The Contract Packaging Association launched CoPack Connect, an AI-driven RFQ marketplace designed to match brand requirements with contract packaging and contract manufacturing providers. The platform formalizes sourcing and quotation workflows that were often relationship-driven and fragmented, and it increases visibility for qualified mid-sized co-packers competing for national accounts.
- June 2025: Vetter initiated construction activity tied to its EUR 1.5 billion investment plan, including a new Des Plaines, Illinois site intended to expand capacity for injectable-related manufacturing and associated packaging activities. The move adds high-spec capacity in a key US pharma corridor and raises competitive pressure for contract packagers supporting sterile and injectable supply chains.
- June 2024: Novo Nordisk announced a USD 4.1 billion investment in a new fill-finish manufacturing facility in Clayton, North Carolina, adding 1.4 million square feet of production space and creating 1,000 jobs to support GLP-1 injectables. The project strengthens the Southeast as a growth corridor for regulated packaging and labeling ecosystems that serve high-volume injectable programs.


Research Methodology Framework and Report Scope
Market Definition and Coverage
For this study, the US contract packaging market is defined as the revenue earned by third-party providers that package products on behalf of brand owners and manufacturers, including outsourced primary, secondary, and related value-added packaging work done within the United States.
Scope exclusions: We exclude in-house packaging performed fully inside a brand owner or manufacturer facility when no third-party packaging service revenue is involved.
Segmentation Overview
- By Packaging Type
- Primary
- Secondary
- Tertiary
- By End-user Industry
- Food
- Beverage
- Pharmaceutical
- Home and Personal Care
- Automotive
- Electronics and High-tech
- Pet Food
- Other End-user Industry
- By Service Offering
- Formulation and Blending
- Filling and Assembly
- Packaging and Labeling
- Fulfillment and Logistics
- By Material Substrate
- Paper and Paperboard
- Plastics
- Metals
- Glass
- Biodegradable/Bio-based
- By Automation Level
- Manual
- Semi-automated
- Fully Automated
- Robotics-integrated
Data Sources, Market Sizing, and Validation
Desk Research
Desk work starts by grounding the market in visible activity levels, where we can tie demand back to what gets produced, shipped, and regulated in the US. Public sources such as the US Census Bureau (manufacturing and business patterns), Bureau of Labor Statistics (wages and staffing signals), US International Trade Commission trade data, and FDA packaging and labeling guidance help frame what packaging work is being outsourced and why.
Next, we review company filings, investor presentations, association websites, and reputed press to map service coverage, customer industries, and pricing direction in a practical way. When needed, we also use paid database subscriptions for company financials and intelligence, plus an import-export shipment-level database and a patent database to sanity-check capacity additions and technology shifts that can affect automation and throughput. The sources listed here are illustrative, and many other public and paid references were used to collect, cross-check, and clarify specific data points.
Primary Interviews and Surveys
Primary work focuses on how outsourcing decisions are made and priced, since contract packaging demand is linked to customer production plans and service mix. We speak with packaging service providers, packaging equipment and material stakeholders, and buyers from end-user industries such as food, beverage, personal care, and pharmaceuticals across major US manufacturing and consumption corridors. We then use these inputs to confirm utilization patterns, typical project sizes, and realistic price movement assumptions.
Distribution of primary research fieldwork respondents
| Company type | Respondent position |
|---|---|
| Top tier: 27% | CXOs: 18% |
| Mid tier: 55% | Functional/Unit leaders: 39% |
| Smaller Players: 18% | Managers: 43% |
Market-Sizing & Forecasting
Sizing is built using a top-down approach, where US packaging demand is reconstructed from end-use production levels and outsourcing penetration, then converted to value using service mix and price levels that reflect contract packaging realities. To keep totals realistic, we corroborate the outputs with selective bottom-up checks, such as sampling provider revenue ranges from public disclosures, cross-checking typical line throughput assumptions, and using sampled ASP-by-service multiplied by estimated volumes where project-level information is available.
Key model inputs include the share of packaging activity outsourced by end-use industry, the split between primary and secondary packaging work, automation adoption that changes line speeds and labor intensity, labor cost and availability signals that shift make-versus-buy decisions, and packaging material intensity that affects service pricing and rework. For forecasting, scenario analysis is used so the model can reflect different customer production paths and outsourcing behavior under stable demand versus faster SKU proliferation and promotion-driven repacks. Where smaller providers have limited disclosure, gaps are handled by applying interview-backed revenue-per-line and utilization bands, then stress-tested against independent industry activity signals.
Data Validation & Update Cycle
Validation is done by comparing the model output with independent checks, such as packaging service price movement, shifts in outsourced volumes reported by customers, and visible capacity or automation investments. When a variance looks unusual, we re-check the underlying drivers and then run a second-pass review by another analyst before sign-off.
Reports are refreshed annually, and interim updates are triggered when there are material events such as major expansions, M&A, or sudden changes in labor availability that can shift outsourcing intensity. Before delivery, we complete a final review pass so the client receives the most current view available at the time of publication.
Mordor Intelligence's United States Contract Packaging Market Size Measured Against Other Published Estimates
Published market sizes for US contract packaging can vary a lot, even for the same year, because authors do not always count the same services and they often use different pricing and growth assumptions. Differences also show up when one estimate leans heavily on broad packaging spend, while another anchors the number to outsourced service revenue actually earned by co-packers.
The main gap comes from whether adjacent packaging spend is blended in, where Mordor Intelligence counts only third-party contract packaging service revenue and avoids adding in-house packaging operations or the full value of packaging materials that are merely passed through. Other common drivers are how automation is treated in productivity and pricing, whether end-use demand is linked to US production versus consumption, and how often exchange-rate timing and input-cost assumptions get refreshed.
Benchmark comparison
| Source | Market Size | Gaps in Research Methodology |
|---|---|---|
| Mordor Intelligence | USD 25.50 B (2025) | |
| Industry Publisher A | USD 93.33 B (2025) | This estimate appears to reflect a broader spend pool, where packaging materials and wider packaging activities can be blended with service revenue, which inflates totals versus a service-fee-only view. |
| Industry Publisher B | USD 11.89 B (2025) | This figure likely uses a narrower service definition or limited coverage of service lines and end-use industries, and it may apply more conservative outsourcing penetration or price assumptions. |
The spread across the three values is mainly explained by what is counted and how outsourcing intensity is converted into dollars. By keeping the demand pool tied to outsourced packaging services, then checking the result against provider revenue signals and operating assumptions, the model stays traceable to inputs that a user can follow and replicate.


Key Questions Answered in the Report
What is the current size of the US contract packaging market?
The US contract packaging market size is USD 27.78 billion in 2026 and is projected to grow steadily at a 8.96% CAGR to reach USD 42.64 billion by 2031.
Which segment is growing fastest within the market?
Pharmaceutical contract packaging is expanding at a 13.74% CAGR, outpacing all other end-user industries as drug makers outsource complex fill-finish and labeling tasks.
Why are biodegradable materials gaining traction?
State regulations on recycled content, combined with corporate sustainability goals, are pushing brands toward bio-based and compostable substrates, a trend that is driving a 12.97% CAGR for these materials.
How is automation affecting the industry’s cost structure?
Robotics-integrated systems reduce labor reliance, improve quality control, and can lower water and energy consumption, although they require significant upfront capital investment.
What impact will the FDA’s front-of-pack labeling rule have?
The rule will create a concentrated relabeling surge before the 2028 compliance deadline, representing an estimated USD 3.2 billion opportunity for packagers with scalable digital print and regulatory expertise.
How fragmented is the competitive landscape?
The market is moderately fragmented; the top ten providers control roughly half of total revenue, while numerous regional specialists compete on flexibility and proximity.
Page last updated on:


 Your data is secure and never sold or shared.


