
Market Overview
| Study Period | 2020 - 2031 |
|---|---|
| Forecast Data Period | 2026 - 2031 |
| Base Year Market Size (2025) | USD 3.48 Billion |
| Market Size (2026) | USD 3.71 Billion |
| Market Size (2031) | USD 5.13 Billion |
| Growth Rate (2026 - 2031) | 6.66 % |
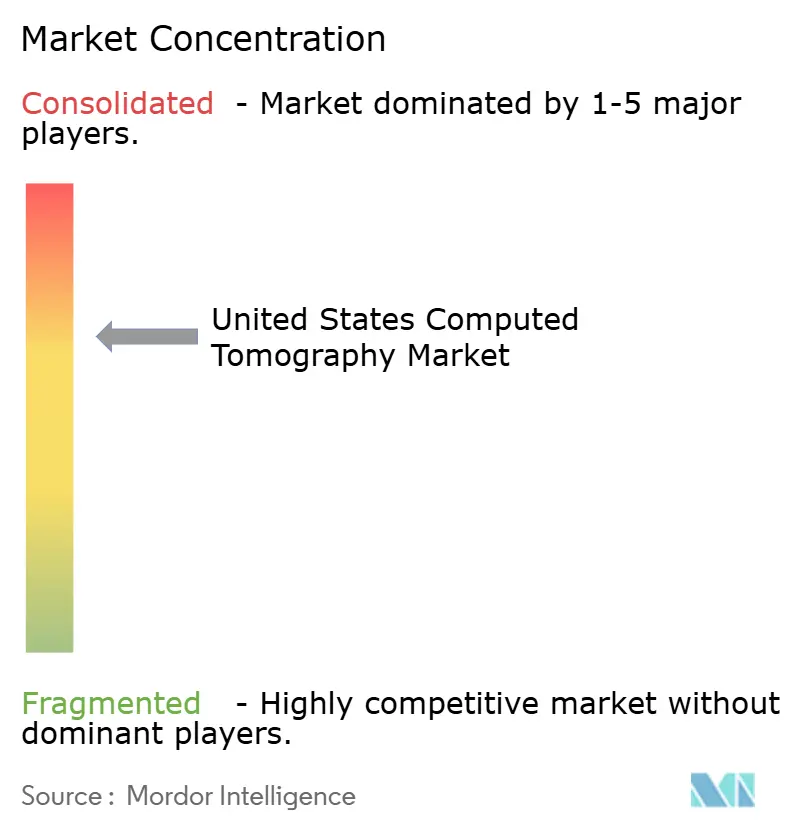
| Market Concentration | Medium |
Major Players *Disclaimer: Major Players sorted in no particular order Image © Mordor Intelligence. Reuse requires attribution under CC BY 4.0. | |
United States Computed Tomography Market Analysis by Mordor Intelligence
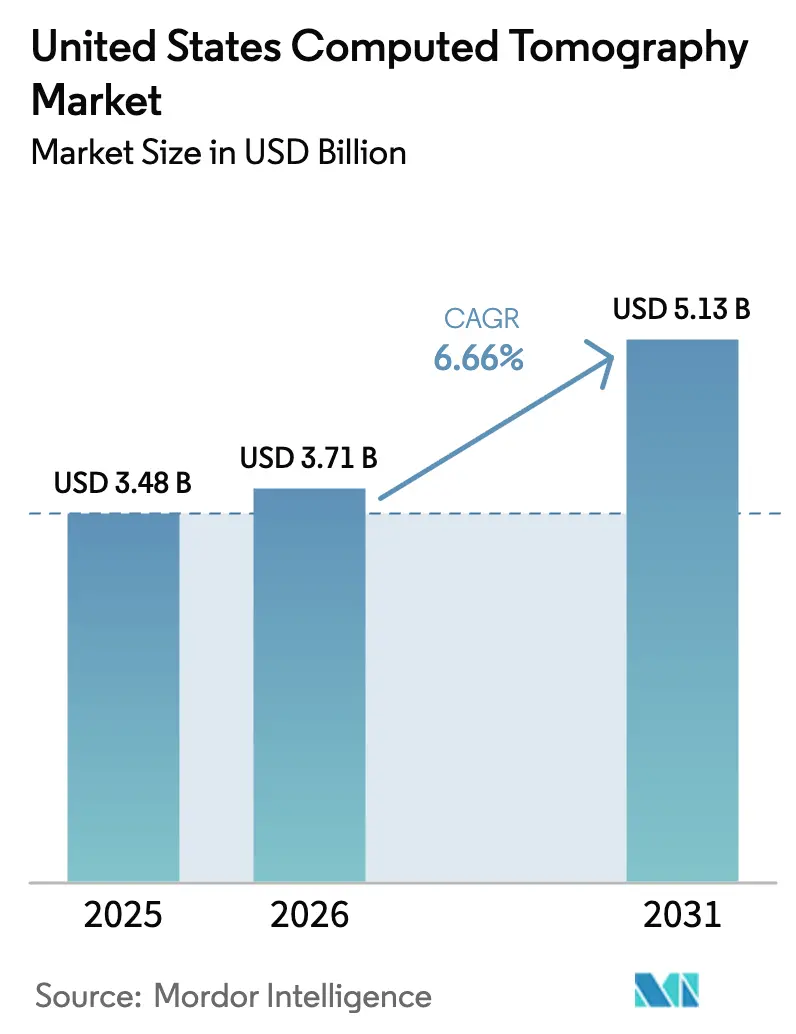
The United States computed tomography market size is expected to grow from USD 3.48 billion in 2025 to USD 3.71 billion in 2026 and is forecast to reach USD 5.13 billion by 2031 at 6.66% CAGR over 2026-2031. A sharp rise in multimorbidity, continuous breakthroughs in detector design, and swift outpatient migration are combining to elevate scanner utilization across hospitals and freestanding imaging centers [1]. Photon-counting platforms are moving from pilot deployments to routine service, while mobile units are becoming integral to trauma and critical-care workflows. Competitive intensity is climbing as original-equipment manufacturers embed artificial intelligence in scanners and reporting software to offset staff shortages and reimbursement pressures. Providers are also pursuing regional growth in the Sun Belt and Mountain West, where population inflows of older adults are heightening demand for advanced cardiac and oncologic imaging.
Key Report Takeaways
- By product type, high-slice systems led with 35.12% of the computed tomography market share in 2025, whereas medium-slice systems are poised for the fastest expansion at 7.53% CAGR through 2031.
- By application, oncology dominated with 33.05% revenue share in 2025; neurology is projected to rise at a 7.44% CAGR to 2031.
- By mobility, fixed platforms accounted for 65.70% of the computed tomography market size in 2025, yet mobile systems are advancing at a 7.46% CAGR.
- By end user, hospitals held 48.60% of the computed tomography market size in 2025, while diagnostic imaging centers are set for a 7.61% CAGR through 2031.
Note: Market size and forecast figures in this report are generated using Mordor Intelligence’s proprietary estimation framework, updated with the latest available data and insights as of 2026.
Market Trends and Insights
Drivers Impact Analysis of United States Computed Tomography Market*
| Driver | (~) % Impact on CAGR Forecast | Geographic Relevance | Impact Timeline |
|---|---|---|---|
| Rising prevalence of chronic diseases | +1.8% | Global, concentrated in aging metropolitan areas | Long term (≥ 4 years) |
| Growing geriatric population | +1.5% | National, with early gains in Sun Belt states | Long term (≥ 4 years) |
| Continuous technological advancements in CT | +1.2% | National, led by academic medical centers | Medium term (2-4 years) |
| Expanded CMS reimbursement for low-dose lung cancer screening | +0.9% | National, particularly rural and underserved areas | Short term (≤ 2 years) |
| Adoption of mobile CT in outpatient & trauma settings | +0.7% | Regional, focused on emergency departments and ASCs | Medium term (2-4 years) |
| Rapid AI-based workflow & image-quality upgrades | +0.6% | National, early adoption in large health systems | Short term (≤ 2 years) |
| Source: Mordor Intelligence | |||
Rising Prevalence of Chronic Diseases Drives Imaging Demand
Cardiovascular disease is projected to affect 45 million U.S. adults by 2050, and hypertension prevalence is forecast to climb from 51.2% in 2020 to 61.0% in 2050. Parallel increases in obesity, depression, and hyperlipidemia have lifted multimorbidity from 52.5% to 59.5% among younger adults between 2013 and 2023. Greater clinical complexity translates into higher examination volumes; CT utilization is expected to rise 25.1% through 2055 [2]. Hospitals are expanding cardiac CT programs in anticipation of a 175% surge in procedures per site by 2030. Medicare’s decision to cover virtual CT colonography is another signal that policymakers see preventive imaging as a cost-saving strategy.
Growing Geriatric Population Accelerates Advanced Imaging Adoption
Adults aged 65+ represent the fastest-growing cohort and prefer outpatient settings that offer faster appointments and easier parking. Hospital spending rose 10.4% in 2023 due in part to geriatric diagnostic complexity. Vizient projects a 13% advance in outpatient advanced imaging volumes over the next decade, led by CT and PET. The shift favors the computed tomography market because ambulatory centers often adopt mid-tier scanners that combine cardiac capability with lower capital cost. Workforce attrition complicates this growth: male radiologists face a 13.5% exit rate, intensifying staffing gaps.
Continuous Technological Advancements Transform Clinical Workflows
Photon-counting devices such as Siemens NAEOTOM Alpha.Prime provide 0.2 mm spatial resolution and spectral data in a single, radiation-efficient acquisition [3]. Ten-year economic models show savings of USD 794.5 per patient due to fewer secondary tests. Northwestern Medicine reported a 15.5% gain in report throughput after integrating generative AI for dictation and decision support. The FDA has green-lit more than 750 radiology-focused AI tools, signaling regulatory comfort with the technology.
Expanded CMS Reimbursement Enhances Access to Preventive Screening
Medicare now reimburses AI-enabled coronary plaque quantification for symptomatic patients with no known disease, broadening access to coronary CT angiography. Lung screening eligibility moved to ages 50-77 and removed patient cost-sharing. CMS estimates these changes will avert 13,982 cancers among beneficiaries annually. Doubling of coronary CTA reimbursement rates further stimulates equipment upgrades at outpatient sites.
Restraints Impact Analysis of United States Computed Tomography Market*
| Restraint | (~) % Impact on CAGR Forecast | Geographic Relevance | Impact Timeline |
|---|---|---|---|
| High equipment acquisition & maintenance costs | -1.1% | National, acute in rural and community hospitals | Long term (≥ 4 years) |
| Stringent FDA regulatory pathway & 510(k) backlog | -0.8% | National, affecting all market participants | Medium term (2-4 years) |
| Radiation-dose related patient safety concerns | -0.6% | National, heightened in pediatric centers | Medium term (2-4 years) |
| Radiology workforce shortages constraining scanner utilization | -0.9% | National, severe in rural and secondary markets | Long term (≥ 4 years) |
| Source: Mordor Intelligence | |||
High Equipment Acquisition Costs Constrain Market Penetration
Upfront scanner prices exceeding USD 1 million strain rural balance sheets; 20% of Americans live in counties now lacking local CT access after hospital closures. Managed service agreements and cash-flow-neutral financing have gained traction as providers seek to match payments with revenue cycles. Siemens’ SOMATOM Pro.Pulse reduces energy draw by 20%, lowering total cost for small facilities.
Radiology Workforce Shortages Limit Scanner Utilization Potential
There are more than 1,400 open radiologist positions nationwide, and CT technologist vacancies have reached 18.1%, up from 6.2% three years earlier. The American College of Radiology warns that yearly demand is rising 3-5% despite static residency caps set in 1997. Providers turn to teleradiology, projected to expand from USD 4.4 billion in 2024 to USD 6.7 billion by 2027, to cope with reading backlogs.
*Our forecasts treat driver/restraint impacts as directional, not additive. The impact forecasts reflect baseline growth, mix effects, and variable interactions.
United States Computed Tomography Market Segment Analysis
By Product Type:
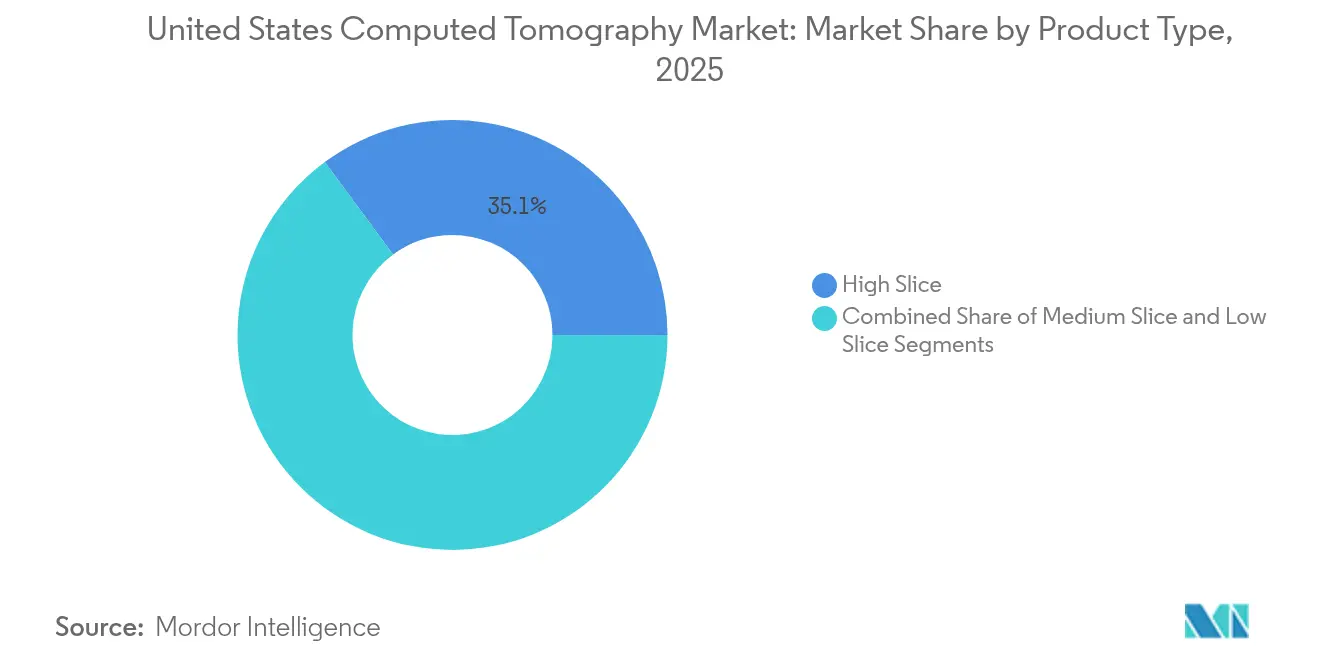
Medium-Slice Systems Gain MomentumHigh-slice platforms held 35.12% of the computed tomography market share in 2025, reflecting their dominance in cardiac, trauma, and oncology imaging where rapid temporal resolution is critical. Medium-slice systems are forecast to deliver a 7.53% CAGR and are increasingly selected by outpatient centers seeking cardiac capability without the cost of 256-slice flagships. GE Healthcare’s Revolution Vibe offers single-heartbeat imaging at a mid-tier price, illustrating the market’s pivot toward value-centric upgrades. Low-slice scanners remain relevant for pediatric follow-up and basic trauma studies when dose minimization is paramount. Constrained capital budgets, especially in non-urban facilities, favor mid-range replacements, encouraging suppliers to expand configurable options and AI bundles.
An installed-base shift is under way as providers retire 16-slice workhorses introduced in the early 2000s. Refurbishment programs target safety-net hospitals, whereas private equity-backed imaging chains prefer new installations to capture capacity incentives from payers. The computed tomography market benefits as medium configurations deliver robust ROI in outpatient corridors competing with hospital-owned centers. Vendor neutrality in post-processing has also reduced lock-in, further supporting mid-range adoption. Overall, budget alignment and throughput requirements make medium-slice technology the segment to watch through 2031.

By Application:
Neurology Workflows Accelerate with AIOncology captured 33.05% of the computed tomography market size in 2025, supported by expanding immunotherapy protocols that require serial monitoring. Neurology, however, will be the fastest climber at 7.44% CAGR because AI triage tools cut scan-to-treatment time for stroke. RapidAI’s Lumina 3D slashes head-and-neck CTA reconstructions from hours to minutes, allowing technologists to move more patients per shift. Cardiovascular volumes also rise as CMS broadens coronary CTA reimbursement, prompting providers to install scanners with ≥128 slices for plaque analytics.
Photon-counting detectors are opening new musculoskeletal horizons by resolving trabecular microarchitecture, valuable in osteoporosis management. Emergency departments still rely on whole-body trauma protocols, yet dose-optimized iterative reconstruction helps comply with ALARA guidelines in pediatric workups. The net effect is a demand mix that encourages vendors to ship multipurpose scanners configurable per clinical service line.
By Mobility:
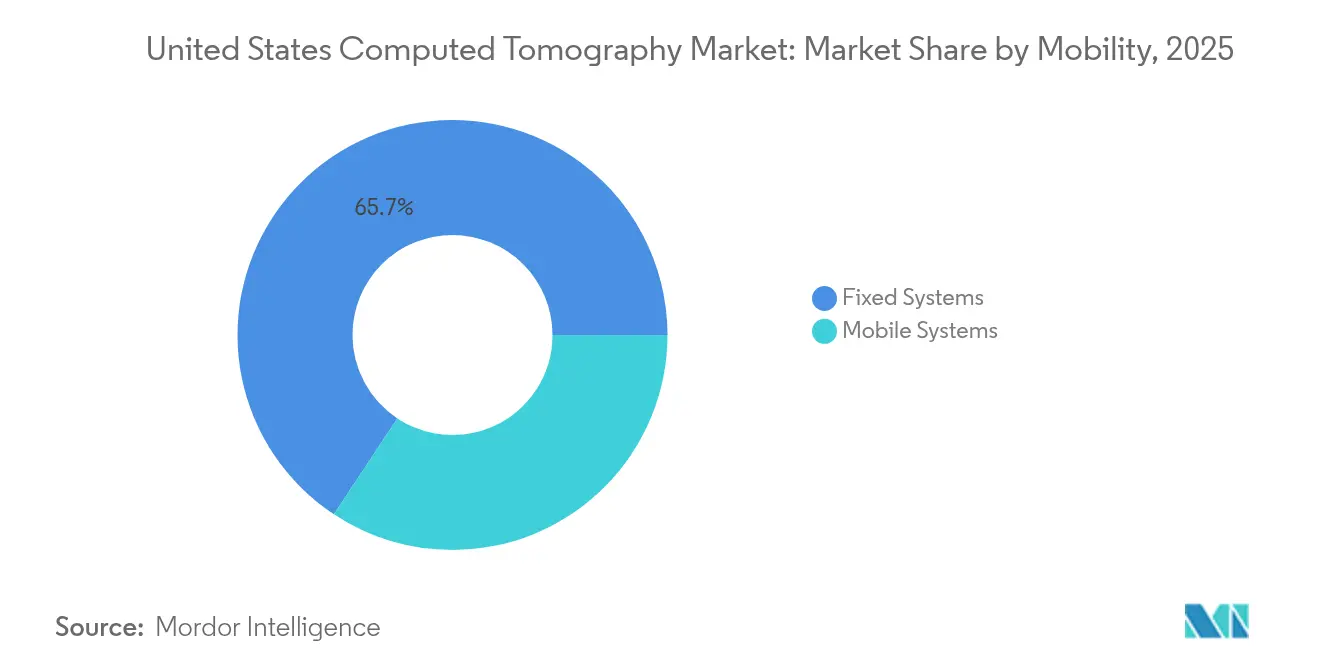
Point-of-Care Adoption ExpandsFixed rooms dominated with 65.70% share in 2025 because high-volume radiology departments rely on broad-bore gantries, power injectors, and fully shielded suites. Mobile systems are climbing 7.46% per year, aided by intensive care demand and rural outreach programs. Prospective trials show bedside head CT produces near-equivalent diagnostic accuracy for intracranial hemorrhage, which is pivotal in neuro-ICU environments. Manufacturers now emphasize battery life, wireless data upload, and compact footprints to navigate narrow hallways.
Mobile stroke units illustrate the growth vector: integrated CT lets paramedics confirm large-vessel occlusion curbside, shaving 30 minutes off door-to-needle time. During the COVID-19 pandemic, pop-up triage tents leveraged self-shielded mobile scanners to reduce cross-contamination risk. These successes persuaded many systems to retain mobile capacity permanently. Federal grants targeting critical-access hospitals further support deployments, broadening the computed tomography market footprint.
By End User:
Outpatient Imaging Centers Capture Market MomentumHospitals accounted for 48.60% of 2025 revenue owing to complex case mix and emergency demand. Diagnostic imaging centers will grow 7.61% annually as insurers steer routine studies away from high-cost inpatient sites. RadNet’s 21-center expansion and US Radiology Specialists’ plan for 12 new facilities underline this migration. Outpatient operators leverage Saturday scheduling and bundled cash prices to compete for self-pay and high-deductible volumes.
Ambulatory surgery centers add scanners to enable same-day lumbar CT myelograms or postoperative checks, reducing patient transfers. Urgent-care chains also seek compact scanners to shorten orthopedic workups. The computed tomography industry’s modular service contracts, which bundle AI reconstruction and teleradiology reporting, are making technology adoption easier for these lean enterprises.
Geography Analysis
The computed tomography market reveals stark regional contrasts. Large coastal academic hubs in California, Massachusetts, and New York lead adoption of photon-counting platforms due to research grants and complex patient populations. California’s market enjoys additional lift from GE Healthcare’s seven-year deal with Sutter Health covering 300 sites and 3.5 million patients. These agreements tie hardware replacement cycles to staff development programs, accelerating technology refresh
Sun Belt states are experiencing double-digit scanner growth as retirees flock to Arizona, Texas, and Florida. Cardiac CT capacity expansion is most pronounced in these markets because older patients present high coronary risk. Texas gained a boost when RadNet opened its Houston hub, signaling confidence in the region’s reimbursement environment. Certificate-of-need reform in Georgia and South Carolina is attracting new outpatient entrants, enhancing competition.
Rural America faces the opposite trend. One in five residents lives in a county lacking immediate CT access after recent hospital closures. Mobile fleets and teleradiology partnerships are plugging gaps, yet long drive times persist in parts of the Midwest and Appalachia. Federal infrastructure funds earmarked for critical-access hospitals should relieve some disparities, but capital cost remains a barrier. The computed tomography market size attributable to rural catchment areas therefore grows more slowly, although targeted grant programs may unlock latent demand over the forecast horizon.
Regulatory Landscape
In the United States, computed tomography (CT) systems are regulated by the FDA as Class II medical devices under 21 CFR 892.1750 (product code JAK), typically requiring a 510(k) premarket notification. In parallel, CT systems fall under FDA oversight for radiation-emitting electronic products via the Radiation Control for Health and Safety Act, so dose management and radiation safety labeling remain central to product changes and post-market expectations.
Manufacturers also commonly align with recognized consensus standards across the CT ecosystem, including IEC 60601-2-44 for CT equipment safety, NEMA XR 25-2019 (Dose Check), and NEMA DICOM (NEMA PS 3.1-3.20) for interoperability. Regulatory and trade actions can affect the installed base and the supply chain for advanced platforms. For example, on June 2, 2026, the US International Trade Commission issued a final determination prohibiting certain imported photon-counting CT image reconstruction modules from the US market, increasing compliance and sourcing scrutiny for high-end photon-counting configurations.
Competitive Landscape
The United States computed tomography market is moderately concentrated around five multinational vendors that combine equipment, software, and lifecycle services. GE Healthcare’s 2024 acquisition of MIM Software brings advanced contouring and fusion algorithms under its umbrella, positioning the company to offer an end-to-end oncology workflow. Siemens Healthineers is deploying USD 0.67 billion from its broader USD 27.38 billion MedTech fund specifically to extend photon-counting into mainstream price tiers. Canon Medical pursues a training-led strategy through its Cleveland academy, hoping to foster brand loyalty among technologists and biomeds.
Strategic partnerships with cloud and semiconductor firms are reshaping software roadmaps. GE is collaborating with NVIDIA to embed generative AI that automates protocol selection and dose optimization, a response to technologist scarcity. Philips emphasizes spectral CT for interventional guidance, leveraging its catheter portfolio for cross-selling opportunities. Disruptive entrants such as RapidAI carve a niche by integrating vendor-neutral AI that overlays on legacy scanners, threatening to commoditize proprietary workstation sales.
Rural market penetration remains an untapped battleground. Siemens introduces lower-power scanners that can run on community-hospital electrical infrastructure, while GE pilots mobile turnkey suites bundled with teleradiology. Pricing creativity, from subscription scanning models to outcome-based payments, is emerging as the primary lever for winning first-time buyers.
United States Computed Tomography Industry Leaders
-
Canon Medical Systems Corporation (Toshiba Corporation)
-
GE Healthcare
-
Koninklijke Philips NV
-
Siemens Healthineers AG
-
Fujifilm Holdings Corporation
- *Disclaimer: Major Players sorted in no particular order
United States Computed Tomography Market Companies Covered in this Report
- GE Healthcare
- Siemens Healthineers
- Koninklijke Philips
- Canon Medical Systems USA, Inc.
- FUJIFILM
- Carestream Health
- United Imaging Healthcare
- Samsung Neurologica Corp.
- Neusoft
- Planmeca Group (Planmed Oy)
- Koning
- Accuray
- Imris Deerfield Imaging
- Analogic
- CurveBeam
- Xoran Technologies
- Spectrum Dynamics Medical
- Epica Medical Innovations
- Animage
Market Opportunities and Future Outlook
Replacement demand and capability-driven upgrades remain key whitespace indicators in the United States, especially as providers retire older scanner generations and standardize protocol consistency across hospitals and outpatient imaging centers. Photon-counting CT is also a concrete commercialization vector: in March 2026, GE HealthCare received FDA clearance for its Photonova Spectra, broadening competitive choice alongside Siemens Healthineers offerings such as the NAEOTOM family already in US clinical use.
Workflow automation that addresses staffing constraints supports a second monetization path tied to scanner sales, software attachment, and service models. The FDA has cleared more than 750 radiology-focused AI tools (across imaging), and OEMs are increasingly bundling AI-driven workflow and reconstruction capabilities into CT platforms to support throughput in settings with technologist and radiologist shortages. Supply-chain and trade constraints are also shaping procurement approaches for photon-counting platforms, with the June 2, 2026 ITC action barring certain imported photon-counting CT image reconstruction modules acting as a compliance-driven opening for vendors with domestically accessible module sourcing, validated alternatives, or integrated architectures that reduce dependency on restricted components.
Recent Industry Developments in United States Computed Tomography Market
- June 2026: Siemens Healthineers unveiled the Somatom X.ceed, a single-source CT scanner featuring bundled AI-powered myExam Companion and myNeedle Companion for interventional guidance. The launch expands Siemens Healthineers interventional and diagnostic CT capabilities and strengthens its competitive positioning in the U.S. market through integrated AI workflow tools.
- March 2026: GE Healthcare Photonova Spectra photon-counting CT system receives U.S. FDA 510(k) clearance. The clearance accelerates photon-counting adoption in the U.S. market and positions GE at the high-end PCCT segment with its Deep Silicon detector technology, influencing pricing and workflow efficiencies.
- September 2025: Siemens Healthineers completed the first U.S. installation of the Naeotom Alpha.Pro dual-source photon-counting CT scanner. The installation introduces PCCT capability at scale in U.S. clinical sites and expands Siemens portfolios footprint, accelerating adoption in high-end CT imaging workflows.
United States Computed Tomography Market Report Scope and Research Methodology
Market Definition and Coverage
For this study, the market covers revenue generated in the United States from computed tomography systems used for clinical imaging, including new equipment sales and related upgrades sold as part of the CT platform value.
Scope exclusions: This sizing does not treat unrelated imaging modalities, general radiology IT, or non-CT interventional platforms as part of the computed tomography market.
Segments Covered in This Report
- By Product Type
- Low Slice
- Medium Slice
- High Slice
- By Application
- Oncology
- Neurology
- Cardiovascular
- Musculoskeletal
- Other Applications
- By Mobility
- Fixed Systems
- Mobile Systems
- By End User
- Hospitals
- Diagnostic Imaging Centers
- Others
Data Sources, Market Sizing, and Validation
Desk Research
Desk work was first used to set the market perimeter and gather objective signals linking CT demand to real care delivery in the United States. Public and official sources such as CDC health statistics, CMS coverage and payment schedules, FDA device databases, and AHRQ and NCHS utilization publications helped anchor how imaging volumes and patient mix tend to move over time.
We also reviewed annual reports and investor presentations, peer reviewed radiology journals, and association websites tied to imaging providers, since these sources often clarify technology adoption patterns and purchasing cycles. Where helpful, paid subscriptions for company financials and intelligence, patent databases, and a news and financials platform were used to cross-check launches and revenue direction without relying on a single narrative. The sources listed here are illustrative only, and many other documents were consulted for collection, cross-checking, and clarification.
Primary Interviews and Surveys
Primary interviews and structured surveys were run with hospital imaging leaders, outpatient imaging center operators, radiologists, and procurement and biomedical teams, since buying decisions and scanner utilization often sit with different roles in the United States. Since this is a United States title, conversations were spread across major states and care settings to confirm pricing, replacement timing, and how demand differs between emergency, oncology, and cardiac pathways.
Distribution of primary research fieldwork respondents
| Company type | Respondent position |
|---|---|
| Top tier: 32% | CXOs: 17% |
| Mid tier: 47% | Functional/Unit leaders: 36% |
| Smaller Players: 21% | Managers: 47% |
Market-Sizing & Forecasting
Market sizing was built using a top-down approach where procedure demand and installed-base direction are used to reconstruct CT equipment and upgrade spending, and then converted into annual revenue using realistic pricing ranges. To keep totals grounded, we also ran selective bottom-up checks using sampled average selling prices times unit shipments proxies, along with channel conversations on tender activity and replacement cycles.
Key model inputs included the pace of hospital versus outpatient migration, replacement timing by slice class, utilization growth tied to aging and chronic disease load, mix shifts toward advanced systems (including newer detector architectures), and observed price movement from contracting and rebate structures. Forecasts were produced using scenario analysis supported by a light multivariate regression view, where volume growth, mix upgrade rates, and pricing changes were moved together to avoid unrealistic step jumps. When bottom-up signals were incomplete, gaps were handled through conservative interpolation based on adjacent years and confirmed ranges from field checks, and then adjusted only after the full model was reconciled.
Data Validation & Update Cycle
Results were validated by comparing the modeled totals against independent indicators such as utilization direction, procurement cycle commentary, and visible upgrade adoption across care sites, and then checking whether the implied unit and price math stays reasonable. Outliers were flagged early, and assumptions were re-tested through follow-up calls when a variance could not be explained by mix, timing, or policy changes.
Before sign-off, the model is reviewed in steps so that inputs, calculations, and outputs are consistent across years and do not break basic logic checks. Reports are refreshed annually, and interim updates are made when material events change demand or pricing, after which a final analyst pass is completed close to delivery so clients receive an up-to-date view.
Mordor Intelligence's United States Computed Tomography Market Size Compared Against Other Published Estimates
Published market sizes for United States CT often look different even when firms are describing similar equipment, since the math depends on what is counted and how each firm handles price, timing, and upgrades. Differences usually come from whether the estimate follows systems only versus systems plus platform upgrades, how outpatient imaging is represented, and whether base years are aligned.
The main gap comes from scope, where Mordor Intelligence counts CT market value at the platform level (including upgrades sold with the CT system), while some published figures appear closer to scanner-only revenue and may apply a narrower price build that excludes common add-ons. Another driver is timing, since some sources anchor to 2022 or 2023 and then extend forward, which can understate recent mix shifts toward higher value configurations. Currency timing and refresh cadence also matter, since a model that is not re-checked after policy or purchasing cycle changes can drift away from real ordering behavior.
Benchmark comparison
| Source | Market Size | Gaps in Research Methodology |
|---|---|---|
| Mordor Intelligence | USD 3.48 B (2025) | |
| Industry Bulletin A | USD 1.45 B (2022) | Anchored to an earlier base year and framed as CT scanners, which can exclude common platform upgrades and under-capture higher value system mix in later years. |
| Sector Research Note B | USD 1.87 B (2023) | Uses a scanner-market lens with a 2023 base, which can narrow the priced scope and smooth over replacement spikes tied to large system refresh cycles. |
The spread across published values is largely explained by whether the estimate is scanner-only or platform-level, and by which year is used as the anchor for mix and pricing. By keeping assumptions tied to utilization direction, replacement timing, and realistic price bands, the approach stays repeatable and easier to audit when new demand signals appear.
Key Questions Answered in the Report
What is the current size of the United States computed tomography market?
The market stands at USD 3.71 billion in 2026 and is projected to reach USD 5.13 billion by 2031.
Which product segment is growing fastest in the computed tomography market?
Medium-slice scanners are expanding at a 7.53% CAGR due to their balance of cardiac capability and manageable capital cost.
Why are outpatient imaging centers attracting CT investments?
Insurers push routine scans to lower-cost sites, and operators gain patients through faster scheduling, driving a 7.61% CAGR for this end-user group.
How are mobile CT solutions impacting rural healthcare?
Mobile units supply point-of-care imaging where fixed installations are unaffordable, reducing transfer times and widening access.
What technology trend will most alter CT workflows by 2031?
Photon-counting detectors coupled with AI reconstruction will deliver higher spatial resolution at lower dose, enabling new cardiac and orthopedic applications.
How big is the workforce gap in U.S. radiology?
More than 1,400 radiologist positions remain unfilled, while CT technologist vacancies have reached 18.1%, encouraging adoption of AI and teleradiology.