
Market Overview
| Study Period | 2020 - 2031 |
|---|---|
| Forecast Data Period | 2026 - 2031 |
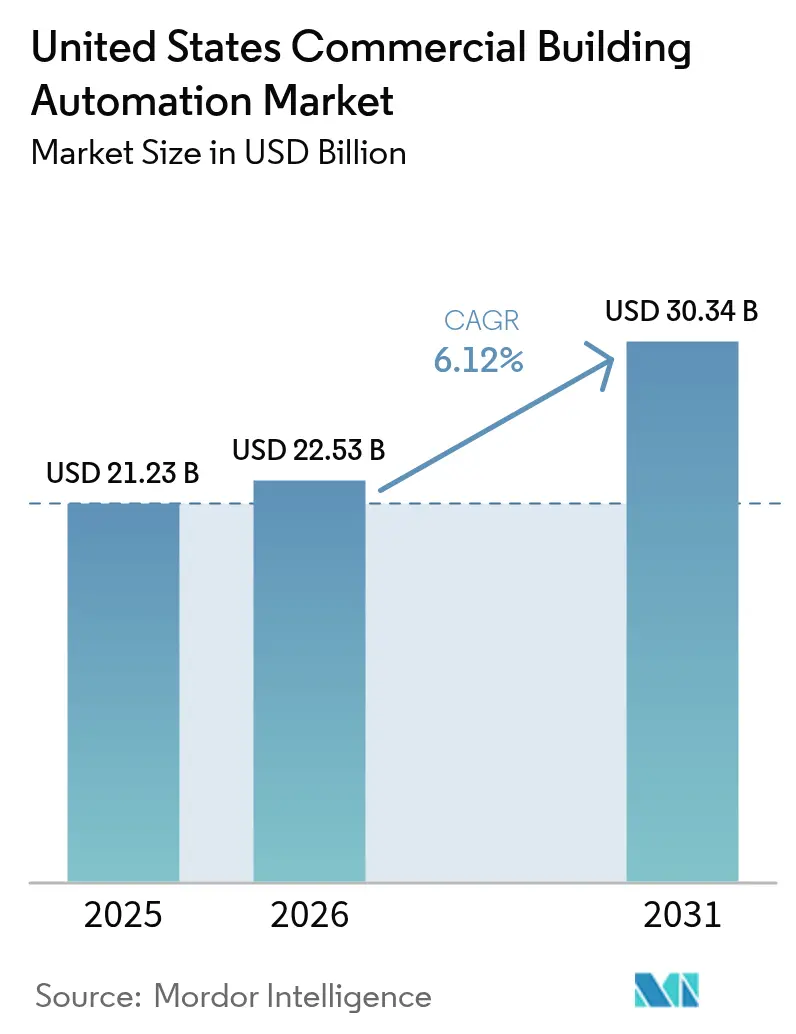
| Base Year Market Size (2025) | USD 21.23 Billion |
| Market Size (2026) | USD 22.53 Billion |
| Market Size (2031) | USD 30.34 Billion |
| Growth Rate (2026 - 2031) | 6.12% CAGR |
| Market Concentration | Medium |
Major Players *Disclaimer: Major Players sorted in no particular order Image © Mordor Intelligence. Reuse requires attribution under CC BY 4.0. | |
United States Commercial Building Automation Market Analysis by Mordor Intelligence
The United States commercial building automation market size is expected to grow from USD 21.23 billion in 2025 to USD 22.53 billion in 2026 and is forecast to reach USD 30.34 billion by 2031 at 6.12% CAGR over 2026-2031. Federal net-zero regulations, the Inflation Reduction Act's tax deductions, and corporate ESG mandates are driving demand for connected HVAC, lighting, and power-monitoring platforms that can surface real-time data and automate energy savings. The rapid convergence of open-source IoT sensors with cloud-native analytics is lowering system costs, while utility programs now pay up to USD 200 per kilowatt for automated load shedding in regions facing grid stress. Vendors are responding by embedding AI in controllers, expanding wireless protocol support, and packaging turnkey incentive-capture services that shrink payback windows for mid-market properties. Heightened cybersecurity scrutiny, together with skilled-labor shortages, temper adoption but have also pushed software providers into managed-service models that ease owner resource constraints.
Key Report Takeaways
- By product category, HVAC control systems held 40.92% of the United States' commercial building automation market share in 2025, while integrated building-management platforms are projected to grow at 7.22% CAGR through 2031.
- By building type, office facilities led with 35.01% revenue in 2025 in the United States commercial building automation market; mixed-use developments are projected to expand at 7.01% CAGR to 2031.
- By component, controllers and field devices accounted for a 38.08% share of the United States commercial building automation market size in 2025; however, software and analytics platforms are advancing at a 7.08% CAGR through 2031.
- By communication protocol, BACnet retained a 36.14% share in 2025 in the United States commercial building automation market, with Zigbee and other wireless options recording the fastest 7.06% CAGR to 2031.
Note: Market size and forecast figures in this report are generated using Mordor Intelligence’s proprietary estimation framework, updated with the latest available data and insights as of 2026.
United States Commercial Building Automation Market Trends and Insights
Drivers Impact Analysis*
| Driver | (~) % Impact on CAGR Forecast | Geographic Relevance | Impact Timeline |
|---|---|---|---|
| Federal and state net-zero / electrification mandates | +1.2% | National, with early gains in California, New York, Washington | Medium term (2-4 years) |
| Corporate ESG-driven demand for real-time energy data | +0.9% | National, concentrated in major metropolitan areas | Short term (≤ 2 years) |
| Inflation Reduction Act tax incentives for high-efficiency HVAC and controls | +0.8% | National, higher uptake in commercial-dense regions | Short term (≤ 2 years) |
| Hybrid-work shift requiring flexible space-utilization analytics | +0.7% | National, emphasis on office-heavy markets | Medium term (2-4 years) |
| Falling cost and interoperability of open-source IoT sensors / edge controllers | +0.6% | Global, accelerated adoption in retrofit markets | Long term (≥ 4 years) |
| Utility-sponsored demand-response monetisation for automated load-shedding | +0.5% | Regional, concentrated in California, Texas, Northeast | Medium term (2-4 years) |
| Source: Mordor Intelligence | |||
Federal and State Net-Zero Electrification Mandates
Federal performance standards compel buildings larger than 25,000 square feet to cut energy use 30% by 2030, pushing owners toward full-featured automation for compliance.[1]Office of Energy Efficiency & Renewable Energy, “Federal Building Performance Standard,” energy.gov California Title 24 and New York Local Law 97 add stricter carbon caps with penalties already in force, prompting rapid upgrades across government, education, and healthcare portfolios. Manual scheduling cannot reach 20–40% reduction thresholds, so connected HVAC, lighting, and plug-load controls have become default specifications in new leases. Vendors now bundle compliance dashboards that translate sensor data into audit-ready reports, shifting procurement decisions from cost-centric to mandate-driven. The ripple effect has expanded bid pipelines beyond early adopters to mainstream owners aiming to avoid fines and attract federal tenants.
Corporate ESG-Driven Demand for Real-Time Energy Data
New SEC climate disclosure rules require Fortune 500 firms to publish 15-minute Scope 2 emissions data, spurring a surge in sub-metering and cloud analytics.[2]U.S. Securities and Exchange Commission, “SEC Adopts Climate Disclosure Rules,” sec.gov Multi-tenant towers are wiring tenant-level meters so landlords can allocate costs accurately and supply ESG dashboards as a premium amenity. SaaS platforms that auto-populate disclosure templates command higher subscription fees while reducing manual reporting labor. Real-time transparency is also reshaping lease negotiations; tenants now insist on buildings capable of validating sustainability targets. In response, automation suppliers have partnered with ESG software vendors to integrate data pipelines that streamline compliance and unlock new recurring-revenue streams.
Inflation Reduction Act Tax Incentives for High-Efficiency HVAC and Controls
Section 179D now pays up to USD 5.00 per square foot for buildings achieving 50% energy savings versus ASHRAE 90.1 baselines, directly crediting automation investments.[3]Internal Revenue Service, “Inflation Reduction Act of 2022 Energy Incentives,” irs.gov Owners previously deterred by eight-year paybacks report net costs of USD 2–3 per square foot after incentives, cutting payback to three years. Because the credit rewards whole-building performance, integrated platforms coordinating HVAC, lighting, and plug loads enjoy a funding advantage over piecemeal retrofits. Vendors now market turnkey tax-capture services that pair design, commissioning, and documentation, accelerating board approvals and backlog conversion.
Hybrid-Work Shift Requiring Flexible Space-Utilization Analytics
Office utilization stabilizes at 60–70% of pre-2020 levels, prompting installation of occupancy sensors, mobile booking apps, and access-control integrations that adjust HVAC and lighting only where employees are present.[4]Johnson Controls, “Successful Building Outcomes Start with a Lifecycle Approach,” johnsoncontrols.com Predictive zoning cuts energy use by 15–25% while preserving comfort. Wireless protocols enable rapid reconfiguration as departments resize, lowering tenant churn risks. Corporations now cite automation-enabled flexibility among top three lease criteria, boosting adoption in Class A towers. The same analytic insights support space-right-sizing strategies, aligning real-estate costs with workforce patterns.
Restraints Impact Analysis*
| Restraint | (~) % Impact on CAGR Forecast | Geographic Relevance | Impact Timeline |
|---|---|---|---|
| Cyber-security liabilities and insurance exclusions for connected BAS | -0.8% | National, concentrated in high-risk sectors | Short term (≤ 2 years) |
| Fragmented legacy infrastructure → high integration cost | -1.1% | National, emphasis on older building stock | Medium term (2-4 years) |
| Skilled‐labour shortages in BAS commissioning and analytics | -0.6% | National, acute in coastal metropolitan areas | Medium term (2-4 years) |
| Unclear ROI for small-/mid-size commercial properties | -0.9% | National, pronounced in secondary markets | Long term (≥ 4 years) |
| Source: Mordor Intelligence | |||
Cyber-Security Liabilities and Insurance Exclusions for Connected BAS
40% of commercial property policies now exclude IoT-related losses, exposing owners to more than USD 1 million in potential breach costs, according to NAIC. Health-care and financial campuses, already subject to stringent data regulations, hesitate to expose operational technology to the public internet. Specialty cyber cover costs USD 0.50–1.00 per square foot annually, extending paybacks and delaying projects. Standards such as BACnet Secure Connect and NIST profiles remain in draft, leaving uncertainty over future compliance spending. Vendors answer with zero-trust architectures and managed security services, yet buyer caution persists.
Fragmented Legacy Infrastructure and High Integration Costs
Typical commercial properties house three to five discrete control systems installed over decades, and integration can consume 20–80% of a retrofit budget. Pneumatic or proprietary serial networks often require wholesale replacement, while skilled commissioning labor draws USD 80–120 per hour amid a 25% technician shortfall. Occupied-building work must be phased to avoid tenant disruption, adding 25–40% to costs. Proprietary protocols lock owners into single-vendor service contracts, inflating life-cycle expenses. The obstacle is most acute for buildings under 50,000 square feet, where limited economies of scale push payback beyond four years.
*Our forecasts treat driver/restraint impacts as directional, not additive. The impact forecasts reflect baseline growth, mix effects, and variable interactions.
Segment Analysis
By Product Type: HVAC Dominance Faces Platform Integration
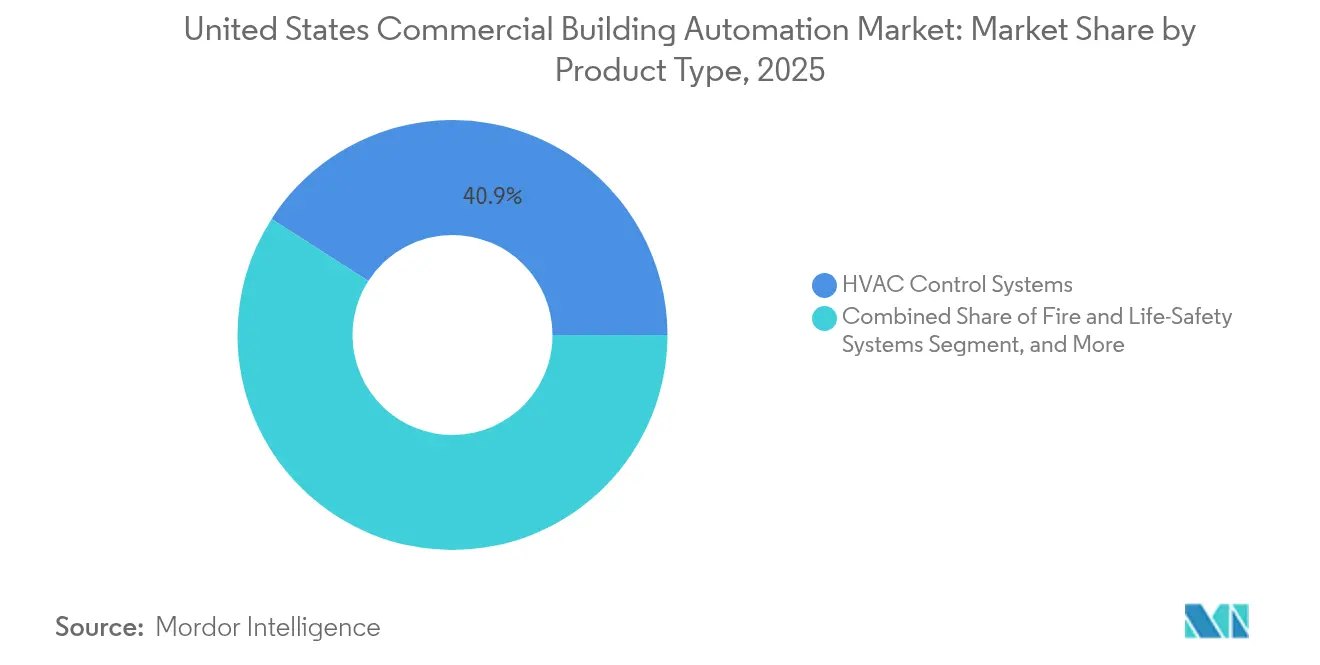
HVAC control systems accounted for 40.92% of 2025 revenue, driven by state performance standards that mandate the use of automated ventilation and temperature control. Yet, integrated building-management platforms are accelerating at a 7.22% CAGR, as owners pursue 30–50% whole-facility efficiency gains that are unattainable through siloed subsystems. This evolution positions platforms to capture a larger slice of the United States commercial building automation market over the forecast horizon.
Platform adoption also reflects a preference for unified ESG reporting that spans HVAC, lighting, security, and power. Vendors now offer cloud dashboards that aggregate data streams into single-pane-of-glass views, simplifying compliance and maintenance workflows. Interoperability with BACnet and wireless protocols ensures future-proofing, making integrated platforms attractive to investors valuing resilient asset performance.


By Building Type: Office Leadership Challenged by Mixed-Use Growth
Office properties retained 35.01% share of the United States commercial building automation market size in 2025, benefiting from corporate ESG disclosure obligations and hybrid-work analytics needs. Mixed-use complexes, however, are forecast to rise at 7.01% CAGR as urban planners combine retail, residential, and workspace functions that demand sophisticated zonal control.
Diverse occupancy patterns in mixed-use assets necessitate flexible automation that can adjust HVAC schedules by the hour. Landlords view such adaptability as a hedge against evolving tenant mixes, while municipalities encourage integrated developments through zoning incentives. Office owners continue to deploy advanced BAS to retain Class A designation, but competition from experience-driven mixed-use projects intensifies the technology race.
By Component: Hardware Foundation Supports Software Analytics Surge
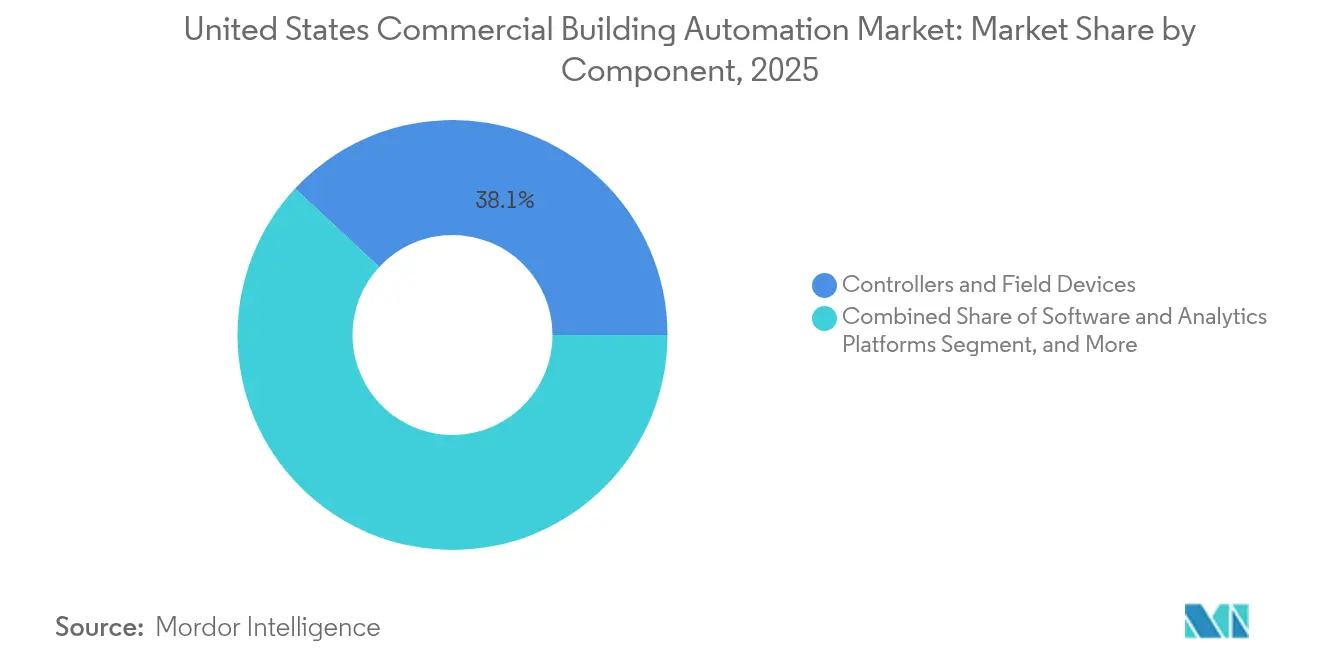
Controllers and field devices generated 38.08% of 2025 component revenue, underscoring the essential hardware backbone of the United States commercial building automation market. Software and analytics platforms, growing 7.08% CAGR, are expected to outpace hardware as AI-enabled optimization becomes the primary value driver.
Edge-to-cloud platforms transform terabytes of sensor data into actionable insights, reducing energy consumption by 15–25% and enabling the prediction of maintenance needs weeks in advance. Service revenues from integration, commissioning, and monitoring augment vendor margins, with labor shortages allowing premium pricing. The combination of low-cost sensors and high-value analytics is shifting procurement budgets from capital expenditure toward recurring software subscriptions.
By Communication Protocol: BACnet Standard Faces Wireless Protocol Challenge
BACnet held 36.14% of the United States commercial building automation market share in 2025, thanks to two decades of open-standard support across major OEMs. Wireless protocols, led by Zigbee and EnOcean, are growing at a 7.06% CAGR as energy-harvesting devices remove wiring constraints, thereby slashing installation labor.
Owners prefer open protocols to avoid vendor lock-in and enable competitive bidding. BACnet Secure Connect adds encrypted IP transport, improving cyber resilience. Gateways now translate Zigbee, EnOcean, and LoRaWAN traffic into BACnet objects, allowing mixed-vendor deployments that balance cost, range, and power needs. Wireless adoption is strongest in retrofits where running conduit is impractical or disruptive.
Geography Analysis
The Southern states command the largest share of the United States' commercial building automation market, driven by robust construction in Texas, Florida, and Georgia, as well as lucrative utility demand-response programs that monetize automated load shedding. Western and Northeastern markets closely trail, driven by stringent energy codes such as Title 24 and Local Law 97, which penalize inefficiency. The Midwest exhibits slower uptake due to milder regulatory pressure and lower electricity prices; however, it gains momentum from manufacturing facilities that require precise environmental control.
California’s solar-heavy grid incentivizes automation that can absorb renewable volatility, while New York’s carbon caps elevate compliance urgency. The Northeast endures the nation’s highest energy costs, which magnify the savings from peak-demand controls. Federal standards unify baseline requirements, but state rebates and penalties dictate the variability of payback.
Labor market imbalances influence regional implementation timelines. Coastal hubs face premium technician rates and longer scheduling queues, whereas interior states leverage lower labor costs but contend with fewer certified professionals. Data-center expansion in Virginia, North Carolina, and Texas drives demand for advanced cooling and power automation, ensuring uptime and ESG alignment.
Regulatory Landscape
Federal policy continues to tie building performance and electrification goals to measurable energy outcomes, reinforcing demand for connected controls and audit-ready reporting. The US Department of Energy (DOE) energy-efficiency rules and requirements for federal buildings rely on whole-building performance demonstrations aligned to ASHRAE 90.1 methods, while the statutory framework under the Energy Conservation and Production Act (ECPA) anchors federal building energy standards to measures that are technologically feasible and economically justified.
In April 2025, DOE issued a stay that moved the compliance date for the Clean Energy for New Federal Buildings and Major Renovations rule provisions (10 CFR parts 433 and 435, subpart B) to September 1, 2026. This creates a defined transition window for federal project teams and suppliers as DOE reviews implementation guidance, and it keeps attention on grid-interactive and advanced energy management capabilities highlighted in federal smart building and advanced building energy management programs (42 USC 17064 and 42 USC 17086), where data, control, and cybersecurity readiness are core requirements.
Value Chain Analysis
The value chain spans silicon and embedded components, sensors and controllers, BAS/BMS software platforms, and field services that deliver design, integration, commissioning, and lifecycle support. Component suppliers, including semiconductor and control hardware ecosystems, feed OEMs that package HVAC, lighting, power monitoring, and integrated platforms; distribution and delivery typically flow through OEM direct channels and authorized partners, with system integrators and mechanical/electrical contractors playing a central role in retrofits where three to five legacy subsystems often require interoperability bridging.
Services and integration are the main value-chain constraint and differentiator, since protocol translation, cybersecurity hardening, and occupied-building phasing can take a large share of retrofit scope. The chain is increasingly shaped by mission-critical and public-sector procurement patterns that prioritize scale, redundancy, and long-term maintenance, shown by the US Army Corps of Engineers award to Johnson Controls in July 2025 for installation and maintenance of Metasys building automation systems under a 36-month base contract with options, and by platform-layer productization such as Johnson Controls Metasys 15.0 launched in November 2025, which added higher device density and multi-server redundancy for critical facilities.
Competitive Landscape
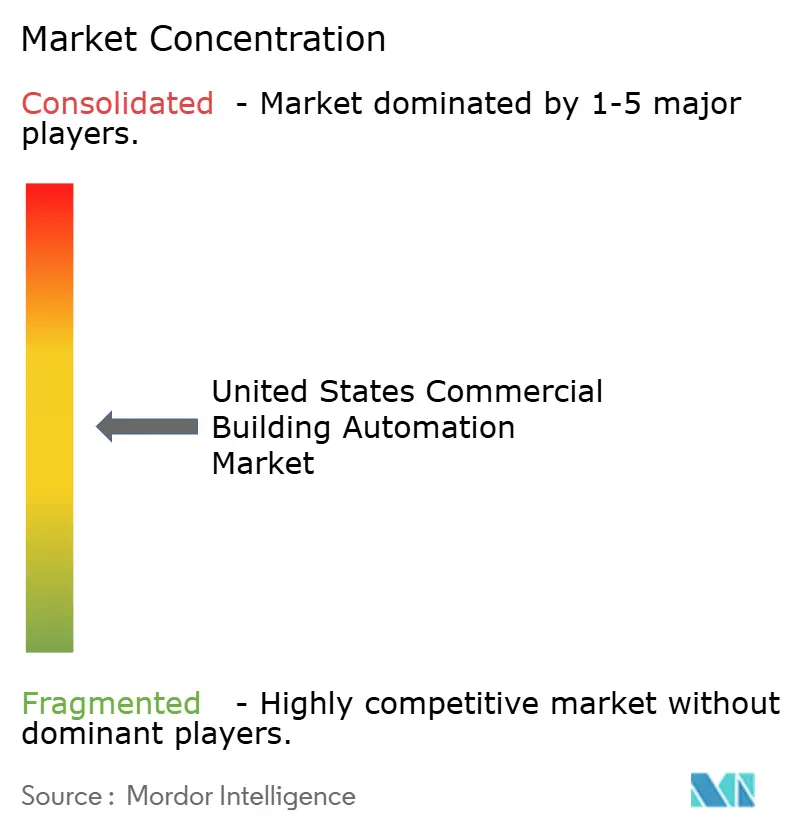
The commercial building automation market is moderately concentrated. Johnson Controls, Honeywell, and Schneider Electric leverage their installed bases, end-to-end portfolios, and partner ecosystems to maintain market share against software-centric entrants. These incumbents now embed AI engines, roll out subscription models, and pursue vertical acquisitions such as Johnson Controls’ 2025 purchase of Webeasy, which expands SME reach.
New entrants bypass hardware dominance by offering cloud analytics compatible with existing BACnet infrastructures. Start-ups emphasize rapid ROI through incentive capture and autonomous optimization, challenging incumbents on agility rather than breadth. Partnerships between hardware giants and niche software firms are proliferating as both sides seek to leverage complementary strengths.
Competition also revolves around cybersecurity credentials; vendors now market compliance with BACnet Secure Connect and ISO 27001 to satisfy insurance underwriters. Smaller buildings remain underserved due to integration costs, representing a whitespace where plug-and-play wireless solutions could unlock scale.
United States Commercial Building Automation Industry Leaders
ABB Ltd.
Siemens AG
Schneider Electric SE
Emerson Electric Co.
Texas Instruments Incorporated
- *Disclaimer: Major Players sorted in no particular order

Market Opportunities and Future Outlook
Retrofit-heavy commercial portfolios and compliance-driven performance reporting create whitespace for software-led layers that reduce integration friction, automate measurement and verification, and translate operational data into finance- and audit-ready outputs. The DOE stay that shifts Clean Energy for New Federal Buildings compliance provisions to September 1, 2026 gives federal stakeholders a clearer near-term planning horizon, while federal programs that promote smart building commissioning and advanced building-level energy management (42 USC 17064 and 42 USC 17086) support demand for grid-interactive control, data management, and cybersecurity-aligned deployments.
Interoperability and repeatable control deployment are a practical opportunity as the market moves from bespoke sequences to standardized, machine-readable control intent and semantic models. Ongoing ASHRAE standardization efforts, notably 223P for semantic data modeling and 231P for control description language, support vendor-neutral analytics and control portability, targeting one of the largest cost drivers in retrofits: custom integration and commissioning. In California, Title 24-related program activity around Guideline 36 sequence validation provides a visible proof point for standardized control libraries and automated validation workflows, highlighted by an April 2026 final report on automated validation of ASHRAE Guideline 36, reinforcing the case for scalable compliance-grade deployment and verification tooling in regulated and incentive-rich regions.
Recent Industry Developments
- June 2026: ABB launched ABB Ability BuildingPro Suites, positioning it as a modular software platform to unify building automation, HVAC, energy, IT, and IoT systems. The move reinforces the industry shift toward software-defined building operations and portfolio-scale data management, which can reduce fragmentation across multi-vendor sites.
- July 2025: Siemens partnered to integrate Building X with Microsoft Azure IoT Operations using open standards such as OPC UA to reduce integration workloads. This targets one of the highest-cost steps in the value chain, connecting operational technology data to enterprise IoT stacks with less custom engineering.
- February 2024: The US Department of Energy issued its final determination for ANSI/ASHRAE/IES Standard 90.1-2022, reinforcing the role of ASHRAE 90.1 as a baseline reference for energy codes and compliance pathways. This keeps performance-based design and controls-centric savings strategies in scope for new construction and major retrofit decisions that rely on whole-building modeling and documented outcomes.


Research Methodology Framework and Report Scope
Market Definition and Coverage
We define this market as the revenues earned from automation hardware, software, and related services that monitor and control systems inside commercial buildings across the United States, including HVAC, lighting, security and access, fire and life safety, and energy monitoring.
Scope exclusions: We exclude residential-only deployments, stand-alone consumer smart home devices, and pure construction services that are not tied to automation system supply, integration, or support.
Segmentation Overview
- By Product Type
- HVAC Control Systems
- Security and Access Control Systems
- Energy Management and Power-Monitoring Systems
- Lighting and Shading Control Systems
- Fire and Life-Safety Systems
- Integrated Building-Management Platforms
- By Building Type
- Office
- Institutional (Education and Healthcare)
- Retail
- Hospitality
- Industrial and Warehouse
- Mixed-Use and Other Commercial
- By Component
- Controllers and Field Devices
- Sensors
- Software and Analytics Platforms
- Services (Consulting, Integration and Maintenance)
- By Communication Protocol / Network
- BACnet
- Modbus
- KNX
- LonWorks
- Zigbee and Other Wireless Protocols
- EnOcean and Energy-Harvesting Protocols
- Proprietary Protocols
Data Sources, Market Sizing, and Validation
Desk Research
Desk work started with public data that helps explain how large the addressable commercial building base is and how fast it is changing. We referred to sources such as the U.S. Energy Information Administration for commercial energy use context, the U.S. Census Bureau for construction and building stock signals, and the Bureau of Labor Statistics for labor and price trend checks that influence installed costs.
We then layered in program and compliance signals that shape retrofit timing, using sources such as the U.S. Department of Energy programs, ASHRAE guidance on building performance, and NFPA materials for life safety system adoption patterns. Company filings, investor decks, and credible press were used to understand product mix shifts, for example more software and services, and typical customer buying cycles. Where needed, we also used paid subscriptions for company financials and intelligence, patent databases, and shipment-level trade statistics to validate inputs directionally. These examples are illustrative, and we used many other public and subscription sources for data collection, validation, and clarification.
Primary Interviews and Surveys
Primary work focused on checking what the numbers mean in practice, since commercial automation is affected by retrofit scope, building type, and integration complexity. We spoke with system integrators, contractors, distributors, facility teams, and solution specialists to confirm typical project values, protocol choices, and service attachment rates. After that, we adjusted assumptions where desk inputs did not match field reality. Since the title is U.S. focused, we balanced coverage across major building markets and climate zones so that HVAC and energy management weighting did not get skewed by one region.
Distribution of primary research fieldwork respondents
| Company type | Respondent position | Region |
|---|---|---|
| Top tier: 36% | CXOs: 13% | |
| Mid tier: 46% | Functional/Unit leaders: 42% | |
| Smaller Players: 18% | Managers: 45% |
Market-Sizing & Forecasting
Sizing begins with a top-down build that reconstructs commercial automation demand from the U.S. commercial building base, retrofit and new build activity, and the share of projects that include automation controls and ongoing software or services. Once that demand pool was shaped, we corroborated the totals with selective bottom-up approximations, where sampled average selling prices and typical project volumes from integrators and distributors were rolled up, and then adjusted when the implied penetration looked unrealistic for specific building environments.
Key inputs used in the model included the commercial building stock and additions, retrofit intensity (energy upgrades and control modernization), HVAC and lighting control mix by building use, protocol and connectivity trends that influence controller and sensor counts, and service and software attach rates that lift recurring revenue. Because data granularity varies by component and building category, missing pieces in the roll-up were handled through clearly stated proxy ratios, for example using observed controller-to-sensor ranges from interviews, and then cross-checked against installation labor and project ticket sizes.
For forecasting, scenario analysis was used to reflect how policy-driven efficiency upgrades, interest rate sensitivity in construction, and cybersecurity requirements can change adoption speed. Assumptions for automation penetration and price progression were aligned to expert views from interviews, and the final path was kept consistent with observable U.S. commercial activity indicators rather than a single aggressive curve.
Data Validation & Update Cycle
Validation was done through multiple checks so the results stayed anchored to real purchase behavior. Our team compared outputs against independent signals such as commercial construction momentum, typical automation spend per project, and known shifts toward software and managed services, and then investigated any sharp jumps before sign-off.
A second analyst review was used to pressure-test assumptions that commonly drive variance, including penetration rates by building type, service attachment, and timing of retrofit cycles. The report is refreshed annually, and interim updates are triggered when major policy changes, supply constraints, or pricing moves materially change near-term expectations. Before delivery, a fresh pass is completed so clients receive the most current view available at that time.
Mordor Intelligence's United States Commercial Building Automation Market Size Versus Other Published Estimates
It is normal to see different published market sizes for U.S. commercial building automation, because studies do not always count the same revenue streams or even the same building set. The main differences usually come from whether adjacent areas are included, how services are treated, and which year and pricing logic is used.
Some estimates fold in broader U.S. building automation that includes residential or industrial environments, and some count only hardware shipments while leaving out software and recurring services. Others apply faster price growth or a more aggressive retrofit cycle without checking it against commercial construction signals and field feedback. Here, residential-only deployments are left out, software and services tied to commercial automation projects are counted, and the annual refresh process keeps assumptions aligned to the latest U.S. upgrade activity, which explains the spread, a modeling choice applied by Mordor Intelligence.
Benchmark comparison
| Source | Market Size | Gaps in Research Methodology |
|---|---|---|
| Mordor Intelligence | USD 21.23 B (2025) | |
| Specialist Research Publisher A | USD 19.58 B (2025) | Uses a narrower definition centered on building automation and control hardware, and it typically assigns less value to software and recurring service layers in commercial projects, which pulls the total down. |
| Industry Research Outlet B | USD 18.53 B (2023) | Shows an earlier-year snapshot and often reflects a control-systems oriented scope, so differences come from year selection, inflation timing, and partial coverage of integrated BAS and service revenues. |
The table shows that the gap is driven more by scope and year choice than by math. When commercial-only coverage is kept consistent and software and service revenue is treated in a traceable way, the resulting size becomes easier to reconcile with observable project values and adoption signals, which is what we aimed to maintain throughout the model.


Key Questions Answered in the Report
How large is the U.S. commercial building automation systems market in 2026?
It totals USD 22.53 billion with a 6.12% CAGR outlook to 2031.
Which product currently dominates adoption?
HVAC control systems hold 40.92% revenue due to mandatory energy-performance standards.
Which building category is growing fastest?
Mixed-use developments are projected to expand 7.01% CAGR as cities favor multi-function construction.
What role do tax incentives play in project ROI?
Section 179D deductions can cut installed costs to USD 2–3 per square foot, trimming payback to about three years.
Why are wireless protocols gaining share?
Energy-harvesting Zigbee and EnOcean devices remove wiring labor, lowering retrofit costs by up to 60%.
Page last updated on:






