
Market Overview
| Study Period | 2021 - 2031 |
|---|---|
| Forecast Data Period | 2026 - 2031 |
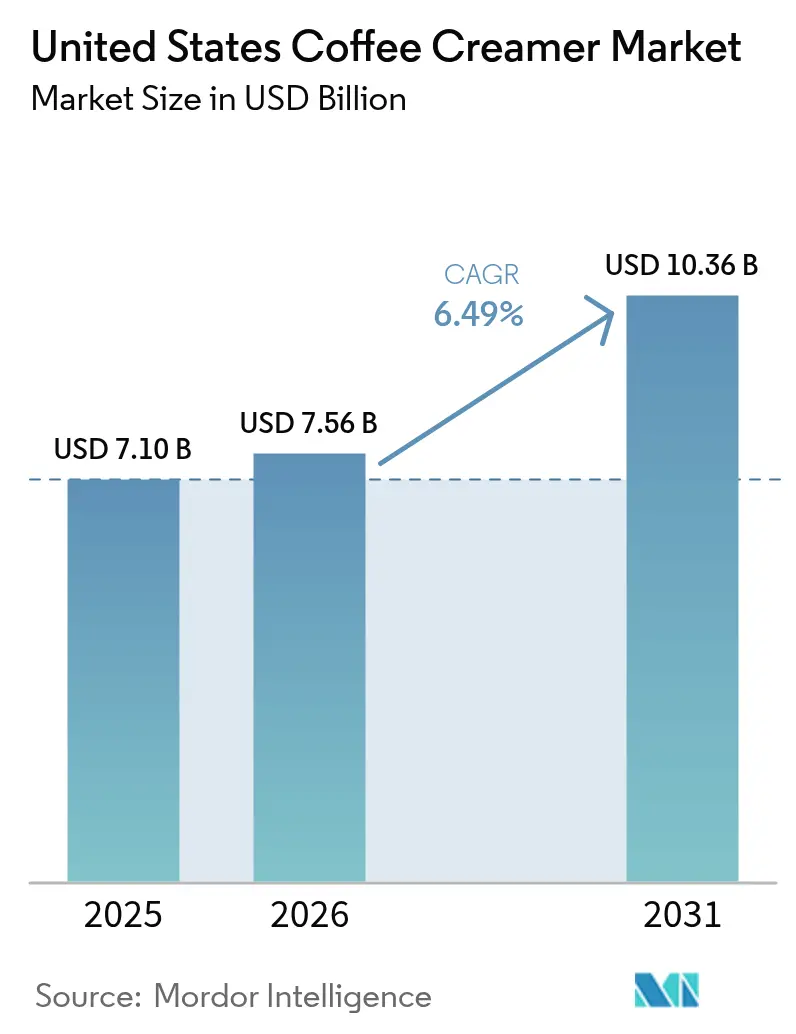
| Base Year Market Size (2025) | USD 7.1 Billion |
| Market Size (2026) | USD 7.56 Billion |
| Market Size (2031) | USD 10.36 Billion |
| Growth Rate (2026 - 2031) | 6.49 % |
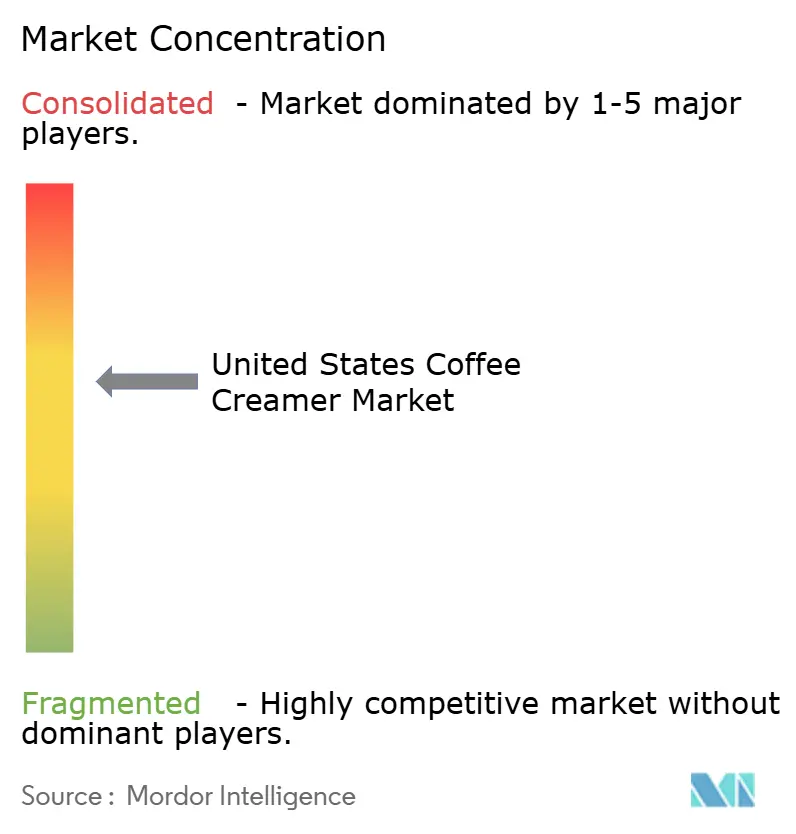
| Market Concentration | Medium |
Major Players *Disclaimer: Major Players sorted in no particular order Image © Mordor Intelligence. Reuse requires attribution under CC BY 4.0. | |
United States Coffee Creamer Market Analysis by Mordor Intelligence
The US coffee creamer market size was valued at USD 7.1 billion in 2025 and estimated to grow from USD 7.56 billion in 2026 to reach USD 10.36 billion by 2031, at a CAGR of 6.49% during the forecast period (2026-2031). Ongoing demand for at-home coffee customization, format breakthroughs such as canned cold foam, and rising adoption of plant-based formulations continue to push category growth. Manufacturers are channeling capital into new aseptic lines and regional capacity, especially in the Southwest, to shorten supply chains and serve fast-growing metropolitan areas. Clean-label reformulation, driven by new FDA nutrient-content rules, underpins premiumization as labels move toward shorter ingredient decks and lower added sugars. At the same time, e-commerce subscriptions deepen household penetration by automating replenishment and offering a wide flavor catalog to consumers in suburban and rural ZIP codes.
Key Report Takeaways
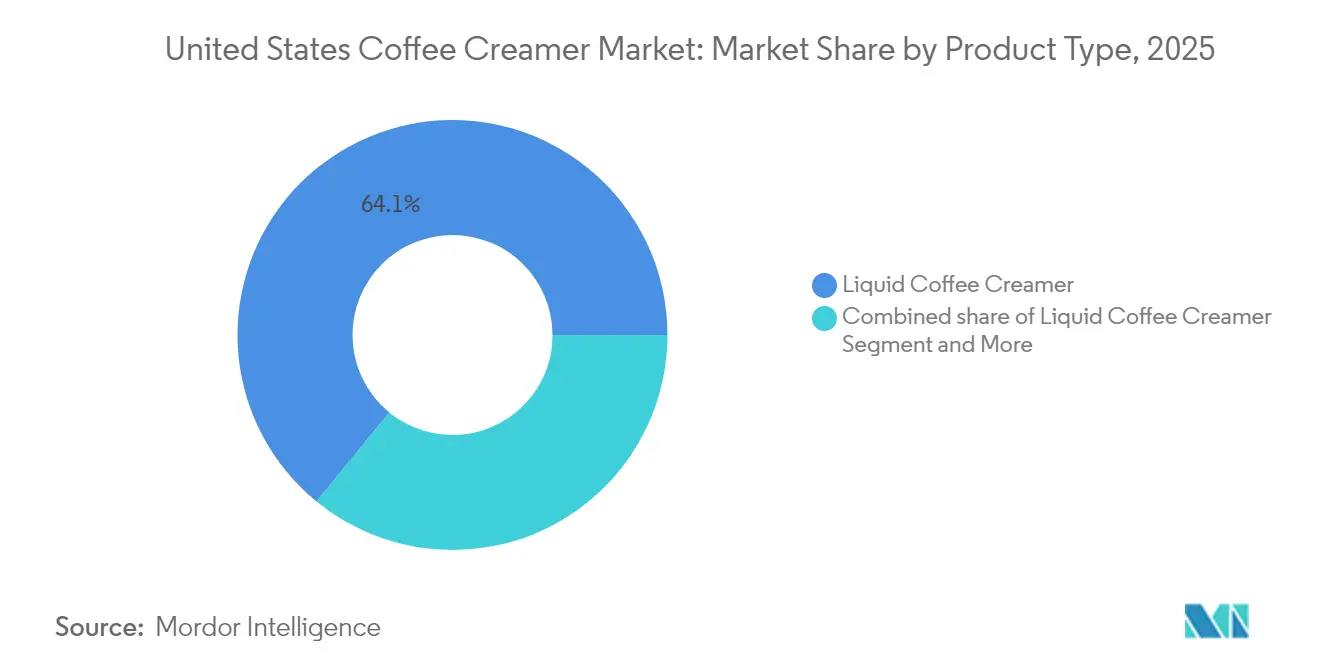
- By product type, liquid coffee creamers led with 64.10% of US coffee creamer market share in 2025. Powder coffee creamers are projected to post the fastest 7.01% CAGR from 2026-2031 within the product-type segmentation.
- By flavor, flavored formats accounted for a 61.05% share of the US coffee creamer market size in 2025, while unflavored products are expected to advance at the quickest 6.63% CAGR through 2031.
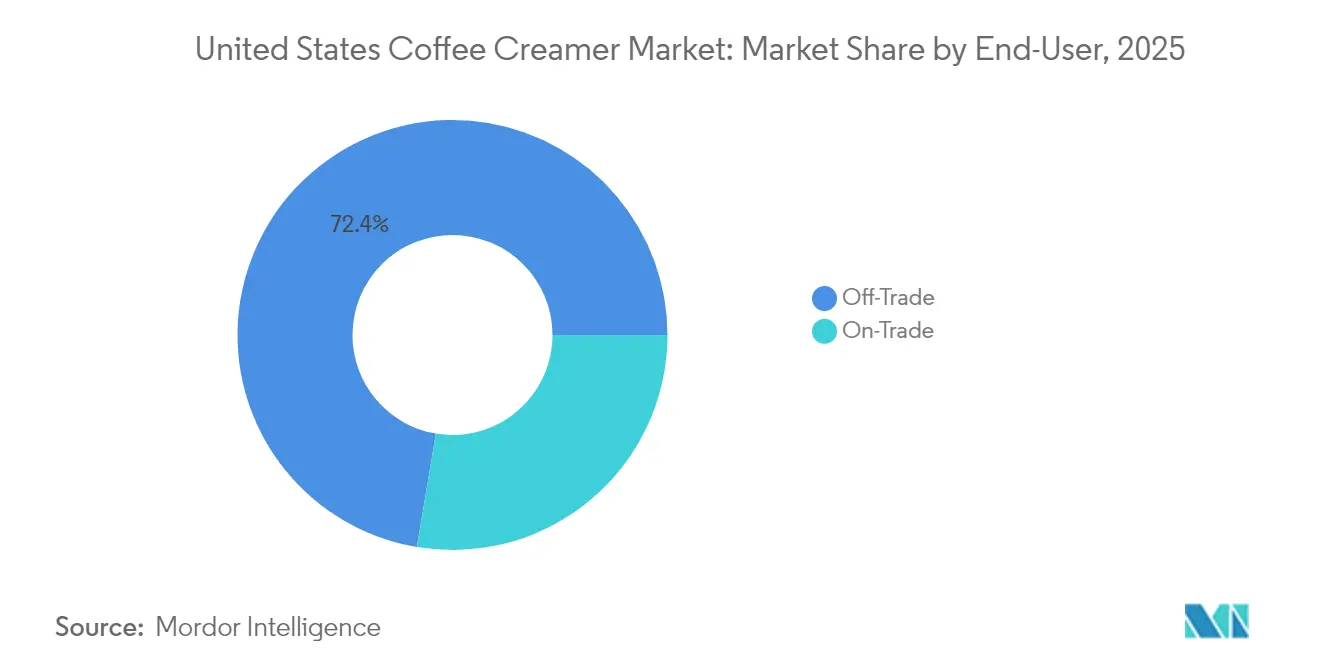
- By end-user, off-trade channels captured 72.35% of the US coffee creamer market size in 2025; on-trade applications are poised to record the highest 6.95% CAGR to 2031.
Note: Market size and forecast figures in this report are generated using Mordor Intelligence’s proprietary estimation framework, updated with the latest available data and insights as of 2026.
United States Coffee Creamer Market Trends and Insights
Drivers Impact Analysis*
| Driver | (≈) % Impact on CAGR Forecast | Geographic Relevance | Impact Timeline |
|---|---|---|---|
| Flavor and format innovation surge | +1.8% | Global; early gains in major metropolitan areas | Short term (≤ 2 years) |
| Rising clean-label and plant-based demand | +1.5% | National; concentration on West Coast and Northeast | Medium term (2-4 years) |
| E-commerce subscription boom | +1.2% | National; accelerated in suburban and rural markets | Medium term (2-4 years) |
| Cold-foam/RTD coffee pull-through | +1.4% | Urban centers; widening to secondary markets | Short term (≤ 2 years) |
| Southwestern aseptic capacity build-out | +0.9% | Southwest and West; distribution nationwide | Long term (≥ 4 years) |
| Functional keto/MCT trend | +0.7% | National; premium health-conscious demographics | Medium term (2-4 years) |
| Source: Mordor Intelligence | |||
Flavor and Format Innovation Surge
Richer flavor pipelines and entirely new delivery systems are broadening the US coffee creamer market. Nestlé’s Coffee-mate has partnered with confectionery brands to roll out KIT KAT and seasonal Caramel Apple Crisp variants, while Danone’s International Delight immersed itself in pop-culture tie-ins such as the Home Alone Hot Chocolate Marshmallow launch[1]. The category’s first mass-market cold-foam dispensers dispense a micro-foamed creamer that claims 25% less sugar and 25% more servings per can than standard rivals. Engagement spikes on social media underscore strong resonance with Gen Z; the hashtag #ColdFoam registered more than 321 million TikTok views, indicating that shareable, café-style experiences can be recreated at home. Flavor licensing, limited-time drops, and a convenient canned format collectively accelerate velocity on shelf while cementing the perception of creamers as an affordable indulgence relative to out-of-home espresso beverages.
Rising Clean-Label and Plant-Based Demand
Ingredient transparency now influences brand choice as consumers scrutinize additives such as carrageenan and artificial sweeteners. SPINS panel data shows plant-based creamers as the only dairy-alternative sub-category to register positive value growth in 2023, rising 10% to USD 701 million[2]. Oatly’s life-cycle analysis reveals a 44-76% lower climate footprint than cow’s milk, supporting the sustainability narrative embraced by affluent coastal shoppers. Darigold’s Belle series features just five ingredients and no oils, targeting lactose-intolerant households seeking a recognizable ingredient list. FDA’s revised “healthy” icon set for February 2025 forces formulators to cap added sugars and saturated fat, incentivizing investments in natural sweeteners and coconut-oil-free emulsification[3]. The emphasis on straightforward labels positions plant-based and simplified dairy formulations to capture incremental shelf space, especially in premium refrigerator doors.
E-Commerce Subscription Boom
Direct-to-consumer (DTC) platforms accelerate trial and retention for emerging creamer players. Nutpods began as a Kickstarter campaign and scaled roughly 500% CAGR across two years before lining up conventional retail listings, demonstrating the flywheel effect of online validation. Subscription bundles lower customer acquisition costs because automatic monthly shipments lock in repeat volume and deliver flavor variety without distribution slotting fees. Ratings and reviews on Amazon function as trust badges, often elevating challenger brands to bestseller ranks ahead of incumbents with broader brick-and-mortar presence. Legacy manufacturers are responding with their own DTC microsites and loyalty programs to recapture data-rich relationships initially ceded to marketplaces.
Cold-Foam/RTD Coffee Pull-Through
The ready-to-drink (RTD) coffee segment shapes consumption patterns for adjunct products such as creamers. Refrigerated RTD coffee posted 7% growth to USD 1.2 billion in 2024, while premium cold-brew volumes slid 30% to USD 147 million, signaling a tilt toward convenient multi-serve bottles. Starbucks retained top share at USD 465 million in refrigerated sales, but Stōk’s 28% jump to USD 348 million underscores nimble challenger momentum. Retail cold-foam products echo this convenience trend by letting consumers mimic café froth atop RTD bases at home. Dunkin’s Valentine’s Day-themed cold-foam cans at USD 5.99 fuse seasonal cues with a popular coffeehouse brand, making foam customization a mass phenomenon and offering incremental sales both for RTD coffee and creamers.
Restraints Impact Analysis*
| Restraint | (≈) % Impact on CAGR Forecast | Geographic Relevance | Impact Timeline |
|---|---|---|---|
| Sugar & additive health backlash | -1.3% | National; higher impact in health-conscious metros | Medium term (2-4 years) |
| Raw-material cost volatility | -1.1% | Global supply chain; regional manufacturing variations | Short term (≤ 2 years) |
| FDA added-sugar label proposals | -0.8% | Nationwide regulatory compliance | Long term (≥ 4 years) |
| Climate risk on coconut/oat crops | -0.6% | Global sourcing; plant-based segment pricing | Long term (≥ 4 years) |
| Source: Mordor Intelligence | |||
Sugar & Additive Health Backlash
Public-health advocates increasingly link added sugars and emulsifiers to chronic disease risk, prompting consumer skepticism toward legacy formulas. Mandatory “added sugar” disclosure on Nutrition Facts panels magnifies visibility of sweetener loads and forces brands to benchmark labels against competitors. Influential cardiology bloggers have spotlighted carrageenan and partially hydrogenated oils, swelling demand for cleaner dairy and plant-based variants. In response, Coffee-mate’s cold foam positions a 25% sugar reduction compared with leading flavored liquids, while Darigold substitutes fillers with real cream and enzyme-based lactose removal. Yet taste expectations limit the pace at which mainstream offerings can slash sugar without risking volume losses, creating a delicate balancing act between health, flavor, and price.
Raw-Material Cost Volatility
Milk, coconut, and oats—all foundational inputs—face fluctuating commodity indices and climate-related disruptions. Texas milk prices fell from USD 23.68 to USD 18.98 per hundredweight between 2022 and 2023, highlighting revenue swings that ripple into creamer margins. Oat futures remain susceptible to Canadian drought cycles, and coconut supply chains face typhoon risks in Southeast Asia, complicating cost forecasting for plant-based SKUs. Investment in domestic manufacturing—over USD 7 billion in announced U.S. dairy processing projects—can offset logistics fees but requires sustained throughput to reach breakeven. Brands with diversified ingredient contracts and hedged positions are better placed to buffer shelf-price inflation.
*Our forecasts treat driver/restraint impacts as directional, not additive. The impact forecasts reflect baseline growth, mix effects, and variable interactions.
Segment Analysis
By Product Type: Liquid Formats Lead Category Evolution
Liquid coffee creamers held 64.10% of US coffee creamer market share in 2025 and are estimated to maintain a 6.55% CAGR to 2031, a trajectory underpinned by consumer preference for ready-to-pour convenience and novelty flavors. Non-dairy liquids reinforce growth by addressing lactose intolerance and vegan preferences, aligning with the broader plant-based narrative already adding USD 701 million in 2023 value. Powder formats remain a fixture in institutional and on-the-go occasions thanks to longer shelf life and portion-controlled packets.
Cold foam, the newest liquid subset, commands a premium ticket at USD 4.68-5.99 per 14-ounce can and is projected to further enlarge the US coffee creamer market size over the forecast horizon. Early sell-through rates indicate a favorable reception among younger households and indulgence-seekers replicating café micro-foam at home. The powder segment responds through dairy-based keto powder launches featuring MCT oils, a nod to functional demand pockets, yet volumes trail liquid counterparts. FDA labeling stipulations for “non-dairy” powders containing sodium caseinate require explicit allergen call-outs, nudging manufacturers toward either full dairy or full plant formulations.

By Flavor: Customization Drives Premium Positioning
Flavored variants captured 61.05% of US coffee creamer market share in 2025 and are predicted to expand at a 6.38% CAGR through 2031. Vanilla and hazelnut remain anchor flavors, but licensed extensions such as KIT KAT and White Lotus tie-ins elevate average price while spurring social-media buzz. Unflavored SKUs fulfill demand among coffee purists and cost-sensitive buyers, yet incremental growth gravitates toward dessert-inspired, seasonal, and zero-sugar flavored lines.
Flavor innovation acts as a direct lever to lift transaction size, since shoppers frequently trade up to 32-ounce bottles for limited drops. Social channels distribute flavor “leaks” that create pre-launch anticipation, a tactic especially effective among Gen Z and millennial audiences. As manufacturers trim artificial colors and sweeteners to comply with forthcoming health-claim criteria, natural flavor houses gain strategic importance for delivering clean-label yet indulgent profiles.
By End-User: Off-Trade Dominance Mirrors Home-Brew Trends
Off-trade venues—including supermarkets, club stores, and e-commerce—accounted for 72.35% of US coffee creamer market size in 2025 and are forecast to post a 6.41% CAGR through 2031. Pandemic-era habits entrenched daily home brewing, while DTC subscriptions lock in monthly re-orders. TreeHouse Foods leverages scale as the world’s largest private-label powder producer, serving retailers intent on price-fighting national brands.
On-trade utilization persists in foodservice, thanks to high-volume kegged creamers and portion-control tubes favored by cafés and offices. Technomic shows 75% of convenience-store patrons purchase regular coffee, making single-serve creamer cups a traffic driver. Office-coffee service also rebounds as hybrid work schedules stabilize, though overall share remains below pre-2020 levels. Regulatory calorie-disclosure rules for vending machines compel clear front-label calorie display, nudging operators to stock lower-sugar options as a compliance safeguard.
Geography Analysis
Regional dynamics shape the coffee landscape, influenced by demographic clusters, supply-chain footprints, and local coffee cultures. After launching a USD 675 million plant in Arizona, Nestlé bolsters the Southwest's status as a manufacturing hub. This facility is set to distribute Coffee-mate, Natural Bliss, and Starbucks creamers across the nation. By deploying aseptic lines, the company not only reduces freight costs to West Coast retail distribution centers but also mitigates challenges posed by limited cross-country refrigerated trucking capacities. On the West Coast, a dense population of flexitarian consumers, coupled with a network of specialty grocers promoting climate-friendly products, drives plant-based adoption beyond national averages. Oatly’s climate-footprint labeling strategy finds a receptive audience in California and Washington, propelling plant-based sales ahead of dairy alternatives. Meanwhile, the Northeast, with its affluent urban corridors from Boston to New York, leans towards premium and artisanal creamers, bolstered by a culture of boutique roasters.
While Midwestern and Southeastern states traditionally favor dairy and value pricing, there's a notable surge in e-commerce adoption in suburban areas, especially where grocery selections might miss niche flavors. Texas, pouring over USD 7 billion into dairy processing projects, is becoming a key player, supplying both fluid milk and whey derivatives. This bolsters regional sourcing for hybrid dairy-plant blends. Nationwide, retailers are standardizing flavor offerings in their planograms, diminishing historical regional differences in shelf sets. However, they still roll out holiday exclusives selectively, testing localized demand.
Regulatory Landscape
Coffee creamers marketed as dairy are governed by FDA standards of identity for milk and cream products under 21 CFR Part 131, including provisions for coffee cream/light cream and labeling requirements that affect how flavors, sweeteners, and pasteurization status are characterized. For dry non-dairy creamer used in institutional and retail channels, USDA AMS commercial item descriptions (for example, A-A-20043D) specify product requirements and connect compliance to FDA Current Good Manufacturing Practices under 21 CFR Part 117.
Labeling compliance tightened with the FDA uniform compliance date for final food labeling regulations issued in 2023-2024, taking effect on January 1, 2026. That change has required manufacturers to synchronize packaging updates across SKUs and formats. Plant-based and hybrid formulations also face heightened scrutiny around naming and consumer clarity following the FDA draft guidance released in January 2025 on labeling plant-based alternatives to animal-derived foods, and ingredient labeling rules (for example, 21 CFR 101.4) continue to require explicit parenthetical disclosures when caseinate is used in non-dairy products. This can shape how brands position for allergy-sensitive audiences while supporting non-dairy claims.
Value Chain Analysis
The value chain runs from upstream inputs (fluid milk/cream from US dairy cooperatives, sweeteners, stabilizers, flavors, and plant-based bases such as oat and coconut) through formulation, processing, and packaging across refrigerated, shelf-stable, and powder formats. Standards of identity and labeling requirements influence formulation choices, especially for products positioned as dairy, non-dairy, or plant-based alternatives. At the same time, cold-chain and aseptic capabilities shape route-to-market economics for national distribution.
Manufacturing sits with large branded processors and a limited set of co-packers, and scale players have continued capacity expansions to reduce supply constraints and improve service levels. Nestle USA began operations at a 630,000 square foot, USD 675 million Glendale, Arizona facility in January 2025 to produce Coffee-mate, natural bliss, and Starbucks creamers. Danone North America completed an expansion in Jacksonville, Florida (including a new production line and bottle-molding capability) in 2025 to lift creamer throughput. Downstream, off-trade remains dominant across supermarkets, club, convenience, and online retail, while direct-to-consumer subscriptions and marketplace sales increasingly serve as trial and replenishment engines, especially for differentiated flavors, clean-label propositions, and plant-based lines.
Competitive Landscape
Regional dynamics shape the coffee landscape, influenced by demographic clusters, supply-chain footprints, and local coffee cultures. After launching a USD 675 million plant in Arizona, Nestlé bolsters the Southwest's status as a manufacturing hub. This facility is set to distribute Coffee-mate, Natural Bliss, and Starbucks creamers across the nation. By deploying aseptic lines, the company not only reduces freight costs to West Coast retail distribution centers but also mitigates challenges posed by limited cross-country refrigerated trucking capacities. On the West Coast, a dense population of flexitarian consumers, coupled with a network of specialty grocers promoting climate-friendly products, drives plant-based adoption beyond national averages. Oatly’s climate-footprint labeling strategy finds a receptive audience in California and Washington, propelling plant-based sales ahead of dairy alternatives. Meanwhile, the Northeast, with its affluent urban corridors from Boston to New York, leans towards premium and artisanal creamers, bolstered by a culture of boutique roasters.
While Midwestern and Southeastern states traditionally favor dairy and value pricing, there's a notable surge in e-commerce adoption in suburban areas, especially where grocery selections might miss niche flavors. Texas, pouring over USD 7 billion into dairy processing projects, is becoming a key player, supplying both fluid milk and whey derivatives. This bolsters regional sourcing for hybrid dairy-plant blends. Nationwide, retailers are standardizing flavor offerings in their planograms, diminishing historical regional differences in shelf sets. However, they still roll out holiday exclusives selectively, testing localized demand.
United States Coffee Creamer Industry Leaders
-
Heartland Food Products Group
-
Nestlé S.A
-
Danone S.A
-
TreeHouse Foods Inc.
-
Califia Farms LLC
- *Disclaimer: Major Players sorted in no particular order
Market Opportunities and Future Outlook
Capacity additions and network redesign are a visible focus for faster replenishment cycles and wider format portfolios, as brands manage the mix between refrigerated distribution and shelf-stable or aseptic options. Nestle USA brought online its USD 675 million Glendale, Arizona factory in January 2025 to support Coffee-mate, natural bliss, and Starbucks creamers, and Danone North America expanded its Jacksonville, Florida hub with a new production line in 2025. Together, these moves signal continued investment in domestic manufacturing intended to improve service levels and reduce reliance on constrained cold-chain lanes.
Product-led opportunities center on cleaner labels, sugar reduction, and function-forward dairy and plant-based formulations that can fit evolving front-of-pack and claim constraints. The FDA draft guidance (January 2025) on naming and labeling plant-based alternatives increases the premium on clear, unambiguous on-pack communication for non-dairy and plant-based creamers. Separately, the January 1, 2026 uniform compliance date for 2023-2024 food labeling rules pushes coordinated packaging refreshes that can be paired with reformulation and line extensions. Recent product activity, including Darigold lactose-free refrigerated creamers (January 2026) and Danone Too Good & Co. lower-sugar creamers (November 2025), points to demand for reduced-sugar and digestion-friendly propositions that still deliver indulgent flavors, while e-commerce subscriptions provide another channel to scale niche flavors beyond traditional planogram limits.
Recent Industry Developments
- July 2026: Nestle Coffee-mate introduced a limited-edition Situation-Sip mixed fruit flavored creamer tied to a pop-culture collaboration. The release reinforces the category's limited-time and licensed-flavor playbook to create shelf disruption and incremental trips in flavored liquid creamers.
- December 2025: Danone North America expanded Internationals Delight seasonal programming with a limited-edition creamer and cold foam collection created in partnership with Paris Hilton. The collaboration extended brand reach beyond core grocery shoppers and supported premium-priced formats such as cold foam alongside traditional liquid creamers.
- June 2024: Danone North America expanded Dunkin at-home offerings with the launch of Dunkin Brownie Batter Creamer. The release added dessert-style flavor variety designed to lift flavored-creamer rotation and strengthen Dunkin's position in retail creamers.
Research Methodology Framework and Report Scope
Market Definition and Coverage
In this methodology, the market covers coffee creamer products sold in the United States that are added to coffee to change taste, texture, and mouthfeel, and it includes both liquid and powder formats across dairy-based and non-dairy formulations.
Scope exclusions: We exclude plain fluid milk, heavy cream, and coffee whiteners that are not marketed or sold as coffee creamer products.
Segmentation Overview
- By Product Type
- Powder Coffee Creamer
- Dairy-based Powder
- Non-dairy Powder
- Liquid Coffee Creamer
- Dairy-based Liquid
- Non-dairy Liquid
- Powder Coffee Creamer
- By Flavor
- Unflavored
- Flavored
- Vanilla
- Hazelnut
- Caramel
- Chocolate
- Others
- By End-User
- On-trade
- Off-Trade
- Supermarkets / Hypermarkets
- Convenience Stores
- Online Retail Stores
- Others
Data Sources, Market Sizing, and Validation
Desk Research
Desk research was used to map the demand pool and the main go-to-market routes, before any numbers were modeled. We referenced public sources such as USDA data and releases, US Census Bureau and trade statistics, FDA guidance on labeling and ingredients, and Bureau of Labor Statistics inflation and consumer price series to understand price moves and household purchasing power.
To make the model practical, we also used sources such as company filings and investor materials, retail and grocery trade press, and association or category pages that describe creamer formats and merchandising. In a few places, paid subscriptions that compile company financials and news, and a shipment-level import and export database, were used to cross-check ingredients exposure and packaging-related flows. These desk research sources are illustrative only, and many other public documents were also reviewed to validate data points and clear up open questions.
Primary Interviews and Surveys
Primary work focused on validating what drives value sales in coffee creamers, especially the split between liquid and powder, and the pricing and promotion patterns seen across key retail channels. We spoke with a mix of manufacturers, ingredient and packaging participants, distributors, and retail-facing roles, and then used follow-up checks to confirm assumptions on channel mix, flavor demand, and non-dairy penetration that were not consistently visible in public sources.
Distribution of primary research fieldwork respondents
| Company type | Respondent position |
|---|---|
| Top tier: 35% | CXOs: 19% |
| Mid tier: 45% | Functional/Unit leaders: 22% |
| Smaller Players: 20% | Managers: 59% |
Market-Sizing & Forecasting
Sizing starts from a top-down demand pool reconstruction that ties household coffee consumption routines to creamer usage frequency, typical pack sizes, and observed retail price bands, which are then translated into annual value. To keep the totals grounded, we corroborate the outcome with selective bottom-up checks, such as rolling up a sample of supplier revenues, checking channel mixes in grocery and online, and using sampled average selling prices multiplied by implied volumes to see if the arithmetic holds.
A few of the practical inputs used in the model include the liquid versus powder share shifts, non-dairy mix changes, flavor mix impact on price points, on-trade versus off-trade weighting, and CPI-led price inflation effects on average selling prices. When a sub-segment has thin public visibility, gaps are handled by using proxy ratios from adjacent categories and then adjusting them based on what interviewees reported for current sell-through and promotional intensity.
For forecasting, scenario analysis is used first to capture different paths for at-home coffee routines, premiumization, and non-dairy adoption, and then the selected case is smoothed using exponential smoothing on historical value growth so the curve does not overreact to short-term price spikes. The final forecast assumptions are kept consistent with the channel and pricing realities confirmed during primary calls, and they are reviewed for internal consistency across all major levers.
Data Validation & Update Cycle
Outputs are checked through multiple passes so that outliers are caught early. We compare modeled value with independent signals such as pricing trends, category growth commentary, and channel-level direction from interviews, and then we revisit any variance that looks too large to be explained by mix or inflation.
Before sign-off, another analyst reviews the core assumptions, the math steps, and the sensitivity of key variables like ASP growth and non-dairy share. Reports are refreshed annually, and interim updates are made when material events occur (for example, sharp input-cost changes or meaningful shifts in retail pricing). Right before delivery, we do a final review pass to ensure the latest public updates and primary feedback have been reflected.
Mordor Intelligence's United States Coffee Creamer Market Size Measured Against Other Published Estimates
Published market values for United States coffee creamer can look far apart because each publisher chooses its own scope, channel coverage, and pricing logic, and these choices change the total more than people expect. Differences also show up when one estimate is updated with fresh inflation and mix shifts and another is still using older price points.
Some external estimates lean toward a production-side view or they fold in adjacent dairy items that sit near creamers on the shelf. In Mordor Intelligence's approach, the value is counted only for coffee creamer products sold as liquid or powder creamers (including dairy-based and non-dairy), and plain milk and general-purpose cream are kept out so the total stays tied to the creamer purchase decision.
Benchmark comparison
| Source | Market Size | Gaps in Research Methodology |
|---|---|---|
| Mordor Intelligence | USD 7.10 B (2025) | |
| Industry Cost Review A | USD 4.80 B (2026) | This figure aligns to a production industry lens, which can understate consumer market value because it reflects manufacturing output and may net out parts of downstream margins and channel markups. |
| Retail Category Brief B | USD 7.00 B (2025) | This estimate appears to be based on tracked retail dollar sales for a creams and creamers category, which can differ from a defined coffee creamer scope due to category bundling and retailer panel coverage limits. |
The spread in the table mainly comes from whether the estimate is built from manufacturing output, from retail scanner sales for a broader category, or from a defined consumer product scope with a consistent price and channel treatment. By keeping the scope tight to coffee creamer products, and then stress-testing totals with channel and pricing checks, the resulting number is easier to trace back to repeatable inputs that a reader can challenge and rerun.
Key Questions Answered in the Report
What is the current value of the US coffee creamer market?
The market is valued at USD 7.56 billion in 2026.
How fast is the category growing?
It is forecast to post a 6.49% CAGR through 2031.
Which product format holds the largest share?
Liquid creamers lead with 64.10% share in 2025.
Why are plant-based creamers gaining traction?
Clean-label demands and lower climate footprints push plant-based dollar sales up 10% to USD 701 million in 2023.