
United States Cashew Market Analysis by Mordor Intelligence
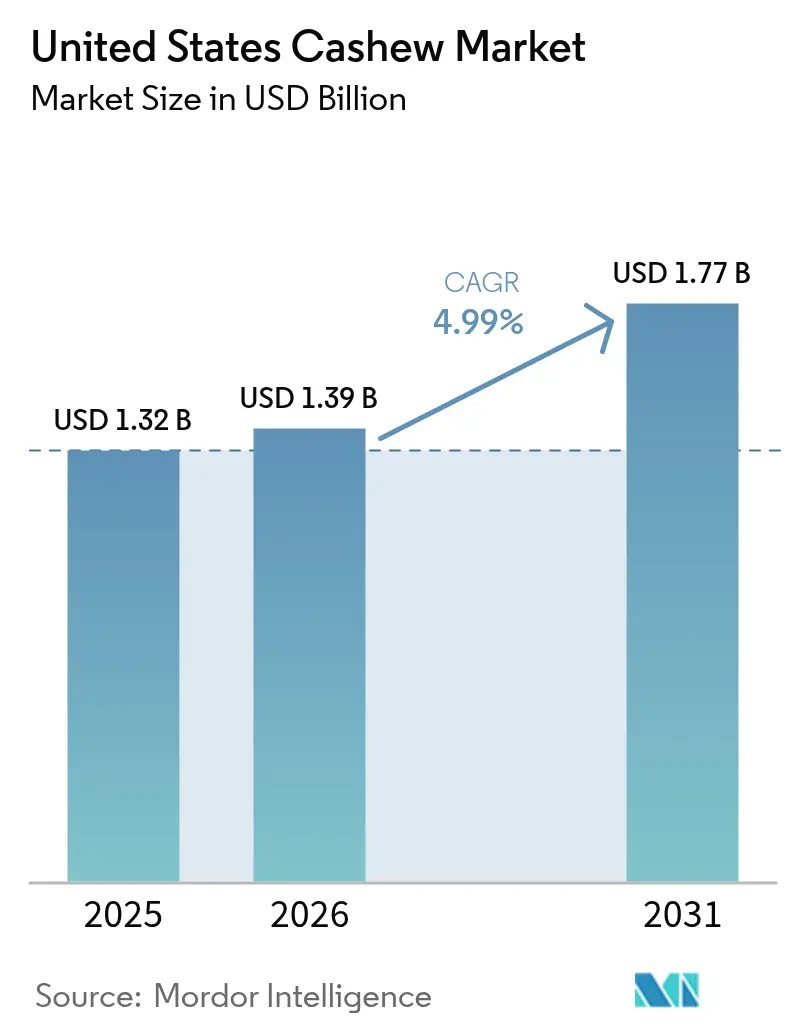
The United States cashew market size is expected to increase from USD 1.32 billion in 2025 to USD 1.39 billion in 2026 and reach USD 1.77 billion by 2031, growing at a CAGR of 4.99% over 2026-2031. Demand pivots around two distinct value pools. Shelled kernels still dominate retail and ingredient channels, yet in-shell formats are rising as experiential snacking drives premium price realization. Foodservice operators, airport retailers, and convenience stores continue to widen stock-keeping units, adding single-serve, flavor-forward combinations that blur the line between indulgence and functional nutrition. Vertically integrated suppliers such as Olam Food Ingredients are shielding margins through farm ownership, Arizona roasting capacity, and multiyear freight contracts, whereas smaller processors absorb higher landed costs and labor inflation, constraining their share of the United States cashew market. Plant-based product developers are reshaping the competitive landscape, with cashew milk, cheese, and bar binders accounting for approximately two-thirds of kernel imports. This trend is reducing spot availability for snack packs and highlighting the importance of supply chain diversification.
Key Report Takeaways
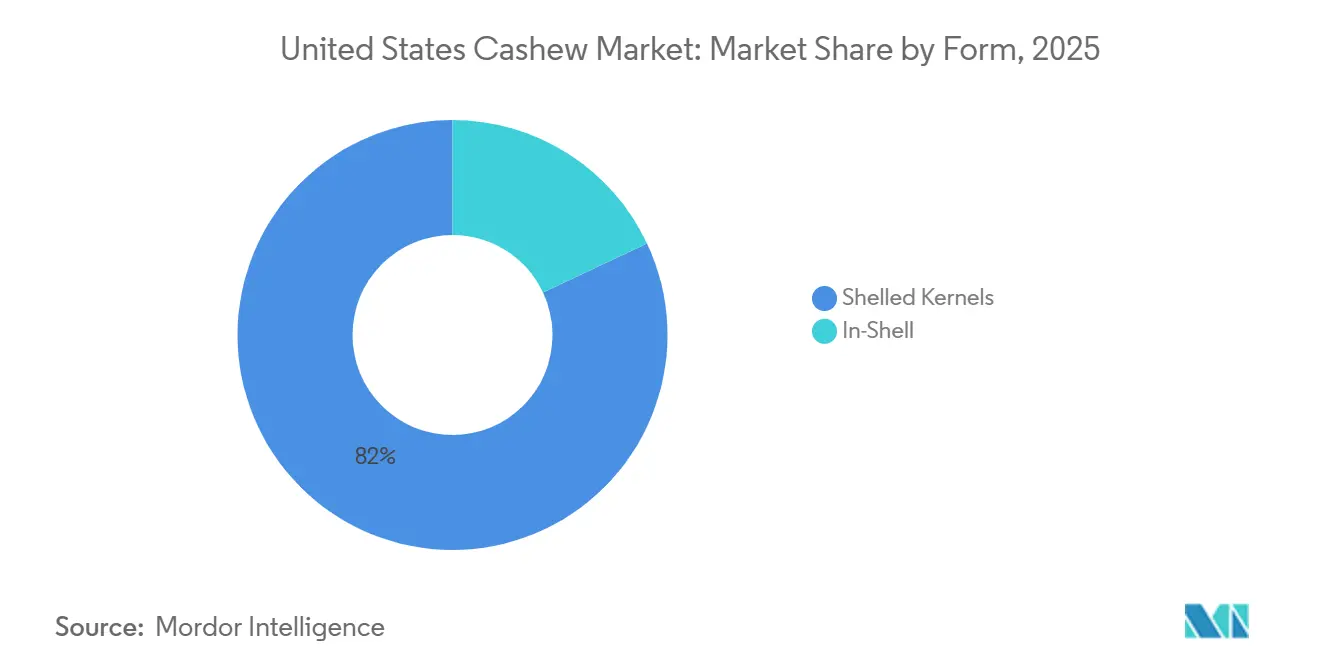
- By form, shelled kernels led with 82.0% of the United States cashew market share in 2025, while in-shell cashews are advancing at an 8.4% CAGR through 2031.
Note: Market size and forecast figures in this report are generated using Mordor Intelligence’s proprietary estimation framework, updated with the latest available data and insights as of 2026.
United States Cashew Market Trends and Insights
Drivers Impact Analysis*
| Driver | (~) % Impact on CAGR Forecast | Geographic Relevance | Impact Timeline |
|---|---|---|---|
| Rising per-capita intake of cashew nuts | +0.9% | Coast-to-coast, concentrated in California, Oregon, Washington, New York, and Massachusetts | Medium term (2-4 years) |
| Surge in plant-based protein demand | +1.4% | Large metropolitan areas such as Los Angeles, San Francisco, New York, Portland, and Austin | Short term (≤ 2 years) |
| Expansion of foodservice and snacking formats | +0.8% | High-traffic airports in Atlanta, Dallas, Chicago, Los Angeles and college towns nationwide | Medium term (2-4 years) |
| Government specialty-crop block-grant incentives | +0.3% | California, Texas, Florida, and North Carolina | Long term (≥ 4 years) |
| Shift toward regenerative cashew agro-forestry | +0.5% | National sourcing impact with premium demand on the West Coast and Northeast | Long term (≥ 4 years) |
| AI-powered optical sorting boosting grade yields | +0.4% | Processing clusters in California and Texas | Medium term (2-4 years) |
| Source: Mordor Intelligence | |||
Rising Per-Capita Intake of Cashew Nuts
According to the International Nut and Dried Fruit Council (INC), the United States' per-capita consumption in 2024 was 0.50 kg, up from 0.41 kg in 2023. Functional snack bars, keto trail mixes, and on-the-go pouches expand eating occasions beyond once-a-day indulgence into post-workout refueling and breakfast replacement[1]. Millennials and Generation Z willingly pay 25-30% premiums for organic and fair-trade certifications, pushing retailers to allocate nearly 20% more shelf space in 2024-2025. While higher intake supports top-line volume, deeper private-label penetration exerts deflationary pressure on shelled commodity grades. Processors capturing experiential niches such as smoked, chili-lime, or dark-chocolate-coated kernels offset that price drag and defend share in the fragmented United States cashew market. Sustained dietary guidance from the Food and Drug Administration (FDA) on the cardiovascular benefits of tree nuts provides an additional halo effect. Consumers are expected to increase average intake to approximately 1.4 pounds by 2031, supporting consistent volume growth even if price pressures subside following the current inflation cycle.
Surge in Plant-Based Protein Demand
Plant-centric consumers are migrating from soy and almond beverages to cashew alternatives that offer a creamier mouthfeel and allergen advantages. Elmhurst Creamery markets its milk with “3 times more cashews per serving,” supporting a USD 6-7 per quart price positioning that holds despite grocery trade-down behavior[2]. Fast-casual chains such as Sweetgreen placed cashew dressings on core salad platforms, making the nut a menu staple rather than a topping. Ingredient buyers secure multiyear contracts, which partially shield them from kernel price spikes but simultaneously tighten availability for snack brands. Academic studies show that cashew-based cheese delivers superior protein efficiency scores compared with coconut matrices, reinforcing its scientific legitimacy and supporting premium shelf prices. Continued household penetration of plant-based products underpins incremental volume growth for the United States cashew market through the forecast horizon.
Expansion of Foodservice and Snacking Formats
Airports, convenience stores, and college campuses added more than 600 new cashew stock-keeping units in the past two years, positioning grab-and-go pouches alongside energy drinks and yogurt cups. Limited-time Planters flavors Toasted Marshmallow Hot Chocolate and Apple Cider Donut, signal how legacy brands use novelty to protect facings against private-label encroachment. Airports such as Los Angeles International increased cashew shelf facings 25% in 2025, driven by traveler demand for protein-dense snacks that meet carry-on security limits. Foodservice consumption is increasing as high-volume chains incorporate cashew chunks into grain bowls, while mixology-focused bars use in-shell roasting at the table to enhance guest experiences and boost revenue. This multi-channel adoption improves processor margins because premium SKUs (Stock Keeping Units) in foodservice and travel retail achieve per-pound revenues 15-20% above grocery shelf averages. The dynamic deepens product segmentation in the United States cashew market, giving mid-tier packers an opportunity to move beyond pure commodity positioning.
Government Specialty-Crop Block-Grant Incentives
The United States Department of Agriculture (USDA) has allocated USD 72.9 million for fiscal year 2025 under the Specialty Crop Block Grant Program, with up to USD 24.2 million designated for California tree nut initiatives, which is projected to positively impact the United States cashew market. Grants offset 15-25% of capital expenditure for roaster upgrades, cold storage, and traceability platforms, accelerating automation for mid-tier processors. Texas, Florida, and North Carolina recipients channel funds into mechanization pilots and agricultural extension training that lift throughput and kernel recovery rates. Although paperwork and matching-fund requirements elongate timelines, completed projects remove cost bottlenecks that currently widen the efficiency gap between integrated majors and regional packers. Over the next five years, grant-financed optical sorters and robotic shellers could raise national premium-grade output by 3-4%, softening import pressure and stabilizing the United States cashew market size. Public funding also catalyzes university research on shelf-life extension and allergen mitigation, feeding an innovation pipeline that small firms might not support on their own.
Restraints Impact Analysis*
| Restraints | (~) % Impact on CAGR Forecast | Geographic Relevance | Impact Timeline |
|---|---|---|---|
| Climatic constraints in key growing regions | -0.7% | West Africa and Vietnam supply chains influencing national availability | Short term (≤ 2 years) |
| Chronic labor shortages in shelling lines | -0.5% | California, Texas, and North Carolina processing corridors | Medium term (2-4 years) |
| Container-space competition with higher-value nuts | -0.4% | East Coast ports Savannah, Charleston, Norfolk and West Coast ports Los Angeles, Oakland | Short term (≤ 2 years) |
| Limited R&D in small-scale mechanized shellers | -0.2% | Southeast and South-Central states with sub-2 000 metric ton processors | Long term (≥ 4 years) |
| Source: Mordor Intelligence | |||
Climatic Constraints in Key Growing Regions
Erratic rainfall and drought cut West African harvests in 2024, while untimely monsoon patterns reduced Vietnamese output by up to 15%, spiking WW320 kernel quotes by 30% by mid-2024. Côte d’Ivoire and Benin imposed export caps to fortify local cracking industries, removing 500,000-600 metric tons of raw nuts from global trade. Importers with one-country supply chains paid up to USD 7,420 per metric ton in October 2025, 20% above 2023 levels. Integrated giants weathered the hike, and smaller packers endured an 8-12% margin loss and passed partial costs to retailers, elevating shelf prices and damping demand elasticity in the United States cashew market. Meteorological models forecast continued variability through 2030, implying a chronic cost overhang unless processors broaden origination to include emerging suppliers such as Mozambique and the Philippines.
Chronic Labor Shortages in Shelling Lines
Farm operators paid hired workers an average gross wage of USD 18.95 per hour in July 2024. By early 2025, this average rose to USD 19.80 per hour, yet vacancy rates hover near 20% for repetitive shelling and inspection roles[3]. Planters’ Suffolk, Virginia, recall in May 2024 forced a five-week shutdown, demonstrating operational fragility when skilled crews are thin. The H-2A visa channel fills orchard-picking roles but remains underutilized in processing plants due to housing mandates. Robots and AI sorters offer relief but require horizon cash flow confidence that many sub-2,000 metric ton operators lack. Consequently, national processing growth lags projected demand, obliging buyers to rely on pre-shelled Vietnamese imports priced 10-15% higher than domestic crack-and-pack equivalents. Labor constraints thus act as a structural ceiling on the United States cashew market's growth rate.
*Our forecasts treat driver/restraint impacts as directional, not additive. The impact forecasts reflect baseline growth, mix effects, and variable interactions.
Segment Analysis
By Form: Experiential Upside for In-Shell Products
In 2025, shelled kernels led with 82.0% of the United States cashew market share in 2025. The segment remains vital due to its role as an ingredient in dairy analogs and nutrition bars, yet private-label commoditization compresses retail margins. Co-manufacturing contracts secure large volumes at discounts of 8-12% compared to branded snack packs, restricting potential gains for processors without robust flavor innovation pipelines. Additionally, the market benefits from regulatory support. The FDA's exemption of cashews from routine aflatoxin sampling under Compliance Policy Guide 7307.001 reduces compliance costs, providing modest support to kernel unit economics.
In-shell cashews are advancing at an 8.4% CAGR through 2031 in the United States cashew market share. Whole Foods, Trader Joe’s, and premium cocktail bars treat roasted in-shell nuts as interactive experiences, charging 15-20% more than shelled nuts. Specialty retailers lifted organic, regenerative-certified in-shell facings 25% over the past two years, capturing younger consumers who equate cracking the shell with freshness. Event venues and backyard gathering trends further raise demand, providing processors with a buffer against private-label price pressure and increasing the overall value density of the United States cashew market.

Geography Analysis
United States coastlines drive consumption, with California, New York, Massachusetts, Oregon, and Washington collectively accounting for a significant share of shipments. This is attributed to high income levels, a wellness-oriented culture, and strong penetration of plant-based products. These states have become key markets due to consumer preferences and purchasing power that support the growth of plant-based product shipments. When erratic monsoons reduced Vietnamese output, importers diversified by utilizing Cambodian trans-shipments, which increased by 34% year-on-year. However, the additional freight legs increased costs, affecting overall profitability for importers.
Processing infrastructure clusters in California’s Central Valley, metropolitan Phoenix, Houston, and North Carolina’s Research Triangle. Olam’s Arizona plant, commissioned in 2024, slashes West Coast lead times by a week, strengthening retailer just-in-time programs. Red River Foods’ transparency platform overlays carbon metrics on farm lots, a feature prized by Pacific Northwest grocers with stringent environmental scorecards. Access to USD 23 million in California grant funding enables West Coast operators to finance AI sorters quickly, whereas Southeastern facilities rely on internal funding and lag on upgrades, widening the cost gap in the United States cashew market.
Channel dynamics differ by region. Los Angeles International, Dallas–Fort Worth, Chicago O’Hare, and Hartsfield Jackson boosted cashew facings by 20-25% over two years, capitalizing on traveler preference for single-serve protein snacks. Fast-casual heavy regions such as the Northeast corridor integrate cashew sauces across menu cores, raising per-store throughput. E-commerce sales skew to California and New York, where direct-to-consumer brands market cashew milk at 40-50% premiums over almond substitutes. Together, these regional traits sustain diverse growth vectors that fuel the wider United States cashew market.
Regulatory Landscape
Cashews entering the United States fall under the Food and Drug Administration (FDA) food safety regime, with importer accountability shaped by FSMA Foreign Supplier Verification Programs (FSVP) requirements in 21 CFR 1.502. This framework drives importers and brand owners toward documented hazard analysis, supplier audits, and verification of preventive controls across upstream shelling and roasting facilities, rather than relying primarily on phytosanitary permitting.
On the agricultural import side, USDA-APHIS regulations (7 CFR 319.56-11) generally allow importation of nuts under the fruits and vegetables framework without a cashew-specific phytosanitary permit in most cases. Procurement and quality specifications are still influenced by USDA-AMS commodity specifications for shelled tree nuts used in institutional and contract buying. From a trade classification standpoint, shelled cashew nuts are captured under HTS 0801.22.00.00 with a general duty rate of Free, making compliance, documentation, and lot traceability more material levers for landed-cost control than base tariff rates for most shipments.
Value Chain Analysis
The United States cashew value chain is import-led, with origin farmers and aggregators (West Africa and Vietnam-dominant supply networks) supplying foreign cracking/shelling and primary processing. Ocean freight and port handling then bring product into US importers, domestic roasters, packers, and ingredient processors. Domestic processing clusters referenced in the report (California, metropolitan Phoenix, Houston, and North Carolina) concentrate activities such as roasting, seasoning, blending, optical sorting, and repacking for retail, foodservice, and ingredient applications, while vertically integrated suppliers use multiyear freight and origin contracts to stabilize availability.
Two downstream demand pools largely shape channel flow: (i) ingredient buyers supplying plant-based milk, cheese, and nutrition bars, and (ii) branded and private-label snack packers selling through grocery, convenience, travel retail, and foodservice. Food safety and documentation run through the chain via FSMA/FSVP programs, while quality specifications and third-party inspection practices are reinforced by USDA-AMS commercial item descriptions and commodity specifications for shelled and roasted nuts used by institutional buyers. Import reliance also amplifies exposure to logistics constraints (container competition at major East and West Coast ports) and to upstream supply shocks, so supplier diversification, inventory buffers, and automation investments (including AI-enabled optical sorting to raise grade yields) remain central operational decisions for US packers and processors.
Competitive Landscape
In the United States cashew market private-label expansion puts constant pressure on branded giants such as Planters, which lost sales after a recall-induced plant shutdown, demonstrating vulnerabilities even at scale. Olam insulates its business through origin integration and farmgate logistics that blunt raw nut inflation. John B. Sanfilippo and Son maintains resilience by servicing plant-based co-manufacturing contracts alongside legacy snack channels.
Technology investment defines the next competitive lap. Tomra’s sorter democratizes premium-grade yields for any processor that can finance USD 400,000 equipment, narrowing historical quality gaps and intensifying shelf rivalry in upscale stores. Smaller plants in Georgia and Florida may need partner capital or strategic exits to fund upgrades, an incentive exploited by private equity. Forward Consumer Partners 51% acquisition of Justin’s in October 2025 confirms investor appetite for plant-forward cashew platforms with omni-channel potential.
Sustainability also influences buyer decisions. The International Nut Council created a cashew working group to unify traceability standards and align them with retailer scorecard protocols. Processors that validate agroforestry practices and lower carbon footprints win end-cap placement and menu features, helping them cushion themselves from commodity cycles. Collectively, brand innovation, capital access, and verified sustainability practices will dictate share shifts across the evolving United States cashew market.
Market Opportunities and Future Outlook
A near-term opportunity is expanding US-based value addition (roasting, seasoning, blending, and repacking) alongside tighter traceability and faster replenishment needs, particularly as the market channels more kernels into plant-based formulations and single-serve formats. The report context points to government specialty-crop block-grant incentives as a practical funding path for mid-tier processors to upgrade roasters, cold storage, and traceability platforms, strengthening the business case for automation that reduces reliance on scarce labor and supports premium-grade recovery when paired with optical sorting.
There is also a gap in product and channel design where cashews command higher value density than commodity snack packs, including in-shell experiential formats in premium retail and foodservice, and portion-controlled packs in high-traffic convenience locations. Recent brand actions in the United States, including expanded distribution of cashew snack packs into Kroger fuel-center banners and new flavor-forward cashew line extensions by major snack brands, suggest incremental growth is being captured through placement expansion and differentiation rather than shelled kernels alone. For suppliers and processors, aligning new SKUs with FSMA/FSVP-ready supplier documentation and USDA-AMS style specification discipline supports broader access to institutional, travel, and large-format retail programs.
Recent Industry Developments
- April 2026: 50Hertz Tingly Foods launched Tingly Cashews, a Sichuan pepper-dusted cashew product, sold via Amazon and select specialty retailers. The product adds heat-led flavor differentiation in a crowded snack set and positions e-commerce as a route for smaller brands to build velocity without national grocery authorization.
- January 2026: Puratos USA Corporation announced the acquisition of Vör Foods, a Trevose, Pennsylvania-based nut butter producer with cashew in its portfolio. The deal expands Puratos' domestic nut-based ingredient capacity and gives it a platform to invest in equipment and throughput that can shorten lead times for bakery and foodservice customers.
- December 2024: Octonuts California launched new cashew snacks and cashew butters with trend-driven flavor combinations. The addition extends plant-based and better-for-you cashew usage beyond plain kernels and increases competitive pressure on legacy snack assortments and private-label basics.
Research Methodology Framework and Report Scope
Market Definition and Coverage
For this study, the market covers the value of cashews sold into the United States, tracked as in-shell cashews and shelled kernels across retail and foodservice demand, with values built in USD for the stated year.
Scope exclusions: Cashew-based end products (such as beverages, spreads, or cheese alternatives) are not counted as separate markets beyond the cashew ingredient value embedded in their demand.
Segmentation Overview
- By Form (Value)
- Shelled Kernels
- In-shell
- By Geography
- Production Analysis
- Production Volume
- Area Harvested and Yield
- Consumption Analysis (Value and Volume)
- Trade Analysis (Value and Volume)
- Import Market Analysis
- Import Value and Volume
- Key Supplying Markets
- Export Market Analysis
- Export Value and Volume
- Key Destinations Markets
- Import Market Analysis
- Wholesale Price Trend Analysis and Forecast
- Regulatory Framework
- Logistics and Infrastructure
- Seasonality Analysis
- Production Analysis
Data Sources, Market Sizing, and Validation
Desk Research
Desk work starts by mapping the supply and demand flow for cashews into the United States, then converting that flow into a value series using observable prices. We draw on public agriculture and trade datasets such as USDA releases, USITC trade statistics, US Census Bureau trade tables, and UN Comtrade, and we also review FAOSTAT to cross-check upstream production signals.
To make the inputs usable in a market model, we combine these datasets with company annual reports, investor decks, and reputable press coverage of pricing, import conditions, and consumption trends. In a few places, paid subscription access to shipment-level import and export records and to company financials and news were used to confirm supplier mix, pack type references, and the timing of large trade shifts. The sources named here are illustrative, and we also relied on other public materials for data collection, validation, and research clarification.
Primary Interviews and Surveys
Primary work was used to pressure-test the desk model and fix the parts that are usually unclear in cashews, like the split between in-shell and shelled kernels, typical wholesale price movement, and how demand changes by channel. We spoke with stakeholders across import and trading, processing and packing, distribution, and large buyers in retail and foodservice. Coverage was also balanced across major consuming regions in the country so the final assumptions were not driven by one area.
Distribution of primary research fieldwork respondents
| Company type | Respondent position |
|---|---|
| Top tier: 26% | CXOs: 13% |
| Mid tier: 60% | Functional/Unit leaders: 43% |
| Smaller Players: 14% | Managers: 44% |
Market-Sizing & Forecasting
Sizing is built using a top-down approach where import flows, domestic availability signals, and consumption indicators are reconstructed into a United States value number, followed by selective bottom-up approximations to keep totals realistic. On the top-down side, the model tracks cashew import volumes, the in-shell versus shelled kernel mix, wholesale price trends, and channel demand shifts between retail packs and foodservice usage.
Once the demand pool is formed, volumes are converted to value using average price assumptions that reflect grade, pack type, and timing within the year. The outcome is then compared against quick supplier and channel checks, such as sampled price per pound by form and typical throughput assumptions at key handlers. When data is missing for a sub-slice, we fill gaps with proxy ratios from adjacent years or nearby trade categories, and then re-check the implied prices and volumes with interview feedback.
For forecasting, scenario analysis is used because cashew value is sensitive to a few practical drivers that change unevenly, like import price cycles, substitution with other nuts, and demand growth for snack mixes and plant-forward menus. The forward path is adjusted using expected shifts in form mix and channel recovery patterns that were repeatedly flagged in primary conversations.
Data Validation & Update Cycle
Outputs are triangulated across independent signals, including trade volumes, implied unit prices, and the direction of channel demand, and then variances are investigated before sign-off. When an input creates an unusual jump, we revisit the underlying series, re-check the conversion steps, and, where needed, re-contact a small set of respondents to confirm whether a one-time event or a real trend is being captured.
The study is refreshed annually, and interim checks are triggered when material events occur, such as sharp price movements, policy changes affecting trade, or visible shifts in import sourcing. Before delivery, a final analyst pass is completed so the update aligns with the latest available public releases and the most recent validation notes.
Mordor Intelligence's United States Cashew Market Size Compared With Other Published Estimates
Published market sizes for United States cashews often do not match because groups do not always count the same forms, value points, or time windows, and the price basis can differ when trade moves quickly. Differences also show up when one estimate is anchored in trade and wholesale signals, while another is built from broader packaged-food revenue views.
The table shows a wide spread, and under Mordor Intelligence's scope only in-shell cashews and shelled kernels are counted as the market, with value tied back to import volumes and wholesale price trend checks rather than adding revenue from cashew milk, spreads, or mixed snack products.
Benchmark comparison
| Source | Market Size | Gaps in Research Methodology |
|---|---|---|
| Mordor Intelligence | USD 1.32 B (2025) | |
| Industry Research Publisher A | USD 1.96 B (2025) | This estimate appears to use a wider application scope that can pull in downstream product revenues (for example, dairy substitutes, bakery, and beverages) rather than isolating the cashew ingredient value by form, which increases the total for the same year. |
| Industry Research Publisher B | USD 1.01 B (2024) | This figure is for an earlier year and may reflect a narrower pricing basis or a different treatment of imported volumes and in-shell conversion, which can reduce the value when the year chosen sits before a price upcycle. |
Taken together, the gap mostly comes from what is counted as the market and how value is assigned to cashews when they flow into mixed products. By keeping the steps traceable to import volumes, form mix, and observable price signals, our estimate stays easier to replicate and to update when trade and prices shift.
Key Questions Answered in the Report
How large will the United States cashew market be by 2031?
Value is projected to reach USD 1.77 billion by 2031 under a 4.99% CAGR.
Which form grows fastest through 2031?
In-shell cashews will expand at 8.40% CAGR, outpacing shelled kernels.
What drives demand beyond traditional snacking?
Rising plant-based protein adoption channels kernels into milk, cheese, and bar manufacturing.
How concentrated is supplier power today?
The top five companies command roughly 60-70% of revenue, indicating moderate concentration.
What technology improves premium-grade yield?
AI-powered optical sorters lift W180 and W240 recovery up to 18%, enhancing processor margins.
Which regions consume the most cashews?
California, the Northeast corridor, and the Pacific Northwest account for nearly 60% of national volume.