
Market Overview
| Study Period | 2021 - 2031 |
|---|---|
| Forecast Data Period | 2026 - 2031 |
| Base Year Market Size (2025) | USD 15.36 Billion |
| Market Size (2026) | USD 16.45 Billion |
| Market Size (2031) | USD 23.2 Billion |
| Growth Rate (2026 - 2031) | 7.12 % |
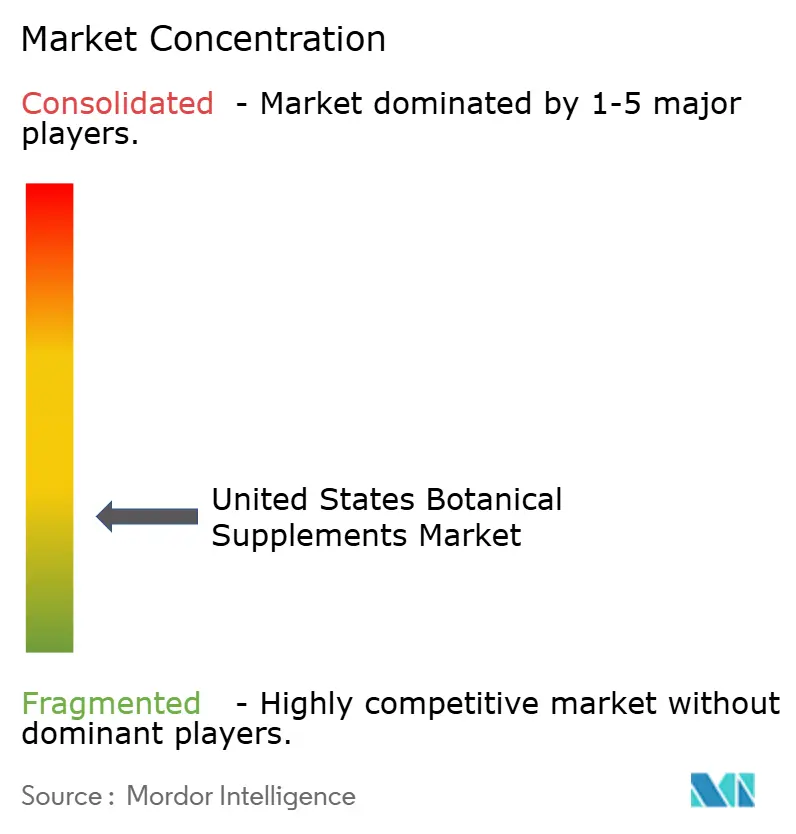
| Market Concentration | Low |
Major Players
*Disclaimer: Major Players sorted in no particular order Image © Mordor Intelligence. Reuse requires attribution under CC BY 4.0. |
|
United States Botanical Supplements Market Analysis by Mordor Intelligence
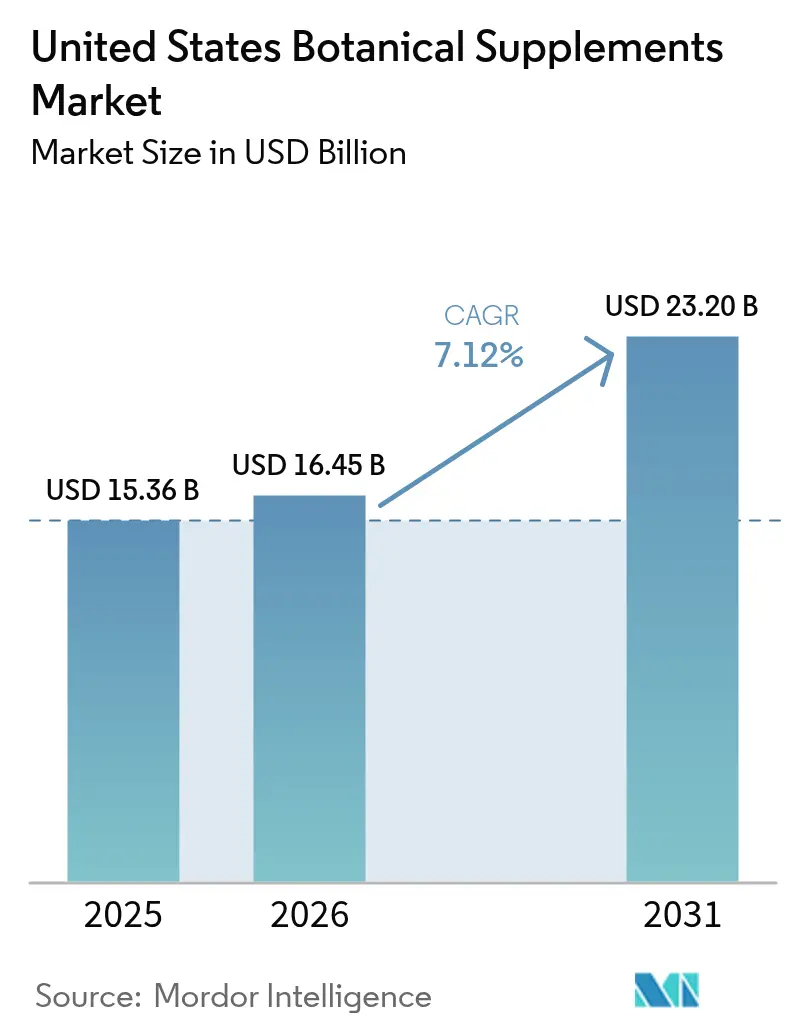
The United States botanical supplements market size is expected to grow from USD 15.36 billion in 2025 to USD 16.45 billion in 2026 and is forecast to reach USD 23.2 billion by 2031 at 7.12% CAGR over 2026-2031. The market growth is driven by increased consumer confidence in scientifically validated plant-based therapeutics, expanded clinical research supporting ingredients like ashwagandha and curcumin, and enhanced regulatory oversight. Consumer preferences are shifting toward products that combine traditional botanical knowledge with scientific validation, influenced by wellness trends and social media. The FDA's guidelines on New Dietary Ingredient notifications and the Botanical Drug Pathway have strengthened quality standards while establishing credibility for companies with comprehensive quality control systems[1]Source: Food and Drug Administration, “New Dietary Ingredient Notifications Draft Guidance,” fda.gov. The supply chain challenges for imported botanical materials have highlighted the advantages of vertically integrated companies that can ensure product authenticity and potency.
Key Report Takeaways
- By form, tablets led with 33.74% of the United States botanicals market share in 2025, while gummies and chews are forecast to expand at a 8.88% CAGR through 2031.
- By type, single botanicals accounted for 51.58% of the United States botanicals market size in 2025, whereas combination botanicals are projected to grow at an 8.63% CAGR to 2031.
- By functionality, immune support captured 37.15% of the United States botanicals market size in 2025, and stress-sleep-cognitive health is advancing at an 8.05% CAGR to 2031.
- By distribution channel, specialty and health stores held 35.66% revenue share in 2025; online retail records the fastest projected CAGR at 7.74% through 2031.
Note: Market size and forecast figures in this report are generated using Mordor Intelligence’s proprietary estimation framework, updated with the latest available data and insights as of 2026.
United States Botanical Supplements Market Trends and Insights
Drivers Impact Analysis*
| DRIVER | (~) % IMPACT ON CAGR FORECAST | GEOGRAPHIC RELEVANCE | IMPACT TIMELINE |
|---|---|---|---|
| Increasing consumer interest in holistic wellness approaches and traditional medicinal practices | +1.8% | National, with concentration in health-conscious metropolitan areas | Medium term (2-4 years) |
| Endorsement of herbal products by public figures and social media influencers | +0.9% | National, with higher impact in younger demographics | Short term (≤ 2 years) |
| Consumer preference shifting toward plant-based ingredients as alternatives to synthetic compounds | +1.5% | National, with premium market concentration in coastal regions | Long term (≥ 4 years) |
| Expanding elderly demographic seeks natural alternatives for managing chronic health conditions | +1.2% | National, with concentration in aging population centers | Long term (≥ 4 years) |
| Scientific research and clinical studies demonstrate the effectiveness of botanical ingredients | +1.1% | National, with institutional adoption in healthcare systems | Medium term (2-4 years) |
| Enhanced Regulatory Oversight and FDA Support for Botanical Ingredient Standards | +1.0% | National, with emphasis on regions housing major supplement manufacturers and research institutions | Medium term (2–4 years) |
| Source: Mordor Intelligence | |||
Increasing consumer interest in holistic wellness approaches and traditional medicinal practices
The integration of traditional medicine with modern wellness practices is driving significant demand for botanical supplements, as consumers increasingly seek alternatives to conventional healthcare approaches. According to the Council for Responsible Nutrition Survey 2023, 74% of adults in the United States use dietary supplements[2]Source: Council for Responsible Nutrition, "2023 CRN Consumer Survey on Dietary Supplements", www.crnusa.org. Companies are incorporating centuries-old Ayurvedic and Chinese medicine principles while adhering to stringent modern quality standards and safety protocols, enabling them to position products in premium market segments. Rising disposable income levels in health-conscious urban areas continue to support market expansion, while FDA recognition of botanical drugs strengthens their credibility and acceptance among healthcare professionals. Companies that effectively demonstrate product authenticity through transparent sourcing practices, documented supply chains, and scientifically proven effectiveness gain better retail shelf placement and enhanced online visibility across digital commerce platforms and social media channels.
Endorsement of herbal products by public figures and social media influencers
Social media is driving the mainstream adoption of botanical products, particularly among younger consumers who value peer recommendations over traditional medical advice. Influencer endorsements on social platforms have increased product awareness and sales, with platforms like Instagram and TikTok becoming primary channels. This trend presents both opportunities and challenges, as regulators increase their scrutiny of health claims made on social media. The FDA's monitoring of supplement marketing has intensified, requiring companies to implement comprehensive compliance protocols. Companies that effectively balance influencer partnerships with FDA compliance requirements gain competitive advantages through established legal frameworks and transparent marketing practices. Celebrity endorsements have notably increased the popularity of premium botanical products, such as functional gummies, which offer both social media appeal and ease of use. The influence-driven market segment remains volatile, with product demand shifting based on trending health topics rather than established clinical evidence, creating uncertainty in long-term market stability and consumer retention.
Consumer preference shifting toward plant-based ingredients as alternatives to synthetic compounds
The growing preference for plant-based products has expanded into the supplements market, as consumers thoroughly examine ingredient sources, production methods, and supply chain transparency. This trend drives significant advancements in botanical extraction technologies and increases demand for formulations with minimal synthetic additives. Companies are adopting improved extraction methods, including supercritical CO2 extraction and ultrasound-assisted techniques, that maintain bioactive compounds without chemical solvents to address consumer demands for processing purity. Organic certification, sustainable sourcing practices, and fair trade partnerships have become key market differentiators, with consumers accepting higher prices for botanicals meeting stringent environmental and ethical criteria. The plant-based trend also increases interest in traditional medicine botanicals from regions like Asia, Africa, and South America, creating opportunities for companies that effectively introduce and educate consumers about these ingredients through detailed documentation, scientific validation, and transparent sourcing information.
Expanding elderly demographic seeks natural alternatives for managing chronic health conditions
The United States' aging population drives demand for botanical supplements addressing age-related health concerns with minimal side effects compared to conventional pharmaceuticals. According to the United States Census Bureau, the population aged 65 and over increased by 9.4% from 2020 to 2023, reaching approximately 59.2 million people nationally[3]Source: United States Census Bureau, "Older Population Grew in Nearly All U.S. Metro Areas", census.gov. This growth occurred across all U.S. metropolitan areas, except Eagle Pass, Texas. Older consumers seek botanical supplements supporting cognitive function, memory enhancement, mental clarity, joint health, mobility, flexibility, and immune system maintenance. This demand has expanded product development in these categories. Healthcare providers increasingly accept botanical supplements as complementary treatments for chronic conditions and overall health maintenance, enhancing their credibility among older adults who previously used only prescription medications. This demographic's disposable income and emphasis on preventive healthcare have encouraged the development of premium botanical products targeting specific age-related conditions, including inflammation, bone density, and cardiovascular health. Manufacturers are also creating new delivery formats, including liquid extracts, easy-to-swallow capsules, sublingual drops, and powder formulations, to address the physical limitations and preferences of elderly consumers who struggle with traditional supplement forms.
Restraints Impact Analysis*
| RESTRAINT | (~) % IMPACT ON CAGR FORECAST | GEOGRAPHIC RELEVANCE | IMPACT TIMELINE |
|---|---|---|---|
| Risk of contamination and adulteration in raw botanicals hinders growth | -1.3% | National, with higher impact on imported botanical supply chains | Short term (≤ 2 years) |
| Seasonal and regional variability affects raw botanical supply | -0.8% | National, with concentration in agricultural regions | Medium term (2-4 years) |
| Presence of counterfeit products restricts growth | -0.7% | National, with higher impact in online retail channels | Short term (≤ 2 years) |
| Competition from alternative supplements hinders growth | -0.9% | National, with concentration in urban markets | Long term (≥ 4 years) |
| Source: Mordor Intelligence | |||
Risk of contamination and adulteration in raw botanicals hinders growth
Quality control challenges in botanical supply chains create significant barriers to market expansion, as contamination and adulteration issues affect consumer confidence and regulatory compliance. The industry faces systemic quality concerns, particularly regarding botanical extract overdilution, where manufacturers use excessive excipients and resell spent biomass. With FDA inspections covering only 5% of known dietary supplement facilities annually, enforcement gaps allow substandard products to enter the market. Botanicals sourced from regions with limited quality control infrastructure face higher contamination risks, requiring companies to make substantial investments in testing and verification systems. Growing consumer awareness of adulteration issues has increased demand for third-party certifications and transparent supply chain documentation, benefiting companies with comprehensive quality assurance programs. In response, the industry is adopting new authentication technologies, such as DNA barcoding and spectroscopic analysis, which increase operational costs but enable product differentiation.
Seasonal and regional variability affects raw botanical supply
Climate-dependent botanical harvests create supply chain volatility, constraining market growth and increasing pricing uncertainty for manufacturers and consumers. Supply disruptions in key botanicals demonstrate this vulnerability, as seen in the 2024 ginger production decline in Peru that created global supply gaps and affected product availability across multiple regions. Climate change intensifies these challenges, with research showing potential disruption of natural pollination processes, such as the risk of vanilla plants becoming separated from their pollinators, which could significantly impact future production capabilities and market stability. The seasonal variability particularly affects single botanical products, which lack ingredient substitution options when primary sources become scarce, leading to increased production costs and potential market shortages. Companies are addressing these challenges by diversifying their sourcing locations across different geographical regions and implementing vertical integration strategies to gain better control over their supply chains, though these approaches require substantial capital investment and long-term planning.
*Our forecasts treat driver/restraint impacts as directional, not additive. The impact forecasts reflect baseline growth, mix effects, and variable interactions.
Segment Analysis
By Type: Single Botanicals Dominate Despite Combination Growth
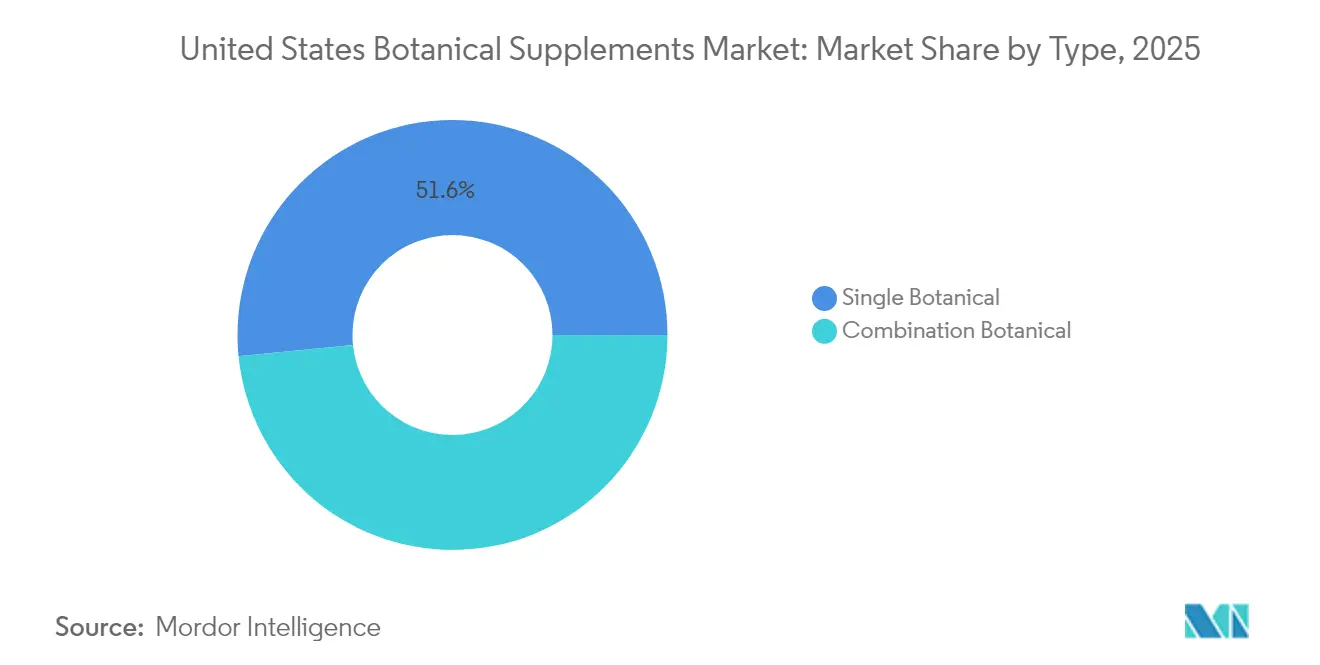
Single botanicals account for 51.58% of the United States botanicals market in 2025, as consumers increasingly gravitate toward products with transparent and easily understandable benefit statements. Extensive scientific research and clinical validation supporting key ingredients like ashwagandha, elderberry, and turmeric continue to drive consistent consumer repurchases. While combination products represent a smaller market share, they are projected to grow at an 8.63% CAGR by offering comprehensive adaptogenic blends that simultaneously address multiple health concerns, including stress management, digestive wellness, and immune system support in single formulations.
Single-ingredient products provide manufacturers with streamlined FDA compliance processes compared to multi-component formulations, which must navigate more complex notification requirements and regulatory frameworks. However, combination formulas enable retailers to enhance sales performance through strategically positioned multi-benefit products and potentially higher average order values in the United States botanicals market. Manufacturers develop sophisticated targeted combinations such as ashwagandha with L-theanine and magnesium for comprehensive stress management, or curcumin with Boswellia for complete joint support, effectively addressing consumers' increasingly complex and interconnected health concerns.


By Form: Tablets Lead While Gummies Transform Delivery
Tablets account for 33.74% of the United States botanicals market share in 2025, driven by their cost efficiency and precise dosing capabilities. The tablet format offers manufacturers significant advantages in production scalability and shelf stability. They remain the primary format for curcumin and herbal extracts that require standardized high-milligram doses, particularly for ingredients sensitive to moisture and oxidation. The gummies and chews segment is experiencing rapid growth at a 8.88% CAGR through 2031, as manufacturers address bioavailability challenges and reduce sugar content while maintaining palatability and consumer appeal.
Advancements in gummy production incorporate pectin bases, vegan colorants, and microencapsulated active ingredients that maintain stability during high-temperature manufacturing processes. These technological improvements enable better nutrient retention and enhanced absorption rates. Capsules and softgels maintain their market position through features such as odor-masking coatings and immediate-release shells, offering superior protection for volatile compounds and oils. Powder formats attract fitness enthusiasts who incorporate adaptogens into their smoothies, providing flexibility in serving size and blend customization. The diverse range of delivery formats in the United States botanicals market accommodates various consumer preferences and daily routines, from convenience-oriented users to those seeking specific therapeutic benefits.
By Functionality: Immune Support Leads as Stress Management Accelerates
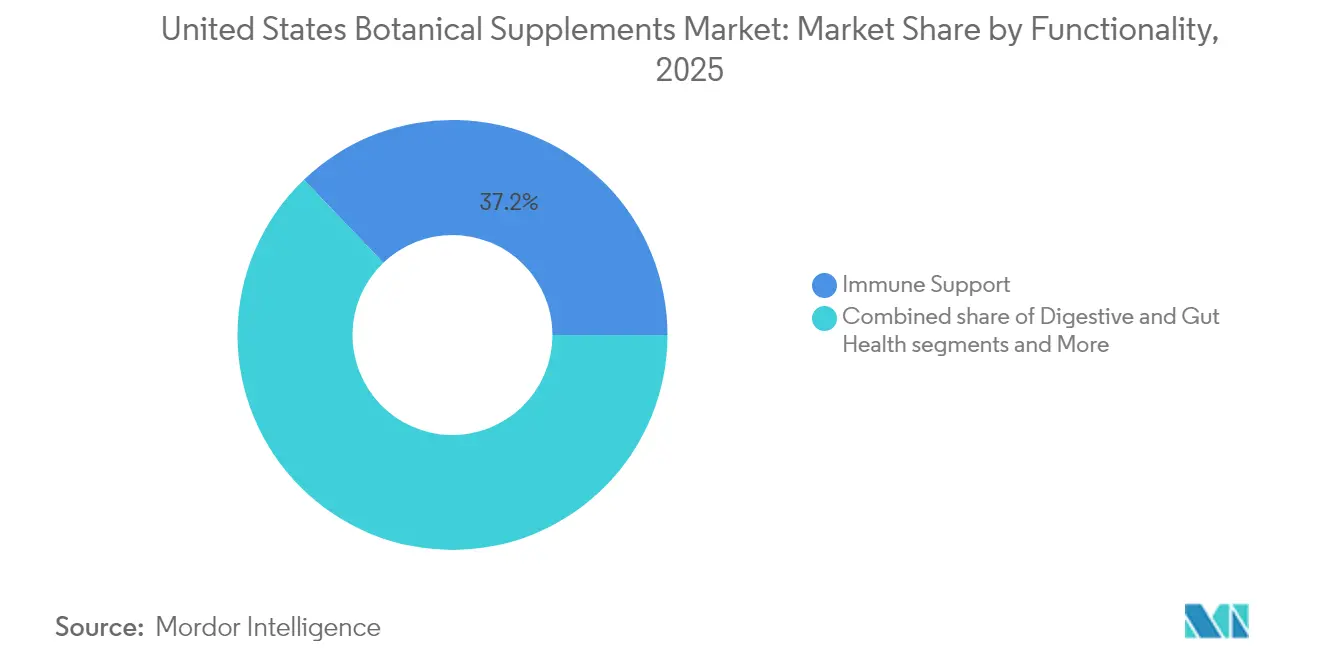
Immune products accounted for 37.15% of the United States botanicals market size in 2025, driven by increased consumer health awareness following COVID-19. The category prominently features elderberry, echinacea, and beta-glucan formulations, with elderberry demonstrating particular market strength. An MDPI meta-analysis validated elderberry's effectiveness in reducing respiratory infection duration through enhanced immune response mechanisms and decreased inflammatory markers. Consumer demand for these immune-supporting botanicals continues to rise, particularly in supplement and functional food applications.
The stress-sleep-cognitive health segment is projected to grow at 8.05% CAGR, supported by comprehensive workplace wellness programs and burnout prevention initiatives across industries. Ashwagandha is the main ingredient in mood supplements, with clinical studies documenting its significant cortisol reduction benefits and stress-alleviating properties. Research indicates improved sleep quality and reduced anxiety levels among regular users. Digestive health supplements combining probiotics with traditional botanicals like peppermint or ginger are expanding their presence in mainstream grocery retail channels. This expansion includes new product formats such as gummies and beverages, increasing consumer accessibility and driving sustained growth in the United States botanicals market.
By Distribution Channel: Specialty Stores Anchor While E-commerce Surges
Specialty and health stores accounted for 35.66% of revenue in 2025 through their highly trained staff and carefully selected product assortments that build consumer trust in high-potency botanical products. These brick-and-mortar retailers strengthen customer loyalty by conducting comprehensive live seminars and educational workshops on botanical benefits, therapeutic applications, and proper usage guidelines. Online sales are projected to grow at a 7.74% CAGR through 2031 as consumers increasingly prefer the convenience of doorstep delivery, detailed product information, and verified customer reviews.
Amazon's 2024 policy requiring Certificates of Analysis for supplements eliminates substandard sellers while benefiting established brands that invest in rigorous quality testing and compliance measures. Direct-to-consumer websites gather extensive first-party consumer data and combine subscription services with personalized wellness coaching programs. While mass supermarkets maintain their presence in entry-level botanicals, they continue to lose market share in premium and clinically validated segments of the United States botanicals market due to limited product expertise and specialized inventory.
Geography Analysis
Urban coastal areas, with their affluent populations and concentrated wellness retailers, are fueling a surge in botanical spending. Notably, California and New York, together, rake in almost a third of the country's specialty store revenue. These states prominently feature innovative functional beverages infused with adaptogens, which are gaining popularity for their stress-relieving and health-boosting properties. The dense network of wellness-focused retailers in these regions further supports the growth of premium botanical products.
As online education and telehealth endorsements boost botanical awareness, Midwestern and Southern states emerge as prime expansion territories. While Texans and Floridians embrace elderberry syrups for colds and turmeric capsules for joint health, they exhibit a heightened price sensitivity compared to their coastal counterparts. However, increasing consumer literacy about the benefits of botanicals in these regions is gradually driving demand, presenting significant opportunities for market players to expand their footprint.
State-specific regulatory intricacies come into play, with Utah and Colorado adding extra registration layers, inflating compliance costs. These additional requirements often necessitate higher investments in regulatory expertise and documentation. Manufacturers strategically set up production near New Jersey and Wisconsin's established pharmaceutical hubs, tapping into their advanced analytical labs and skilled workforce to streamline operations. As logistics improve and e-commerce deepens, regional availability gaps shrink, enabling broader access to botanical products. This trend is accelerating the growth and adoption of the U.S. botanicals market across diverse regions.
Regulatory Landscape
Dietary supplements in the United States are regulated by the US Food and Drug Administration (FDA) under the Dietary Supplement Health and Education Act (DSHEA), with oversight managed through the FDA Human Foods Program and its Office of Dietary Supplement Programs. A key current focus is how modern manufacturing technologies fit within the statutory definition of dietary ingredients, highlighted by the FDA public meeting held in March 2026 on exploring the scope of dietary supplement ingredients, including precision fermentation and cell culture. This direction shapes how novel botanical actives and formats are substantiated and positioned.
Regulatory expectations continue to emphasize substantiation, labeling compliance, and quality systems, with New Dietary Ingredient (NDI) pathways remaining a central compliance lever for companies introducing or reformulating botanicals. In 2024, the FDA also advanced its policy toolkit through NDI-related guidance work, including procedures/timeframes and master file concepts, which raises the bar for documentation and traceability. In practice, this can benefit manufacturers with strong identity testing, supplier qualification, and end-to-end quality control for botanicals and extracts.
Competitive Landscape
The United States botanicals market is fragmented, creating significant opportunities for market consolidation and the development of specialized niche products. Prominent players in the market include Amway Corporation, Herbalife International of America Inc., Harbin Pharmaceutical Group, and Nestle S.A. Major companies such as Otsuka Pharmaceutical Co., Ltd, and Nestle S.A. maintain their market positions through extensive distribution networks, established brand presence, and substantial retail footprints. Meanwhile, newer companies differentiate themselves through innovations in ingredient sourcing, advanced product formulations, enhanced delivery formats, and comprehensive scientific validation processes.
The market's competitive dynamics are continuously evolving as pharmaceutical companies enter through strategic acquisitions and partnerships, bringing substantial financial resources, advanced research capabilities, and extensive regulatory expertise. Companies now compete primarily on quality assurance and supply chain transparency, investing heavily in vertical integration strategies and sophisticated testing technologies to minimize contamination risks and ensure product consistency. The integration of advanced technologies, including artificial intelligence for comprehensive safety monitoring and blockchain systems for end-to-end supply chain verification, is fundamentally reshaping competitive advantages through enhanced consumer trust and stringent regulatory compliance.
Additionally, direct-to-consumer business models enable smaller companies to effectively compete with established brands by offering highly specialized products, customized formulations, and personalized customer experiences that extend beyond traditional retail capabilities. This shift in distribution strategy has created new opportunities for market penetration and customer engagement.
United States Botanical Supplements Industry Leaders
-
Amway Corporation
-
Herbalife International of America, Inc.
-
Harbin Pharmaceutical Group
-
Nestlé S.A (Nature's Bounty)
-
NOW Foods (NOW Health Group, Inc)
- *Disclaimer: Major Players sorted in no particular order

Market Opportunities and Future Outlook
Opportunities are concentrated around products and business models that align consumer demand with tighter quality expectations, particularly in high-velocity benefit areas such as immune support and stress-sleep-cognitive health, and in fast-growing delivery formats such as gummies and chews. This compliance and transparency push is a commercial lever in online retail and marketplaces, supported by retailer-platform controls such as Amazon's 2024 requirement for Certificates of Analysis for supplements. That environment can create whitespace for brands that operationalize routine third-party testing, authenticated botanicals, and consistent label-claim substantiation.
Ingredient innovation and standardization are also active areas, alongside continued regulator-industry discussion on what qualifies as a dietary ingredient under DSHEA. The FDA-hosted March 2026 public meeting on the scope of dietary supplement ingredients, including precision fermentation and cell culture, indicates ongoing engagement on how modern production methods may be handled within identity and safety frameworks. At the same time, clinical validation and phytomedicinal research investment provides differentiation for botanical brands, supported by industry recognition of research-focused programs such as the American Botanical Council awards in 2026 and commercialization emphasis on clinically supported botanicals (for example, ashwagandha and curcumin) that are already familiar to US consumers.
Recent Industry Developments
- April 2026: Herbalife completed the acquisition of Bioniq's personalized nutrition business, following its March 2026 definitive agreement to acquire assets from the UK-based personalized supplement company. The transaction expands Herbalife's technology-enabled, data-driven personalization capabilities, strengthening its ability to tailor supplement regimens and deepen direct-to-consumer engagement in core wellness categories.
- July 2025: Herbalife launched MultiBurn, a botanical-based dietary supplement formulated with ingredients including Moro blood orange extract, hibiscus, and lemon verbena. The launch broadened its weight-management and metabolic support offering and underscored continued investment in botanically positioned, science-led products within mainstream supplement portfolios.
- December 2024: Nature's Bounty introduced a plant-based omega-3 dietary supplement derived from algae oil. This supported portfolio expansion into plant-based positioning and provided an alternative supply route versus traditional fish oil, aligning with consumer preference shifts toward plant-forward and sustainably sourced supplement options.


Research Methodology Framework and Report Scope
Market Definition and Coverage
This market covers the sales value of botanical supplements in the United States, meaning finished dietary supplement products where the main active ingredients are plant based botanicals, sold through retail and online channels.
Scope exclusions: we do not count botanical prescription drugs, conventional foods and beverages with botanicals, or raw herb ingredients traded only for industrial processing.
Segmentation Overview
-
By Type
-
Single Botanical
- Turmeric
- Cannabidiol
- Mushrooms
- Ashwagandha
- Psyllium
- Elderberry
- Apple Cider Vinegar
- Cranberry
- Others
- Combination Botanical
-
Single Botanical
-
By Form
- Tablets
- Capsules/Softgels
- Gummies and Chews
- Powders
- Others
-
By Functionality/Health Benefits
- Digestive and Gut Health
- Stress, Sleep and Cognitive Health
- Immune Support
- Others
-
By Distribution Channel
- Supermarkets/Hypermarkets
- Specialty and Health Stores
- Online Retailers
- Other Distribution Channels
Data Sources, Market Sizing, and Validation
Desk Research
Desk research was used first to set the market boundaries and to map demand and channels for botanical supplements in the United States. We leaned on public health and regulatory references to understand what is marketed as a dietary supplement, and how botanical ingredients are treated for labeling and safety, which helps avoid mixing adjacent product types.
For data inputs, we referred to non paywalled sources such as FDA dietary supplement guidance and enforcement updates, NIH Office of Dietary Supplements ingredient fact sheets, USDA economic and trade statistics where relevant for botanical raw materials, USITC trade data for herbal extracts and related imports, and peer reviewed journals that cover usage patterns and ingredient level evidence. We also used company filings, investor presentations, and reputable industry press to cross check portfolio mix and channel strategies, and a paid subscription focused on company financials and patent databases to confirm product activity signals. This list is not exhaustive, and many other sources were reviewed for data collection, validation, and clarification.
Primary Interviews and Surveys
Primary work focused on interviews and surveys with brand owners, contract manufacturers, ingredient distributors, and retail channel participants, so that pricing logic and volume direction could be validated beyond what is visible in public sources. Because the scope is US only, the discussion centered on channel dynamics across supermarkets, pharmacies, and online, then followed checks on which botanicals are gaining and what claims are supporting repeat purchases.
Distribution of primary research fieldwork respondents
| Company type | Respondent position |
|---|---|
| Top tier: 30% | CXOs: 15% |
| Mid tier: 49% | Functional/Unit leaders: 28% |
| Smaller Players: 21% | Managers: 57% |
Market-Sizing & Forecasting
Our sizing starts with a top-down build that reconstructs the US botanical supplement demand pool from channel level consumption and retail value flows, and then it is adjusted to reflect what is realistically sold as botanical dietary supplements. To keep the totals grounded, we used selective bottom-up checks such as sampled price per unit by form (capsules, tablets, gummies, powders), multiplied by observed sales volumes, and brand level roll ups where public disclosures allowed.
Key model inputs included shifts in channel mix between pharmacies, supermarkets, and online, form mix changes (for example, gummies gaining share), typical price bands by form and positioning, the pace of new ingredient launches and reformulations, and the timing of regulatory actions that can constrain or release supply. Where gaps appeared in smaller channels or in niche botanicals with limited disclosure, we used proxy shares from comparable products, and then rechecked them with interview feedback before finalizing.
For forecasting, scenario analysis was applied around a base case reflecting expected consumer wellness demand and stable channel growth. Upside and downside cases were tied to pricing inflation and ingredient availability constraints, then the final outlook was refined with expert views on which forms and claims are likely to expand fastest over the next cycle.
Data Validation & Update Cycle
Validation was done through triangulation across the model output, observed channel trends, and independent demand signals to test whether the direction was plausible. Large variances were flagged, investigated, and corrected through follow up checks, including re-contact when an assumption on pricing, channel shares, or form mix appeared misaligned.
Before sign off, the model and assumptions go through multi step analyst review to keep calculation logic, units, and conversions consistent across years. Reports are refreshed annually, with interim updates when material events occur, and a final fresh pass is completed right before delivery so clients receive the latest updated view.
Mordor Intelligence's United States Botanical Supplements Market Estimate Compared With Other Published Estimates
Published market sizes for US botanical supplements can differ because the product boundary is not uniform, and the same ingredient can sit inside supplements, foods, or even drug pathways depending on how it is sold. Differences also show up when one source relies more on retail scanner coverage while another uses broader channel assumptions, and when price inflation is treated as a simple uplift rather than being tied to form and channel shifts.
By tracking channel wise sales splits, refreshing form level average selling prices, and applying a clear supplement only inclusion rule, Mordor Intelligence keeps the total tied to finished botanical supplement demand rather than broader botanicals sold in foods or medical products. Gaps also come from whether estimates include direct to consumer models fully, how they treat combination botanicals versus single botanicals, and which currency timing and update cadence is used for the current year.
Benchmark comparison
| Source | Market Size | Gaps in Research Methodology |
|---|---|---|
| Mordor Intelligence | USD 15.36 B (2025) | |
| Industry Association A | USD 13.23 B (2024) | Often represents retail sales tracking for herbal supplements and may undercount private label, newer online first brands, and some specialty channels, which can leave out parts of combination botanical products. |
| Trade Journal B | USD 13.57 B (2024) | May use a narrower ingredient basket and a faster, assumption driven price uplift, and it can blend herbal supplements with a broader botanicals definition without fully separating non supplement uses. |
The spread in the table mainly reflects scope choices and how channel coverage is handled for online and direct models. When the boundary is kept consistent and checked against channel signals and realistic pricing by form, the estimate becomes easier to trace and repeat across update cycles.


Key Questions Answered in the Report
What is the current value of the United States botanicals market?
The market reached USD 16.45 billion in 2026 and is forecast to rise to USD 23.2 billion by 2031.
Which form factor leads sales today?
Tablets hold the largest share at 33.74% of United States botanicals market share, favored for dose accuracy.
Why are gummies growing so quickly?
Gummies post a 8.88% CAGR because they combine flavor, convenience, and social media appeal while now delivering clinically relevant doses.
Which functionality segment is expanding the fastest?
Stress-sleep-cognitive health products lead growth at an 8.05% CAGR as workplace wellness and mental health awareness rise.
Page last updated on:


 Your data is secure and never sold or shared.


