
United States Blueberry Market Analysis by Mordor Intelligence
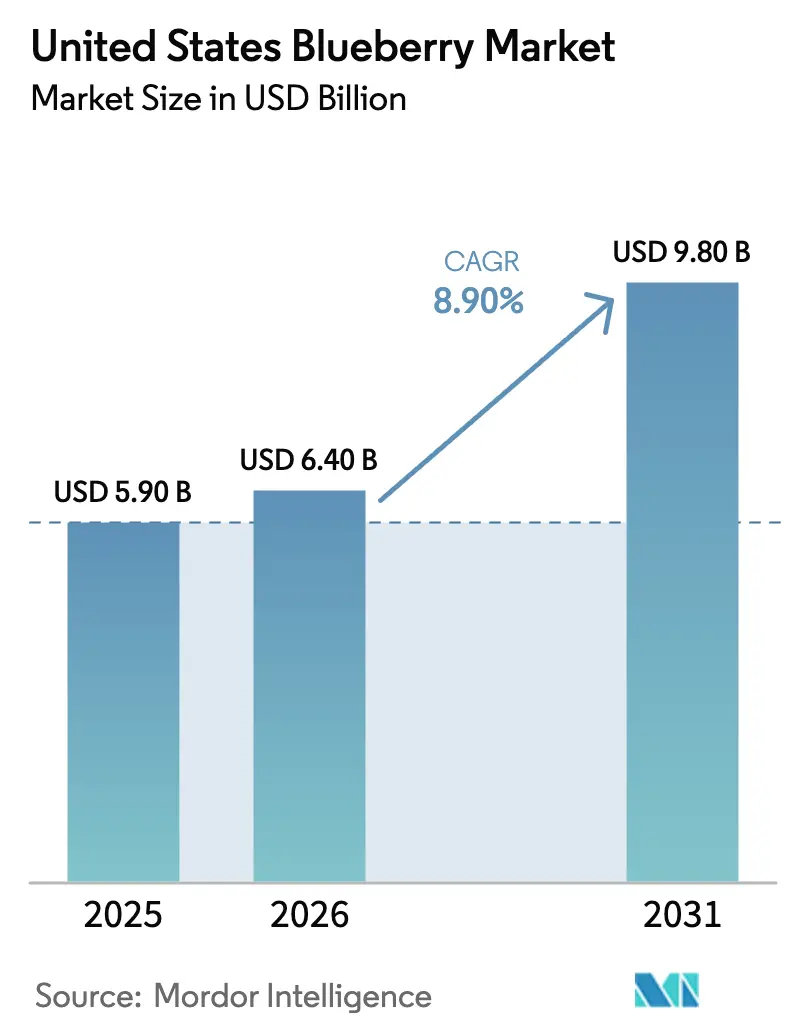
The United States blueberry market size was valued at USD 5.90 billion in 2025 and is estimated to reach USD 6.40 billion in 2026, further projected to grow to USD 9.80 billion by 2031, advancing at a compound annual growth rate (CAGR) of 8.90% during the forecast period (2026–2031). Momentum stems from a nine-fold increase in per-capita intake since 2000, steady retail adoption of premium clamshells at nearly USD 6, and the blending of domestic harvests with counter-seasonal imports to secure year-round shelf presence. Peruvian supply filled roughly 57% of its export volume to the United States in 2024, but a 10% tariff introduced in 2025 is redirecting metric-ton flows toward China[1], thereby tightening United States inventories during the period from September to April. On the domestic front, cultivated acreage reached 104,800 acres in 2024, accounting for 40% of all berry plantings[2]. However, labor scarcity, pest losses exceeding USD 718 million annually, and California water costs of up to USD 2,000 per acre-foot are constraining yield gains, despite the emergence of high-tunnel and container systems that can potentially double open-field output. Competitive pressure is intensifying as Driscoll’s and Agroberries expand their proprietary genetics and vertically integrated supply chains, while mechanization reduces Oregon harvest costs from USD 1,323 to USD 331 per metric ton, delivering close to USD 10 million in annual statewide savings. Finally, the launches of functional beverages and the dietary habits of glucagon-like peptide-1 (GLP-1) medication users are opening ancillary demand channels that blur the lines between produce and wellness categories, lifting elasticity for premium fruit.
Key Report Takeaways
By source, counter-seasonal imports accounted for 62.0% of the United States blueberry market share in 2025, while the domestic supply is projected to grow at an 8.9% CAGR through 2031.
Note: Market size and forecast figures in this report are generated using Mordor Intelligence’s proprietary estimation framework, updated with the latest available data and insights as of January 2026.
United States Blueberry Market Trends and Insights
Drivers Impact Analysis*
| Driver | (~) % Impact on CAGR Forecast | Geographic Relevance | Impact Timeline |
|---|---|---|---|
| Rising consumer focus on antioxidant-rich foods | +1.2% | National and strongest in urban coastal markets | Medium term (2-4 years) |
| Growth in controlled-environment agriculture acreage | +1.5% | Pacific Northwest, Southeast, and Midwest tunnel clusters | Long term (≥ 4 years) |
| Inclusion of blueberries in functional beverage launches | +0.8% | National, led by wholesale clubs and natural-food chains | Short term (≤ 2 years) |
| Expansion of domestic high-yield highbush cultivars | +1.3% | Florida, Georgia, and California early adopters | Medium term (2-4 years) |
| Retailer private-label promotion and price locks | +0.9% | National, concentrated in Walmart, Costco, and Kroger | Short term (≤ 2 years) |
| Genomic-assisted breeding cutting time-to-market for new varieties | +0.8% | Research hubs in Florida, Michigan, and United States Department of Agriculture - Agricultural Research Service sites | Long term (≥ 4 years) |
| Source: Mordor Intelligence | |||
Growth in Controlled-Environment Agriculture Acreage
Controlled-environment setups, such as high tunnels and substrate containers, are helping growers extend their harvest calendars and secure premiums when supply is tight. These structures can move the picking window up by four to five weeks compared with open-field rows, putting domestic fruit on shelves before Peruvian arrivals swell the September-April market. USDA data counted 104,800 cultivated blueberry acres in 2024, a 2% increase over 2023, with a rising share of that gain attributed to protected systems across the Southeast and Pacific Northwest. Container production that relies on five- to seven-gallon pots filled with coconut coir or peat moss maintains a pH between 4.5 and 5.5 and an electrical conductivity of less than 2.0 deciSiemens per meter, benchmarks that are challenging to achieve in the alkaline soils of many Midwestern sites. Densities can reach 10,976 plants per hectare, yet outlays often exceed USD 120,000 per hectare, limiting uptake to operations with strong capital access or channels that reward premium fruit. Rising wages and the increasing availability of soft-catch harvesters will enhance the appeal of controlled environments; however, smaller farms may remain in open fields due to upfront costs and the need for cultivar matching.
Expansion of domestic high-yield highbush cultivars
Marker-assisted breeding from university partnerships is rolling out Farthing, Chickadee, and Meadowlark lines that deliver firmer berries and longer shelf life. Southern highbush cultivars thrive in low-chill regions, with Florida’s FasTrack program cutting the juvenile phase to under one year. Yield improvements close the historical gap where Peruvian fields produced nearly double per-hectare volumes. Replanting costs of nearly USD 120,000 per hectare constrain rapid turnover. However, payback periods shorten as price stability improves and input costs level off.
Retailer Private-Label Promotion and Price Locks
Private-label blueberries, priced 15-25% below branded clamshells, held a combined 55% share at Walmart, Costco, and Kroger in 2025. Price commitments shield shoppers from seasonal swings but move margin pressure to packers. Retailers that locked in multi-year supply during the 2025 Peruvian tariff maintained facings, while competitors scrambled. As penetration increases, smaller growers without scale must pivot toward direct-to-consumer models or niche organic markets.
Genomic-assisted breeding cutting time-to-market for new varieties
CRISPR-Cas9 edits achieved efficiencies of up to 23% in USDA trials, and the USD 6.4 million VacciniumCAP consortium aligns genomic selection pipelines to predict seedling performance. Pangenome assemblies pinpoint loci for firmness and acidity, enabling breeders to release cultivars that withstand mechanical harvest[3]. State-level labeling rules and import regulations may fragment early adoption, but growers in permissive jurisdictions can secure a lead on premium genetics.
Restraints Impact Analysis*
| Restraint | (~) % Impact on CAGR Forecast | Geographic Relevance | Impact Timeline |
|---|---|---|---|
| Labor shortages during peak harvest windows | -0.7% | Pacific Northwest, Southeast, and California | Short term (≤ 2 years) |
| Spotted-wing drosophila and emerging fungal pathogens | -0.6% | Pacific Northwest, Great Lakes, and national | Medium term (2-4 years) |
| Rising competition from Peru-origin counter-seasonal berries | -0.5% | Import-dependent regions nationwide | Medium term (2-4 years) |
| Water-use restrictions in California growing regions | -0.2% | Central Valley and southern coastal districts | Long term (≥ 4 years) |
| Source: Mordor Intelligence | |||
Labor shortages during peak harvest windows
Soft-catch machines reduced Oregon picking costs around USD 0.33 per kg, saving USD 10 million annually, yet installations run above USD 200,000, and many legacy blocks lack uniform ripening traits. Immigration policy uncertainty and competition from higher-paying crops reduce crew availability, leading to rushed picking that compromises berry size and firmness. Robotics remains in its prototype stage, leaving growers vulnerable to wage inflation and unharvested fruit.
Spotted-wing drosophila and emerging fungal pathogens
Economic losses top USD 718 million yearly as the insect lays eggs in ripening fruit. Exclusion netting costs roughly USD 6,100 per acre and is prohibitive for conventional operations. Fungicide rotations are facing rising resistance, and climate change is extending the range of pests northward. Growers without rigorous monitoring can lose up to 30% of their crop, discouraging new plantings.
*Our forecasts treat driver/restraint impacts as directional, not additive. The impact forecasts reflect baseline growth, mix effects, and variable interactions.
Geography Analysis
Regional production is anchored in Washington, Oregon, Michigan, Georgia, and Florida, with each region tailoring cultivar choices to its local chill-hour profiles. Pacific Northwest farms enjoy temperate summers and access to irrigation, enabling both fresh and processed streams. Southeast orchards capitalize on mild winters to enter the market ahead of Peruvian arrivals, commanding premiums for early fruit. Michigan channels substantial output into frozen supply for food service and bakery clients, while California’s acreage remains limited by water constraints and competition from higher-margin strawberries. The 18% acreage growth since 2017 is slowing as pest pressure, labor scarcity, and groundwater caps emerge.
Urban coastal markets exhibit the highest per-capita consumption, driven by health-conscious demographics and the dominance of chains that offer private-label programs. Fruitist distributes into 12,500 North American locations, illustrating how vertically integrated suppliers meet the volume and quality requirements of national retailers. Food-service demand is concentrated in metropolitan areas where smoothies, salads, and baked goods featuring blueberries are available year-round. Income and education levels correlate with higher blueberry consumption, indicating potential for improvement in rural and lower-income areas.
Import reliance is most pronounced in the Northeast and Midwestern states during the September–April off-season, when domestic harvests decline. Ports at Los Angeles, Miami, and Newark handle the bulk of arrivals, and cold-chain integrity at these nodes governs retail shelf life. If Peruvian shipments retreat because of continued tariffs, regions with limited local production risk price spikes and potential shortages, whereas Southeast and Pacific Northwest growers may lengthen their seasons under tunnels to capture new demand.
Regulatory Landscape
The United States blueberry market is governed by USDA oversight across marketing, quality, and industry funding. Under the USDA Agricultural Marketing Service (AMS), blueberries are covered by grade standards used in trade, while the Blueberry Promotion, Research, and Information Order (7 CFR Part 1218) funds industry promotion and research through an assessment framework covering qualifying producers and importers. In May 2026, AMS published a notice for a continuance referendum for the Order, with voting scheduled for July 13 to July 24, 2026, for producers and importers who handled 2,000 pounds or more of highbush blueberries in 2025. This sets a clear milestone for the program that supports category-wide marketing and research activities.
Trade and plant health rules also shape off-season supply. In February 2026, a 10% ad valorem import duty was applied to fresh and frozen blueberry imports from Peru and Chile, effective February 24, 2026, under Section 122 of the Trade Act of 1974, with an expiration date of July 20, 2026. USDA APHIS plant-import requirements and commodity approval processes set phytosanitary compliance expectations, including inspection and permitted import pathways, which affect importer documentation, port clearance, and residue-risk management. On the farm side, USDA Risk Management Agency (RMA) issued the Blueberry Loss Adjustment Standards Handbook in August 2024, effective for the 2025 and succeeding crop years, shaping how insured losses are adjusted for growers.
Value Chain Analysis
The United States blueberry value chain runs from input suppliers (nurseries and genetics developers, substrate and fertilizer suppliers, and crop protection providers) to growers operating open-field and protected systems. It then moves through handlers/packers that manage grading, clamshell packing, and cold storage, followed by logistics providers that execute refrigerated trucking and port cold-chain. Downstream, retail (especially large chains with private-label programs), food service, and processors (frozen and ingredient uses) determine how much volume and consistency the upstream parties must deliver. The September to April window relies on counter-seasonal importers and marketer networks, so the entry points and cold-chain performance at major nodes influence shrink and shelf life.
Coordination and data flow are increasingly centralized through the U.S. Highbush Blueberry Council (USHBC) under the USDA AMS Research and Promotion program. The program is funded by an assessment of USD 18 per ton on domestic highbush production and imports for handlers meeting the 2,000+ pound annual threshold. USHBC's BerrySmart Insights aggregates production, pricing, and retail performance data from participating members, which helps growers, marketers, and retailers plan. The chain is also tightening breeder-grower-retailer linkages around branded proprietary varieties, including collaborations that moved new genetics into major retail distribution, such as Fall Creek Farm and Nursery working with Twin River Berries and Sprouts Farmers Market on PeachyBlue placements, alongside multi-region sourcing strategies that bridge New Jersey, Michigan, and the Pacific Northwest for seasonal continuity.
Competitive Landscape
The United States blueberry market is increasingly characterized by vertical integration, with major players managing breeding, production, packing, and distribution to ensure consistent quality and a year-round supply. Prominent marketers, such as Driscoll's Inc. and Naturipe Farms LLC, utilize extensive grower networks and counter-seasonal sourcing to stabilize supply volumes and meet retailer demands, creating significant competitive barriers for smaller market participants.
Competition in the market revolves around proprietary genetics, control over cold-chain and packing infrastructure, and direct alignment with retailers. Breeding programs focus on traits such as firmness, shelf life, sweetness, and compatibility with mechanical harvesting, which help reduce shrinkage and enhance product consistency. These capabilities increasingly set large, vertically integrated suppliers apart from independent growers and regional packers.
Automation and digitalization are transforming cost structures and operational efficiencies in the market. Soft-catch harvesting systems and post-harvest automation reduce reliance on labor, while traceability and logistics platforms enhance supply chain transparency. Although controlled-environment production presents opportunities for new entrants, the high capital investment required continues to favor well-capitalized, vertically integrated operators.
Market Opportunities and Future Outlook
Mechanization and precision-ag technologies create a clearer labor-driven opportunity, especially in segments where fresh-market quality has historically limited machine use. A 2026 proof point is Pinebloom Farms commercial-scale integration of FineField mechanical harvesters and autonomous Burro carts in Southwest Georgia, which shows movement from trials to operational deployment. In parallel, the USHBC-led BerrySmart Field project (with innov8.ag) uses AI-assisted yield forecasting, satellite imagery, and high-resolution soil mapping, creating an adoption pathway for growers and handlers focused on tighter harvest timing, labor planning, and improved pack-out consistency.
Near-term commercial openings are also being shaped by imports and by differentiated product formats. The market recorded 719.8 million pounds of blueberry imports in 2025, while domestic fresh shipments declined versus 2024 across most surveyed states, with exceptions such as Oregon and New Jersey. That pattern underscores the role of off-season sourcing, but it also points to the need for domestic supply to defend shelf space through quality and consistency. Differentiation is extending beyond commodity clamshells into wellness-oriented positioning, supported by company initiatives such as California Giant Berry Farms introducing a probiotic-infused fresh blueberry product (Belli Berries), which broadens routes to premium pricing.
Recent Industry Developments
- July 2026: SanLucar acquired a controlling stake in Twin River Berries, a US-based berry grower and marketer. The deal strengthens SanLucars North American footprint and adds a platform for year-round blueberry programs that can also serve Asian channels. The move reinforces consolidation among marketers that want tighter control over supply, packing, and customer programs.
- October 2025: Fruitist raised USD 150 million in financing led by J.P. Morgan to expand jumbo-blueberry acreage, cold storage, and post-harvest automation across its United States farms. The investment supports higher-throughput packing and improved cold-chain capacity, which are central to maintaining quality and reducing shrink for national retail distribution. It also raises the competitive bar for smaller shippers that lack comparable capital for automation and storage.
- September 2024: Agroberries acquired BerryWorld, creating a larger berry marketer with significant blueberry operations across Washington, Oregon, California, and Florida. The combination expanded cooling and distribution coverage that shortens harvest-to-shelf time and supports retailer service levels. It also increased the influence of vertically integrated players that combine acreage, proprietary programs, and logistics to secure multi-season contracts.
Research Methodology Framework and Report Scope
Market Definition and Coverage
For this study, the market is defined as the value generated from blueberries sold within the United States across the supply chain that serves domestic consumption, including domestically grown and imported blueberries, across main commercial forms sold to buyers.
Scope exclusions: We exclude downstream products where blueberry is only a minor ingredient (such as flavored snacks and supplements) and we do not count food service meals as a separate market layer.
Segmentation Overview
- United States
- Production Analysis
- Production Volume
- Area Harvested and Yield
- Consumption Analysis (Value and Volume)
- Trade Analysis (Value and Volume)
- Import Market Analysis
- Import Value and Volume
- Key Supplying Markets
- Export Market Analysis
- Export Value and Volume
- Key Destinations Markets
- Import Market Analysis
- Wholesale Price Trend Analysis and Forecast
- Regulatory Framework
- Logistic and Infrastructure
- Seasonality Analysis
- Production Analysis
Data Sources, Market Sizing, and Validation
Desk Research
Desk work started with building the supply and demand frame for blueberries in the United States, then checking it against consistent public data series. We referenced USDA sources (including NASS and AMS) for acreage, yield, production, and price reporting, and we used USDA ERS for background on fruit consumption and trade drivers.
We reviewed trade flows and seasonal coverage using public US import and export statistics (including USITC DataWeb and U.S. Census Bureau trade releases), then compared category updates and consumption messaging with inputs from industry bodies like the U.S. Highbush Blueberry Council. To validate capacity expansions, new plantings, and distribution shifts, we also used company filings, investor presentations, and reputable press. For additional financial context, we supplemented with paid subscriptions focused on company financials and news intelligence, plus an import-export shipment-level database for directional cross-checks. The sources noted above are illustrative rather than exhaustive, and other public documents and datasets were also used for collection, validation, and clarification.
Primary Interviews and Surveys
Primary work focused on confirming how pricing, pack styles, and channel mix are moving, since these factors can shift value even when volume is steady. We spoke with growers, marketer shippers, importers, distributors, and retail-facing category stakeholders across major producing and consuming regions to test assumptions and close gaps that public statistics do not fully explain.
Distribution of primary research fieldwork respondents
| Company type | Respondent position |
|---|---|
| Top tier: 31% | CXOs: 14% |
| Mid tier: 51% | Functional/Unit leaders: 39% |
| Smaller Players: 18% | Managers: 47% |
Market-Sizing & Forecasting
Market sizing was built using a combined top-down and bottom-up logic that can be repeated with limited, auditable inputs. On the top-down side, we used production and trade data to reconstruct available supply for the United States, then aligned it to domestic use after accounting for exports and seasonal shifts.
To translate supply into value, we applied pricing and mix assumptions that reflect how blueberries are sold across real channels, and then stress-tested them with selective bottom-up checks from interviews and channel observations. Key model inputs included planted acreage and bearing area, yield per acre, weekly and seasonal pricing signals, import arrival windows and country mix, and the share split between fresh and non-fresh selling formats (because pack and handling differences change realized pricing). Where a gap existed in public reporting for specific weeks or states, the missing pieces were filled using nearest-period averages and were rechecked using primary feedback.
For forecasting, we used scenario analysis supported by trend lines in acreage, yield improvements, and expected price behavior under different supply tightness conditions. Final growth paths were adjusted only after the drivers matched what industry respondents described as realistic, especially around weather risk, labor costs, and retail promotion intensity.
Data Validation & Update Cycle
Outputs were validated through several passes that look for mismatches between volume signals and value signals. We compared implied consumption against independent indicators such as trade direction, price trends, and reported production changes, and then investigated outliers that did not reconcile.
Before sign-off, the model and assumptions are reviewed by another analyst to confirm the math, the unit handling, and the logic behind each adjustment. The report is refreshed annually, with interim updates when material events occur, such as major crop disruptions or meaningful trade shifts. Right before delivery, a final check is run so clients receive the most current view available.
Mordor Intelligence's United States Blueberry Market Sizing Compared With Other Published Estimates
Published market sizes for US blueberries can look far apart, even when multiple sources point to similar demand drivers, because the counted revenue layer and product inclusion rules differ across estimates. In practice, the biggest swings come from whether the figure reflects farm-gate value, wholesale and shipped value, or a retail ring value, and from how imports, processing formats, and price seasonality are treated.
Some external estimates focus on a narrower farm-level value and may understate the effect of pack styles and channel pricing. Others reflect broader retail-spend coverage and can overstate value by mixing in downstream margin layers. In the Mordor Intelligence model, the market value is counted when blueberry volumes are sold into US channels using supply (domestic output plus imports minus exports) and observed price series. Retail-only markups and downstream product categories are kept outside scope.
Benchmark comparison
| Source | Market Size | Gaps in Research Methodology |
|---|---|---|
| Mordor Intelligence | USD 5.90 B (2025) | |
| Trade Journal A | USD 1.15 B (2024) | Uses a production value style figure tied closely to reported crop value, which tends to resemble farm-gate economics and does not fully capture channel price realization and imported supply sold into the market. |
| Regional Consultancy B | USD 0.85 B (2025) | Appears to size only a limited subset of commercial blueberry sales (often aligned to a narrower form or channel), which can omit parts of the fresh versus non-fresh mix and reduces the impact of seasonal pricing swings. |
Taken together, the comparison shows that most gaps come from the chosen value layer and how pricing and imports are handled, not from a dispute that blueberries are growing in importance. By keeping the model anchored to repeatable supply, mix, and pricing variables, we arrive at a number that is easier to reconcile and re-check over time.
Key Questions Answered in the Report
How large is the United States blueberry market in 2026?
The United States blueberry market is estimated to reach USD 6.40 billion in 2026 and is forecast to expand to USD 9.80 billion by 2031.
What is the projected growth rate of the United States blueberry market through 2031?
The market is projected to increase at an 8.90% CAGR during the 2026–2031 period.
What are the main production challenges for United States growers?
Key hurdles include labor shortages, spotted-wing drosophila and fungal diseases, high water costs in California, and capital requirements for high-tunnel systems and mechanical harvesters.
How are retailers influencing blueberry pricing?
Large chains use private-label programs and multiyear price locks that shift margin risk to growers but stabilize consumer prices, especially during off-season import fluctuations.