
Market Overview
| Study Period | 2020 - 2031 |
|---|---|
| Forecast Data Period | 2026 - 2031 |
| Base Year Market Size (2025) | USD 20.19 Billion |
| Market Size (2026) | USD 21.75 Billion |
| Market Size (2031) | USD 31.58 Billion |
| Growth Rate (2026 - 2031) | 7.74 % |
| Market Concentration | Medium |
Major Players *Disclaimer: Major Players sorted in no particular order Image © Mordor Intelligence. Reuse requires attribution under CC BY 4.0. | |
United States Biomarkers Market Analysis by Mordor Intelligence
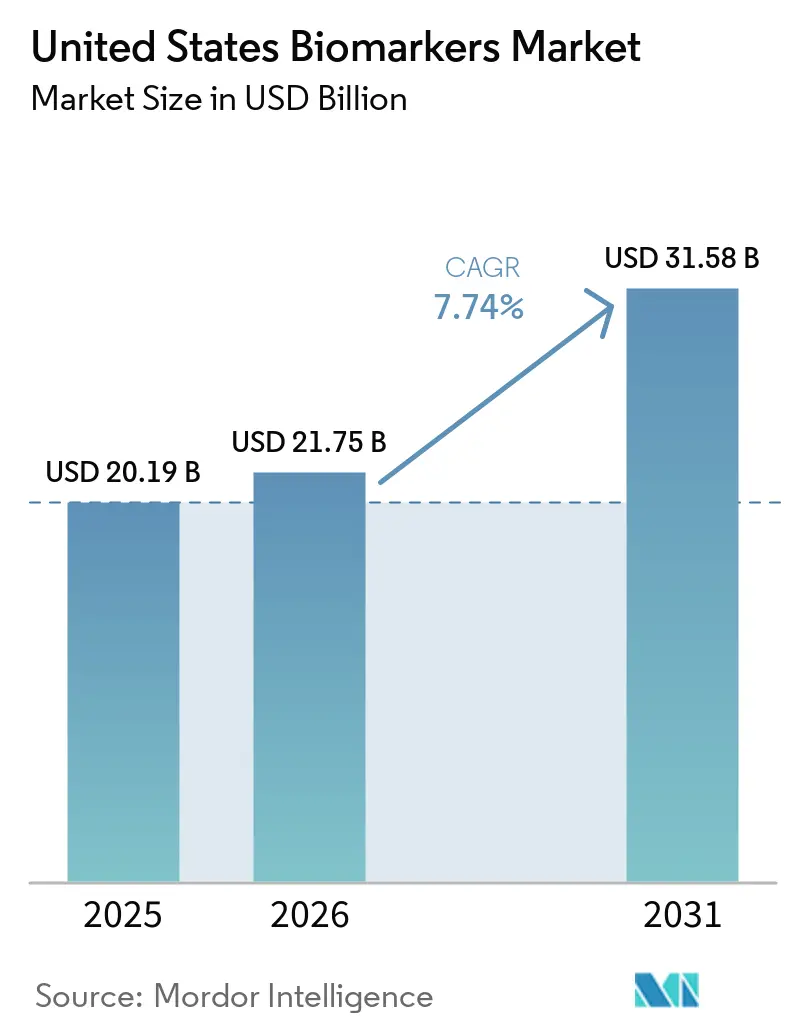
The United States biomarkers market size is expected to grow from USD 20.19 billion in 2025 to USD 21.75 billion in 2026 and is forecast to reach USD 31.58 billion by 2031 at 7.74% CAGR over 2026-2031. Growth is reinforced by falling next-generation sequencing costs that expand test menus and accelerate validation timelines across clinical and research settings. Uptake is also supported by the continued integration of companion diagnostics in FDA drug labels, which tightens linkage between targeted therapies and test-enabled eligibility decisions. Coverage pilots by the Centers for Medicare & Medicaid Services for blood-based neurodegeneration biomarkers are opening earlier detection pathways and creating reimbursement precedents that broaden clinical use. Broader interoperability initiatives, including TEFCA and USCDI+, are improving data liquidity for real-world evidence and post-market assessment, which strengthens clinical utility claims and supports scale in the United States biomarkers market.
Key Report Takeaways
- By product, Consumables led with 51.78% revenue share in 2025, while Services & Software is forecast to expand at a 10.05% CAGR to 2031.
- By disease, Oncology held 36.02% of the United States biomarkers market share in 2025, while Neurological Disorders is projected to record a 8.86% CAGR to 2031.
- By type, Safety Biomarkers accounted for 41.23% share in 2025, and Efficacy Biomarkers are expected to grow at a 10.28% CAGR through 2031.
- By mechanism, Genetic Biomarkers held 45.89% share in 2025, while Epigenetic Biomarkers are set to expand at an 10.86% CAGR through 2031.
- By application, Drug Discovery & Development captured 30.89% of 2025 revenue, while Personalized Medicine is forecast to grow at a 11.65% CAGR through 2031.
Note: Market size and forecast figures in this report are generated using Mordor Intelligence’s proprietary estimation framework, updated with the latest available data and insights as of 2026.
United States Biomarkers Market Trends and Insights
Drivers Impact Analysis*
| Driver | (~) % Impact on CAGR Forecast | Geographic Relevance | Impact Timeline |
|---|---|---|---|
| Rising oncology burden and chronic disease prevalence in the U.S. | 1.2% | National, with higher concentration in aging Northeast and Midwest populations | Long term (≥ 4 years) |
| Broader adoption of biomarker-based clinical diagnostics & screening across U.S. health systems | 1.5% | National, early adoption in academic medical centers and integrated delivery networks | Medium term (2-4 years) |
| Acceleration of companion diagnostics embedded in drug labels and clinical trials | 1.3% | National, with concentration in oncology centers of excellence | Medium term (2-4 years) |
| Falling NGS/multi-omics costs enabling broader discovery and clinical validation | 1.4% | National, with spillover to community hospitals as reference-lab partnerships expand | Short term (≤ 2 years) |
| CMS coverage pilots for blood-based neurodegenerative biomarkers catalyzing earlier detection | 1.1% | National, initial impact in Medicare Advantage markets | Short term (≤ 2 years) |
| Data liquidity via TEFCA/USCDI+ enabling RWE pipelines for validation and label expansion | 0.9% | National, accelerated in states with mature health information exchanges | Long term (≥ 4 years) |
| Source: Mordor Intelligence | |||
Rising Oncology Burden and Chronic Disease Prevalence in the U.S.
Cancer incidence projections indicate that the United States will see around 2 million new diagnoses annually through 2030, with lung and colorectal cancers representing large case volumes that benefit from biomarker-guided therapy selection[1]. Chronic cardiovascular and metabolic conditions affect a large adult population, which sustains demand for cardiac and metabolic biomarkers embedded in treatment protocols across health systems. An aging demographic profile, with adults aged 65 and older expected to represent a rising share of the U.S. population by 2030, is increasing co-morbidities and encouraging multi-disease panels that streamline workflows for faster treatment initiation. Molecular profiling identifies actionable mutations in a significant share of advanced-stage cancers, which enables enrollment in precision trials and access to targeted therapies that outperform empirical regimens in specific settings. Regulatory programs such as the FDA’s tumor-agnostic biomarker policies and laboratory quality rules under CLIA continue to standardize assay performance, which supports payer confidence in the United States biomarkers market.
CMS Coverage Pilots for Blood-Based Neurodegenerative Biomarkers Catalyzing Earlier Detection
CMS draft coverage determinations in 2024 for plasma assays that measure phosphorylated tau and amyloid-beta ratios recognized their role in ruling out Alzheimer pathology in patients with mild cognitive impairment. Coverage with evidence development models require prospective registries to gather outcomes, which link reimbursement to real-world performance and clinical benefit. Clinicians are layering blood tests into diagnostic workflows, which shortens time to diagnosis and supports care planning earlier in the disease course[2]. Private insurers are observing Medicare pilots and adapting policies that use biomarker documentation as a predicate for specialty referrals in older adults. Diagnostic companies are scaling immunoassay and mass spectrometry platforms for high-volume processing as coverage expands beyond specialty centers. CLIA and local or national coverage determinations continue to anchor quality and access parameters for decentralized testing sites in the United States biomarkers market.
Data Liquidity via TEFCA/USCDI+ Enabling RWE Pipelines for Validation and Label Expansion
TEFCA is creating a framework for nationwide interoperability that allows biomarker and clinical outcomes data to move across health information exchanges for care and research use. USCDI+ is promoting standardized representation of laboratory results using LOINC and SNOMED, which improves analytics and reduces mapping friction across systems[3]. Providers and sponsors are running pragmatic trials that embed eligibility logic into EHRs to compress enrollment timelines and lower per-patient costs. Payers are leveraging interoperable registries to monitor test utilization patterns and align reimbursement with evidence-based ordering. Academic consortia use de-identified multi-institutional datasets to discover associations between molecular signatures and outcomes that inform guideline updates and FDA biomarker qualification submissions. The 21st Century Cures Act and HIPAA provisions balance data sharing with privacy safeguards, which ensures appropriate consent and de-identification for research.
Falling NGS/Multi-Omics Costs Enabling Broader Discovery and Clinical Validation
Sequencing costs have declined in recent years due to chemistry and throughput advances, which supports broader clinical and discovery use cases. Population genomics programs run by academic centers and national initiatives are generating variant insights that feed back into decision-support tools used at the point of care. Biopharma is deploying multi-omics approaches in early development to identify response-enriched cohorts and reduce the size and duration of pivotal trials. Clinical labs continue moving from single-gene tests to comprehensive tumor panels while preserving turnaround times consistent with urgent treatment planning, guided by published FDA validation expectations for NGS-based oncology assays. Reference labs are automating library preparation and bioinformatics pipelines to handle variable testing demand, aided by platform advances from major instrument suppliers. Clearer regulatory guidance for NGS validation around limit-of-detection and accuracy has supported adoption without compromising analytical performance.
Restraints Impact Analysis*
| Restraint | (~) % Impact on CAGR Forecast | Geographic Relevance | Impact Timeline |
|---|---|---|---|
| Complex reimbursement and evolving FDA IVD/LDT regulation increases time-to-market | -0.8% | National, with acute impact on laboratory-developed tests in hospital and academic settings | Medium term (2-4 years) |
| High assay development and multi-site clinical validation costs | -0.6% | National, disproportionate burden on emerging diagnostics companies | Short term (≤ 2 years) |
| Limited assay standardization/interoperability across platforms hampers payer acceptance | -0.5% | National, most pronounced in decentralized laboratory networks | Long term (≥ 4 years) |
| Algorithmic transparency and change-control expectations for AI biomarkers slow adoption | -0.4% | National, concentrated in AI-enabled imaging and liquid biopsy interpretation | Medium term (2-4 years) |
| Source: Mordor Intelligence | |||
Complex Reimbursement and Evolving FDA IVD/LDT Regulation Increases Time-to-Market
The FDA’s proposed framework to regulate laboratory-developed tests expands premarket review expectations for in-house assays, which lengthens development cycles and increases submission costs for hospital and academic laboratories. Many institutions are reassessing innovation pipelines or seeking commercial partners that can shoulder regulatory and quality requirements under the United States biomarkers market. Fragmented coverage policies across Medicare Administrative Contractors create region-by-region variability in approvals that constrains predictable reimbursement. Prior authorization and medical necessity checks add administrative steps that lower ordering rates even for tests with strong clinical evidence. The absence of specific CPT codes for newer biomarker categories often forces use of miscellaneous codes that pay at lower rates or face denials, which delays adoption. These barriers collectively slow market entry and scale for novel assays that would otherwise meet clinical needs.
High Assay Development and Multi-Site Clinical Validation Costs
End-to-end development for a clinically validated biomarker, from discovery to regulatory submission, requires multi-year investment and large prospective studies that stretch early-stage budgets in the United States biomarkers market. Smaller diagnostics firms struggle to fund multi-center trials for rare-disease populations where recruitment is slow and sites are widely distributed. Contract research activities, biospecimen logistics, and compliant site monitoring add cost layers that heighten the capital burden for new assay categories. Regulatory submissions demand comprehensive analytical validation, including limit-of-detection, precision, accuracy, and interference studies, which require extensive reference materials and months of lab work. Payers increasingly request credible health-economic models before issuing policies, which adds study complexity and time before covered clinical use. These cost factors shape the pace and sequencing of pipeline decisions for emerging test developers.
*Our forecasts treat driver/restraint impacts as directional, not additive. The impact forecasts reflect baseline growth, mix effects, and variable interactions.
Segment Analysis
By Disease: Oncology Dominance Persists While Neurological Disorders Accelerate on Blood-Based Alzheimer Breakthroughs
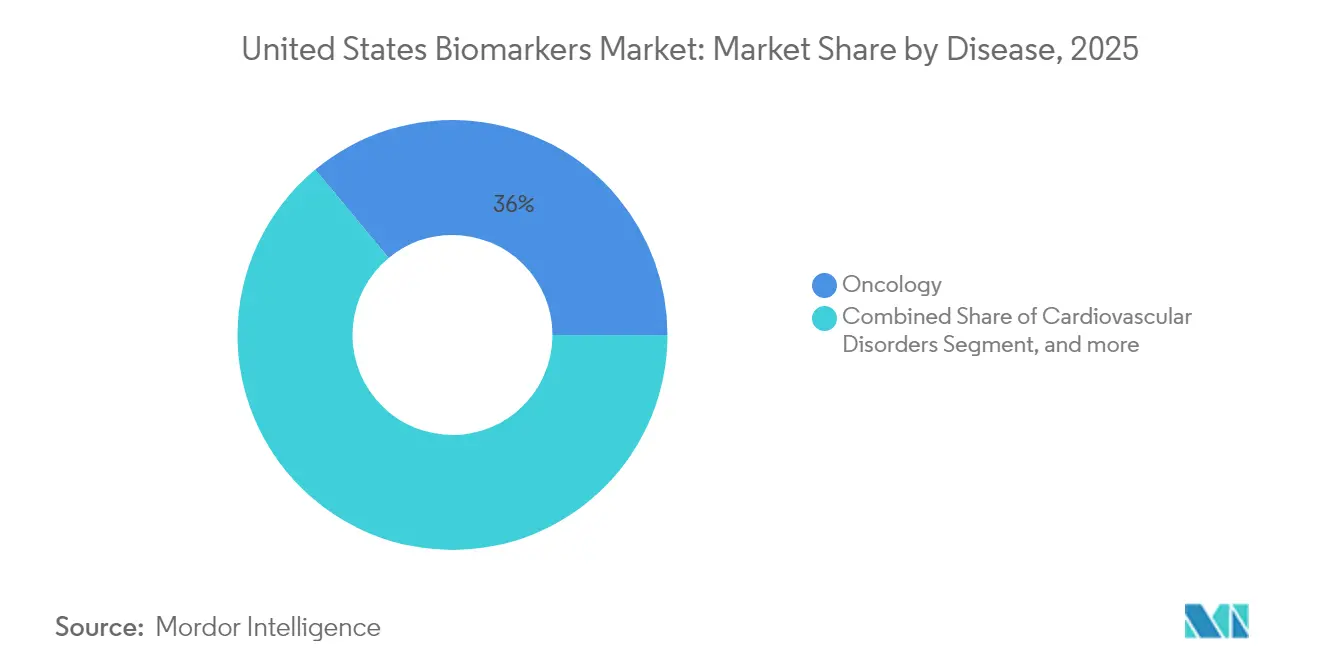
Oncology accounted for 36.02% of disease-specific revenue in 2025 supported by widespread adoption of comprehensive genomic profiling for tumor characterization and therapy selection. The United States biomarkers market has embedded testing for targets that guide treatment in non-small cell lung cancer, colorectal cancer, breast cancer, and melanoma, and this underpins clinical trial enrollment and access to targeted agents. Neurological Disorders are expected to grow at a 8.86% CAGR through 2031 as plasma phospho-tau and amyloid assays move into routine use in primary care to triage suspected Alzheimer cases after recent coverage pilots. Cardiovascular biomarkers such as high-sensitivity troponin and natriuretic peptides support guideline-driven care that uses serial measurements to titrate therapy and assess residual risk in outpatient management. Immunology programs rely on biomarkers such as C-reactive protein and anti-CCP antibodies, though expansion is tempered by market maturity and fewer novel markers with superior performance.
Renal and urologic testing for chronic kidney disease staging remains essential, although pricing pressure challenges revenue growth as payers apply value-based models. Infectious disease and sepsis biomarkers continue to support stewardship protocols that target early intervention and better antibiotic use in hospital settings. Metabolic and endocrine biomarkers like hemoglobin A1c and TSH sustain volume through population health initiatives that identify and monitor at-risk individuals. Emerging areas in respiratory and gastrointestinal disorders include noninvasive fibrosis staging and phenotype-based asthma assessment, which may reduce reliance on invasive procedures once validation completes. The United States biomarkers market continues to see oncology as the anchor for precision diagnostics while neurology is the fastest-moving disease area based on recent coverage trends and new blood-based modalities.

By Product: Services & Software Surge as Cloud Analytics and AI Interpretation Reshape Workflow Integration
Consumables held 51.78% of revenue in 2025 as labs across hospitals, reference centers, and pharma research maintained high-volume ordering for reagents and kits across immunoassays, PCR, and sequencing workflows. The United States biomarkers market continues to depend on stable supply chains for these core inputs, which underpins routine testing across oncology, cardiology, and infectious disease programs. Services & Software is the fastest-growing category at a 10.05% CAGR through 2031, driven by cloud bioinformatics that automates variant calling, annotation, and report generation aligned to clinical standards for structured results. Health systems are embedding AI-enabled interpretation modules within EHRs to route clinically actionable findings into care pathways that improve ordering consistency and turnaround times. Vendors are differentiating with pharmacogenomic decision support and longitudinal tracking of circulating tumor DNA changes, which help clinicians adapt therapy sequences. The United States biomarkers industry is also seeing bundled offerings that combine wet-lab processing with expert review, which simplifies staffing needs for community providers.
Instrument demand remains mixed as cost containment pressures influence capital budgets, yet upgrades to higher-throughput sequencers and automation platforms continue where scale brings operating margin benefits. Reference labs are outsourcing specialist interpretation to centralized teams that run molecular tumor boards and hereditary risk consultations, which can improve clarity and reduce variability in recommendations. Software components that output patient-specific results fall within CLIA oversight, which requires validation that automation yields concordant results compared to expert review. The United States biomarkers market benefits from investments in template-based reporting and standardized codes that reduce manual mapping across LOINC and SNOMED terminologies. These product-layer dynamics reinforce a shift toward recurring revenue streams from analytics and services that complement consumable volumes.
By Mechanism: Epigenetic Biomarkers Surge on Methylation-Based Liquid Biopsy Momentum in Colorectal and Breast Residual Disease
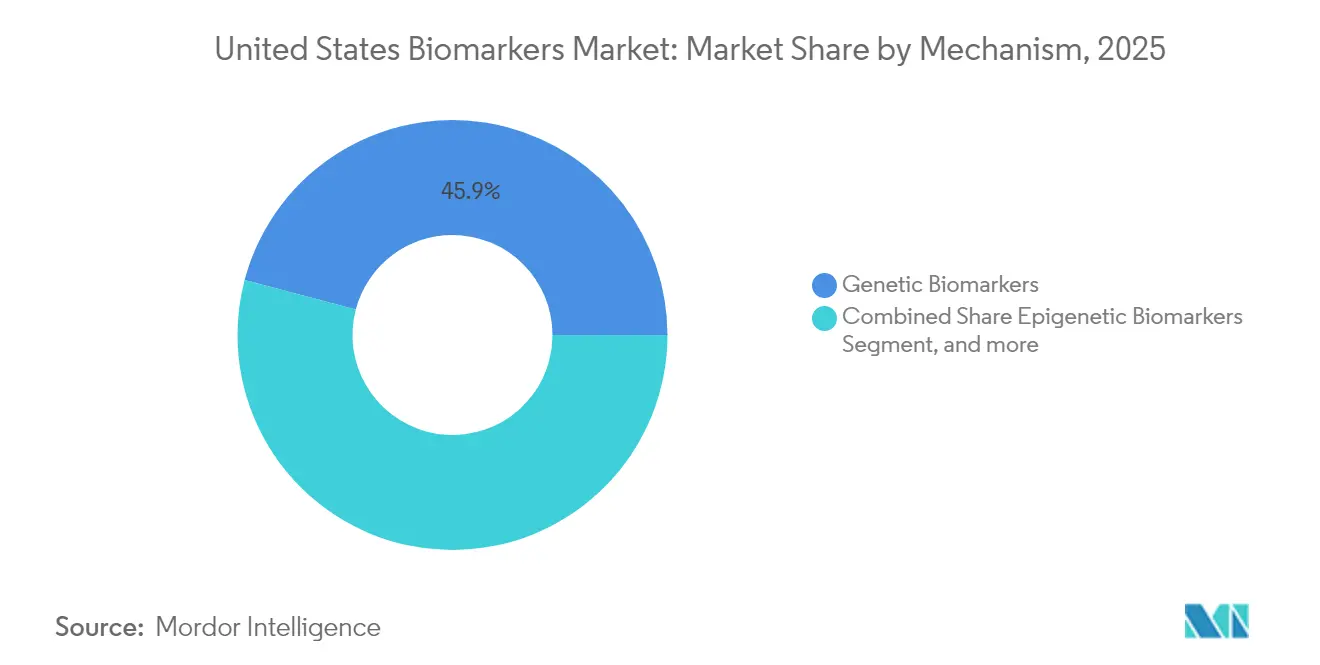
Genetic Biomarkers accounted for 45.89% of mechanism-based revenue in 2025 anchored by NGS panels that interrogate key oncogenic drivers across solid tumors. These test menus support selection for targeted therapies or trial enrollment across tumor-agnostic or tumor-specific indications as supported by FDA-recognized genomic biomarkers. Epigenetic Biomarkers are forecast to grow at an 10.86% CAGR through 2031, powered by methylation-based liquid biopsy approaches that detect minimal residual disease after surgery or adjuvant therapy in colorectal and breast cohorts. The United States biomarkers industry is seeing strong development activity around methylation signatures for early detection and surveillance, including multi-cancer early detection platforms advancing clinical validation.
Proteomic biomarkers measured via mass spectrometry and multiplex immunoassays are gaining traction in immunology and neurology for longitudinal monitoring, but reimbursement remains a hurdle until clinical utility is established. Metabolomic approaches are used in targeted programs such as newborn screening and precision nutrition pilots, while broader adoption awaits simpler workflows and widely available reference materials. Lipidomic profiling for cardiovascular and neurodegenerative risk is under investigation, with translation dependent on proof of incremental predictive value beyond standard panels. Imaging biomarkers derived from PET, MRI, and CT contribute to pharmacodynamic assessment and response measurement in oncology trials, with quantitative imaging standards supported by professional collaborations. The United States biomarkers market continues to shift toward multi-modal signatures that integrate genomic, epigenomic, and imaging features for more reliable disease management.
By Application: Personalized Medicine Leads Growth as Pharmacogenomic Panels Reduce Adverse Events and Optimize Dosing in Cardiovascular and Psychiatric Care
Drug Discovery & Development captured 30.89% of application revenue in 2025 through biomarker-guided target validation and patient stratification that compresses trial sizes and timelines. Companion diagnostic co-development remains central to therapeutic submissions and post-approval commitments for label claims in the United States biomarkers market. Personalized Medicine is the fastest-growing application at a 11.65% CAGR through 2031, driven by preemptive pharmacogenomics for medications such as clopidogrel, warfarin, statins, and SSRIs that reduces adverse events and improves dose selection. Clinical Diagnostics remains a high-volume area across oncology, infectious diseases, cardiology, and neurology, guided by preventive and specialty guidelines.
Disease Risk Assessment using polygenic risk scores is emerging in wellness and employer settings, with clinical integration paced by evidence of actionability and payer coverage decisions. Prognosis and monitoring applications such as serial ctDNA testing are expanding, which supports response-adapted oncology regimens and creates recurring testing demand. The United States biomarkers market favors applications that couple clinical impact with clear reimbursement logic, which includes dose optimization and de-escalation strategies that lower downstream costs. As more real-world evidence accumulates, payers are likely to refine policies that align payment with outcomes and guideline adherence. This feedback loop between clinical utility evidence and coverage is shaping the slope of adoption across use cases.
By Type: Efficacy Biomarkers Outpace Safety Markers as Payers Demand Real-World Evidence Linking Response to Outcomes
Safety Biomarkers represented 41.23% of type-based revenue in 2025, reflecting the importance of toxicity monitoring during early-phase trials as sponsors identify maximum tolerated dosing. Payers and clinicians continue to rely on safety markers in clinical practice to manage therapy risks under intensive monitoring protocols. Efficacy Biomarkers are set to grow at a 10.28% CAGR through 2031 because coverage policies increasingly require objective evidence of treatment response to authorize continuation of high-cost therapies in the United States biomarkers market. Prognostic biomarkers help stratify patients by baseline risk, which informs when to escalate or de-escalate regimens, such as adjuvant therapy decisions in oncology. Predictive biomarkers identify patients likely to benefit from specific therapies, as seen with PD-L1 testing and tumor mutational burden assessment that supports immunotherapy selection in defined settings.
Pharmacodynamic markers that confirm on-pathway drug activity are crucial in early-phase development and can reduce costly late-stage attrition by validating mechanism of action. Surrogate endpoints such as minimal residual disease in hematologic cancers are being used in accelerated pathways, which can advance regulatory decisions pending confirmatory trials. Validation biomarkers that ensure sample integrity and assay consistency remain essential for credible interpretation of safety and efficacy markers. The United States biomarkers market size for Efficacy Biomarkers is expected to expand steadily alongside payer requirements that tie reimbursement to measurable clinical change.
Regulatory Landscape
The United States biomarkers market is governed by a multi-agency framework that combines FDA oversight for IVDs (CDRH) and drug-development tools (CDER), with CLIA-based laboratory quality requirements for clinical testing across many hospital and reference laboratories. Biomarker adoption is influenced by FDA programs such as CDER's Biomarker Qualification Program (BQP), which supports biomarker use across multiple drug development programs once qualified, and CDRH pathways for diagnostic clearances and approvals. In February 2026, FDA updated the BQP Letter of Intent content element outline, reinforcing more structured submissions and earlier interactions for biomarker developers.
Reimbursement and coverage policy continues to affect commercialization timelines, including CMS coverage pilots in blood-based neurodegeneration biomarkers that use evidence-development models and prospective registries. At the state level, New York State law A8502 (signed February 7, 2024, effective January 1, 2025) mandates insurance coverage for biomarker tests for disease management, and implementation variability has been a recurring theme in discussions with commercial payers. Separately, the policy debate on LDT oversight has intensified following FDA actions to phase out enforcement discretion over a multi-year period, and legislative proposals in 2026 that would shift elements of oversight toward CMS add another planning layer for test developers.
Value Chain Analysis
The United States biomarkers market value chain starts with discovery inputs (biospecimens, omics and imaging data, reference standards, and reagents), then moves through assay development and analytical validation, clinical validation in multi-site studies, and regulatory and quality-system steps (FDA pathways for IVDs and CLIA requirements for laboratories). Commercialization and delivery are typically handled by centralized reference laboratories and, increasingly, through distributed health system laboratories, with workflow software, bioinformatics, and interpretation services supporting ordering, reporting, and longitudinal monitoring.
Partnership-led integration is a defining feature of the current value chain, particularly for companion diagnostics and decentralized precision testing. In January 2026, Guardant Health and Merck (MSD) announced a multi-year collaboration to develop and commercialize companion diagnostics using the Guardant Infinity Smart platform, tightening biomarker testing around therapy launches. In March 2026, Illumina and Labcorp expanded their collaboration to broaden access to precision oncology testing, including co-commercialization of Labcorp's PGDx elio plasma focus Dx and Illumina's TruSight Oncology Comprehensive kits, reflecting a shift from single-site testing to distributed models. Upstream, reagent and assay innovation is also moving into high-growth neurology use cases, such as Bio-Techne's July 2025 partnership with Spear Bio to distribute ultrasensitive immunoassays for low-abundance neurology biomarkers.
Competitive Landscape
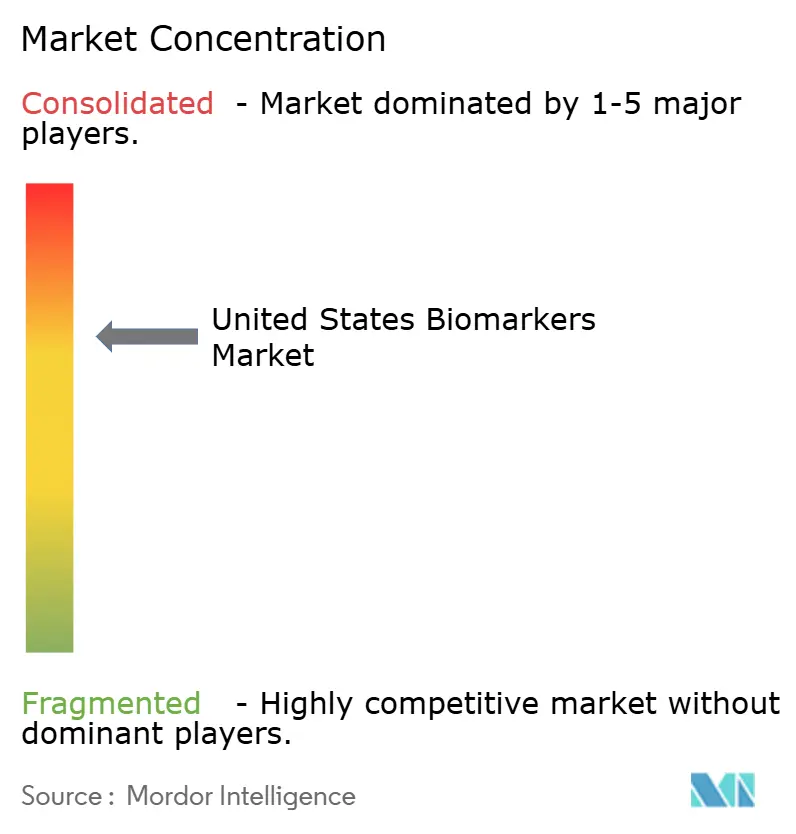
The United States biomarkers market features established diagnostics leaders alongside venture-backed innovators that focus on liquid biopsy, AI-enabled interpretation, and high-throughput workflows. Incumbents are broadening menus through acquisitions and partnerships that add neurodegeneration, oncology, and immunology assays, while they strengthen service layers that integrate directly with EHRs. Specialist firms are scaling multi-year contracts with integrated delivery networks and self-insured employers to reduce time-to-diagnosis and downstream costs, which intensifies competition in oncology surveillance and early detection. Payers are experimenting with outcomes-based contracts where test reimbursement is linked to adherence with guidelines and documented clinical benefit.
Strategic moves in 2024 highlight the pace of innovation and commercialization. Guardant Health announced FDA approval for a blood-based comprehensive genomic profiling assay for advanced solid tumors, which provides an alternative when tissue is limited or inaccessible. Exact Sciences signed a multi-year agreement with an integrated delivery network to deploy a multi-cancer early detection test in average-risk individuals, signaling diversification beyond colorectal screening. Thermo Fisher strengthened neurodegeneration assay capabilities through acquisition, which aligns with favorable coverage momentum for Alzheimer blood tests. Abbott received FDA clearance for a high-sensitivity troponin test optimized for point-of-care use, which supports emergency medicine protocols.
Platform and partnership activity continues to shape competitive positions. Illumina launched a next-generation sequencing platform that improves throughput and reduces per-sample costs for population genomics and hereditary cancer workloads. Foundation Medicine expanded its companion diagnostic co-development with a pharmaceutical partner focused on rare fusions, which reflects tighter coordination between drug and diagnostic commercialization. Natera completed enrollment for a pivotal trial of ctDNA monitoring in stage II colorectal cancer, with results expected to influence clinical guidelines and coverage decisions in 2025. Tempus announced an HIE integration to enable retrospective analyses of biomarker testing and outcomes, which supports label expansion and post-market surveillance. These moves indicate that services, analytics, and evidence-generation capabilities will be as important as wet-lab performance in defining leadership.
United States Biomarkers Industry Leaders
-
Abbott Laboratories Inc.
-
Thermo Fisher Scientific
-
F. Hoffmann-La Roche Ltd
-
Danaher Corporation
-
QIAGEN N.V.
- *Disclaimer: Major Players sorted in no particular order
Market Opportunities and Future Outlook
Regulatory and coverage shifts are creating openings for test developers that can show clinical utility through prospective evidence and interoperable data flows. The May 2024 FDA final rule to phase out enforcement discretion for LDTs over a four-year period has increased demand for compliance-ready assay design, documentation, and change control, while 2026 legislative proposals, including the Enhancing Clinical Laboratory Innovation and Access (CLIA) Act of 2026 introduced in May 2026, point to continuing uncertainty around the eventual oversight model. This environment supports opportunities for companies and laboratories that can operate under stricter validation expectations, align to CMS evidence requirements, and present biomarker results in standardized, shareable formats supported by interoperability initiatives (TEFCA and USCDI+).
Commercial opportunities are also emerging as FDA authorizations and company actions expand test menus and delivery models. Point-of-care molecular diagnostics gained momentum when Baebies obtained 510(k) clearance and a CLIA waiver for its Finder system respiratory test in March 2026, enabling faster decision-making in near-patient settings. In screening and risk stratification, Labcorp and Geneoscopy moved to nationwide availability of the FDA-approved RNA-based at-home ColoSense test for colorectal cancer screening in June 2026, and FDA granted PMA for the HepQuant SHUNT liver diagnostic test in June 2026, reflecting continued payer and provider interest in noninvasive, workflow-friendly diagnostics anchored in validated biomarkers. In neurology, CMS coverage pilots for blood-based Alzheimer-related biomarkers and platform-level moves such as ALZpath's licensing agreement with Abbott for pTau217 integration on Alinity systems are expanding the path from assay innovation to scaled immunoassay deployment.
Recent Industry Developments
- June 2026: ALZpath signed a global licensing agreement with Abbott to integrate ALZpath’s proprietary pTau217 antibody into an in vitro diagnostic test for Alzheimer’s disease on Abbott’s Alinity ci-series systems. The deal links a specialized neurodegeneration biomarker reagent asset to a high-throughput immunoassay platform already embedded across clinical laboratories. This strengthens the pathway from research-grade blood biomarkers into routine workflows aligned with emerging coverage momentum for Alzheimer-related testing.
- August 2025: Thermo Fisher Scientific received FDA approval for its Oncomine Dx Target Test as a companion diagnostic for identifying HER2/ERBB2-mutant non-small cell lung cancer patients eligible for Boehringer Ingelheim’s zongertinib therapy. The approval expands the role of NGS-based biomarkers in treatment selection and reinforces the commercial coupling of targeted therapies with validated diagnostics. It also supports broader adoption of standardized genomic profiling in U.S. oncology testing pathways.
- December 2024: Thermo Fisher Scientific launched Gibco CTS Detachable Dynabeads CD4 and CTS Detachable Dynabeads CD8 to support cell isolation and activation in cell therapy development and production workflows. These tools help operationalize biomarker-driven cell selection and characterization steps that sit upstream of clinical manufacturing and quality control. The launch supports scaled translational pipelines where biomarker assays and manufacturing analytics are tightly linked to release criteria and consistency.
Research Methodology Framework and Report Scope
Market Definition and Coverage
For this study, the United States biomarkers market covers the value generated from biomarker tests and related kits that are used to screen, diagnose, stage, monitor, or guide treatment decisions within the United States.
Scope exclusions: Research-use-only reagents and investigational markers that are not validated for routine clinical use are excluded from sizing.
Segmentation Overview
- By Disease
- Oncology
- Cardiovascular Disorders
- Neurological Disorders
- Immunological & Inflammatory Disorders
- Renal & Urologic Disorders
- Infectious Diseases & Sepsis
- Metabolic & Endocrine Disorders
- Respiratory Disorders
- Gastrointestinal & Hepatic Disorders
- By Type
- Efficacy Biomarkers
- Prognostic Biomarkers
- Predictive Biomarkers
- Pharmacodynamic Biomarkers
- Surrogate Endpoint Markers
- Safety Biomarkers
- Validation Biomarkers
- Efficacy Biomarkers
- By Mechanism
- Genetic (Genomic) Biomarkers
- Epigenetic Biomarkers
- Proteomic Biomarkers
- Metabolomic Biomarkers
- Lipidomic Biomarkers
- Imaging Biomarkers
- By Application
- Clinical Diagnostics
- Drug Discovery & Development
- Personalized Medicine
- Disease Risk Assessment
- Prognosis & Monitoring
- By Product
- Consumables
- Instruments
- Services & Software
Data Sources, Market Sizing, and Validation
Desk Research
We started by building a clean fact base on disease burden, testing intensity, and lab capacity, because these signals help show where biomarker demand is likely to exist in a given year. Public sources that helped ground the assumptions included the US FDA (test and kit clearances), the CDC (screening and public health statistics), the NIH and clinical trial registries (pipeline and study activity), and CMS coverage and reimbursement material where applicable.
To convert demand signals into a dollar market, the model was further supported by company filings and investor presentations, association and laboratory network publications, and reputable press reporting on testing adoption. In a few cases, we also relied on paid database subscriptions for company financials and intelligence, patent lookups, and shipment or trade signal checks when those were relevant for validation. These desk sources are not exhaustive, and many other references were used during data collection, validation, and clarification.
Primary Interviews and Surveys
Our primary work focused on interviews and structured surveys with clinical lab stakeholders, diagnostic and life science suppliers, and domain experts who track adoption in hospital, reference-lab, and research settings. Because this is a single-country market, we validated inputs across major US demand pockets by speaking with respondents tied to different testing channels and care settings, then rechecking the assumptions that showed the largest impact on the final model.
Distribution of primary research fieldwork respondents
| Company type | Respondent position |
|---|---|
| Top tier: 37% | CXOs: 12% |
| Mid tier: 46% | Functional/Unit leaders: 33% |
| Smaller Players: 17% | Managers: 55% |
Market-Sizing & Forecasting
Sizing was built using a top-down approach where diagnosed and screened patient pools, testing rates, and lab throughput signals were used to reconstruct the addressable demand, which was then translated into value through an average selling price (ASP) layer. To keep totals realistic, selective bottom-up checks were run using supplier roll-ups, sampled price points across common test types, and channel checks with labs and distributors. The model was adjusted only where multiple signals pointed in the same direction.
Key inputs used in the model included the number of relevant diagnostic procedures, adoption of biomarker-informed treatment pathways, the split between hospital and reference lab processing, observed shifts toward multiplex or higher-value assays, and typical reimbursement and pricing movements in the US setting. When direct volume signals were missing for a narrow use case, we filled gaps using proxy indicators (for example, procedure volumes or installed base patterns) and then stress-tested them with primary feedback.
For forecasting, scenario analysis was used so near-term shifts in testing behavior, pricing updates, and pipeline-related adoption could be reflected without overfitting the numbers. Final growth paths were aligned to the most consistent expert consensus on how quickly testing intensity and ASPs are expected to change over the forecast window.
Data Validation & Update Cycle
We validated the outputs by triangulating between demand-side signals (testing rates, clinical adoption cues) and supply-side signals (kit availability, lab capacity, and reported revenue direction). Outliers were flagged through variance checks by year and by major use area, and then reviewed in a multi-step internal process before sign-off. Re-contact was triggered when a single assumption moved the total materially.
The report is refreshed on an annual cycle, and interim updates are made when material events occur, such as reimbursement changes or meaningful shifts in clinical practice. Before delivery, a final pass is completed so clients receive the latest view based on newly available data and revalidated assumptions.
Mordor Intelligence's United States Biomarkers Market Size Compared With Other Published Estimates
Published numbers for US biomarkers often do not match because the update timing is different, and the pricing layer is treated in different ways, especially when ASP movement is assumed instead of rechecked. The year used for currency timing, the mix of clinical versus research activity, and what is counted as validated testing revenue also tend to move the total up or down.
Key gap drivers here are usually whether research-use-only volumes are mixed into the value, whether pipeline or investigational markers are treated as current revenue, and how quickly pricing and reimbursement shifts are incorporated into the model. By running annual refresh steps and revalidating the ASP logic with lab-side checks close to publication, Mordor Intelligence reduces timing-driven distortions that can appear when older pricing assumptions are carried forward.
Benchmark comparison
| Source | Market Size | Gaps in Research Methodology |
|---|---|---|
| Mordor Intelligence | USD 20.19 B (2025) | |
| Industry Research Publisher A | USD 19.58 B (2025) | This estimate appears to use a broader segmentation lens, and the gap can come from different inclusion rules around research activity and how ASP progression is carried through the base year. |
| Syndicated Report Distributor B | USD 18.10 B (2024) | This figure is anchored to a prior year, so the difference can reflect currency and timing choices, plus a slower refresh of pricing and reimbursement updates into the current-year value. |
Overall, the spread across sources is mainly explained by timing and pricing treatment, followed by what is counted as validated clinical revenue versus adjacent research activity. Our approach keeps assumptions traceable to demand indicators and price checks, which makes the resulting market size easier to reproduce and update year after year.
Key Questions Answered in the Report
What is the current size and growth outlook of the United States biomarkers market?
The market reached USD 21.75 billion in 2026 and is projected to reach USD 31.58 billion by 2031 at a 7.74% CAGR.
Which disease area leads demand within the United States biomarkers market?
Oncology led with 36.02% of revenue in 2025, driven by comprehensive genomic profiling for therapy selection and clinical trial enrollment.
Which application is growing the fastest in the United States biomarkers market?
Personalized Medicine is the fastest-growing application at a 11.65% CAGR through 2031, supported by preemptive pharmacogenomic testing in cardiovascular and psychiatric care.
What product category is expanding the quickest in the United States biomarkers market?
Services & Software is expanding at a 10.05% CAGR through 2031 as cloud analytics and AI-enabled interpretation integrate with EHR workflows.
Which mechanism type shows the highest growth in the United States biomarkers market?
Epigenetic Biomarkers are forecast to grow at an 10.86% CAGR through 2031, led by methylation-based liquid biopsy for minimal residual disease detection.
Which U.S. region will grow fastest for biomarkers over the forecast period?
The Southeast is projected to grow at an 7.96% CAGR to 2031, while the West is expected at 7.78%, supported by payer innovation and expanding precision medicine programs.