| Study Period | 2017 - 2030 |
| Base Year For Estimation | 2024 |
| Forecast Data Period | 2025 - 2030 |
| Market Size (2025) | USD 43.49 Million |
| Market Size (2030) | USD 67.1 Million |
| CAGR (2025 - 2030) | 9.06 % |
| Market Concentration | Low |
Major Players*Disclaimer: Major Players sorted in no particular order |

United States Biocontrol Agents Market Analysis
The United States Biocontrol Agents Market size is estimated at 43.49 million USD in 2025, and is expected to reach 67.1 million USD by 2030, growing at a CAGR of 9.06% during the forecast period (2025-2030).
The United States biocontrol agents industry is characterized by a highly fragmented competitive landscape, with the top five market players accounting for approximately 25.3% of the market share in 2022. This fragmentation has led to increased competition and innovation in product development, with companies focusing on developing more effective and targeted biological pest control solutions. The Environmental Protection Agency (EPA) and the U.S. Department of Agriculture (USDA) govern the biocontrol agents sector, with the EPA overseeing registration, licensing, packaging, and labeling, while the USDA ensures environmental safety compliance through the Animal and Plant Health Inspection Service (APHIS).
Technological advancements in biocontrol agent development have significantly shaped the market landscape, with microbial control agents emerging as the dominant category, accounting for 89.1% of market share in 2022. These solutions encompass bacteria, fungi, viruses, and protozoans, which function through various mechanisms including pathogen injection, competition, or direct pest elimination. The fungi biocontrol agents segment has shown particular promise, representing 62.7% of the total microbial biocontrol agents market by value in 2022, driven by increasing farmer awareness and adoption of integrated pest management practices.
The market has witnessed significant strategic developments among key players, with companies like Beneficial Insectary partnering with major agricultural industry players such as Nutrien Ag to promote sustainable solutions and biological pest control methods. Companies are increasingly investing in research and development to improve product efficacy and safety, while also expanding their distribution networks to better serve the growing demand. The industry has also seen a trend toward digital integration, with companies like Bioline Agrosciences developing digital applications to provide technical support and product compatibility information to customers.
The regulatory framework governing biocontrol agents has evolved to support market growth while ensuring safety and efficacy. The Federal Insecticide, Fungicide, and Rodenticide Act (FIFRA) requires EPA registration for all biocontrol agents sold or distributed in the United States, including imported products. This regulatory oversight has helped establish quality standards and build market confidence, while also promoting innovation in sustainable agricultural practices. Predator-based solutions have emerged as a particularly successful category, accounting for 83.8% of the market value in 2022, primarily due to their ability to target multiple pest life stages and species. Additionally, the use of beneficial microorganisms has been recognized for its role in biological plant protection, enhancing the effectiveness of integrated pest management strategies.
United States Biocontrol Agents Market Trends
Increase in organic area, particularly in row crops, due to country's laws and regulations
- In 2021, the area under organic agricultural farming in the United States was 623 thousand hectares. Organic agriculture in the United States has increased significantly in the previous 20 years, mostly due to the introduction of particular laws and regulations. The number of organic farms and ranches in California was 3,061 in 2021, the largest number of certified organic farms in the United States. There were over 1,125 certified organic farms in Pennsylvania. Nearly 15,548 thousand certified organic farms in operation used cropland in 2019, while 7,139 thousand farms operated pastureland and rangeland. The sales value of crops, including those from nurseries and greenhouses, amounted to nearly USD 5.8 billion.
- Row crops dominated organic farming in the nation. In 2021, they accounted for about 71.8% of all organic cropland. The production of cereal crops predominates the country's agricultural sector. The main cereals include maize, wheat, rice, and millet. The consumption of organic products has become popular among US consumers who increasingly choose to eat organic foods because of their various health benefits.
- There is an increasing trend in the overall organic horticultural crop cultivation area, from 112.9 thousand hectares in 2017 to 156.1 thousand hectares in 2021. Regarding domestic production in 2021, the top five fruits and vegetables were apples (31.1%), strawberries (9.5%), oranges (6.9%), romaine lettuce (6.7%), and potatoes (6.2%). In the case of trade, the most imported produce was bananas (53.1%), avocados (7.7%), mangoes (5.8%), blueberries (5.0%), and squashes (4.3%), while the most exported were apples (80.0%), pears (14.4%), cherries (4.0%), dried onions (1.5%), and potatoes (0.2%).

Understand The Key Trends Shaping This Market
Download PDF
Growing demand for organic produce especially in the fruits and vegetables sector, rise in per capita spending on organic food
- The United States is one of the largest organic product consumers in the world. As of 2020, the total sales of organic food products in the country accounted for USD 51.6 billion, according to the Nutrition Business Journal (NBJ, 2021). The United States had the largest per capita spending on organic products in the North American region, worth USD 186.7 in 2021.
- Organic fresh fruits and vegetables have been the leading category of organic food since the establishment of the organic food retail industry. In 2020, retail sales for these organic products were valued at USD 20.0 billion, showing a growing demand for organic produce. The demand for organic fresh fruits and vegetables has steadily risen over the past two decades. Organic food sales are rising due to growing consumer awareness, especially among high-income consumers. The most in-demand organic categories include basic foods like eggs, dairy, fruits, and vegetables.
- Organic food preferences vary by demographic and region. Younger people aged between 18 and 29 are more likely to seek organic products (over 50%) compared to older people aged 65 and above. Income and region also play a role, with 42% of those with under USD 30,000 income and 49% of those with over USD 75.0 thousand seeking organic products.
- The per capita spending on organic products is increasing in the country, recording a CAGR of 5.2% between 2017 and 2021. The growing demand for organic products is creating opportunities for US organic producers to tap into high-value markets both domestically and abroad. The price premium associated with organic products is one of the major limiting factors for organic food consumption for low-income consumers.

Segment Analysis: Form
Microbials Segment in United States Biocontrol Agents Market
The microbials segment dominates the United States biocontrol agents market, commanding approximately 89% market share in 2024. This segment includes various microorganisms like bacteria, fungi, viruses, and protozoans that function as biocontrol agents through multiple mechanisms either by injecting pests with diseases, outcompeting them, or directly killing them. Fungal biocontrol agents lead the microbial segment, accounting for nearly 63% of the microbial biocontrol agents market value, primarily due to their intricate mode of action and environmental safety. The segment is experiencing robust growth with a projected CAGR of around 9% from 2024 to 2029, driven by increasing awareness among farmers about integrated pest management and sustainable agriculture practices. The growth is further supported by numerous research efforts to improve efficacy and make interactions safer for commercial crops and the environment. Microbial pesticides are particularly favored due to their ability to control a wide range of pests and diseases, with fungal and bacterial biocontrol agents being the most widely used variants.
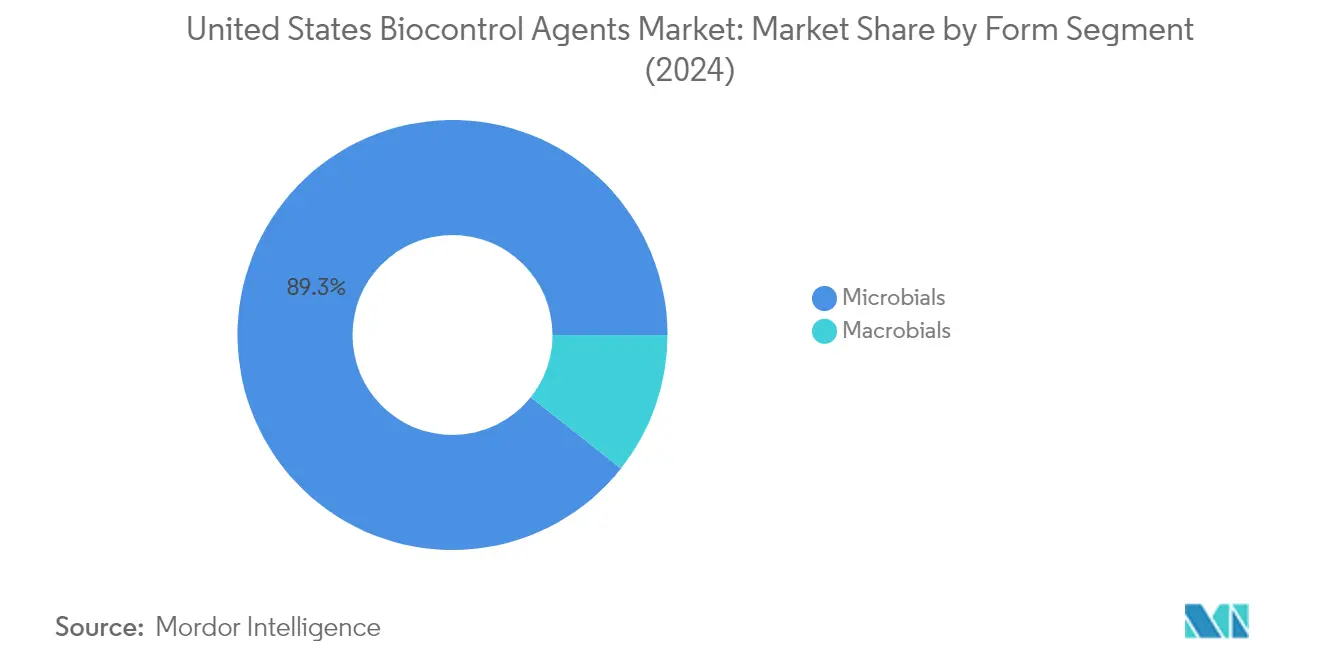
Macrobials in United States Biocontrol Agents Market
The macrobials segment, comprising natural enemies of pests known as invertebrate biocontrol agents, plays a crucial role in the United States biocontrol agents market. This segment includes various organisms such as mites, insect predators, parasitoid wasps, and entomopathogenic nematodes (EPNs). Predators dominate the macrobials segment, accounting for a significant portion of the market value, primarily due to their ability to attack different life stages of pests and even different pest species. The segment's growth is supported by Integrated Pest Management (IPM) extension programs funded by the National Institute of Food and Agriculture (NIFA) across all 50 states, six territories, and four regional IPM centers. These initiatives help create secure and reliable IPM systems that improve agricultural profitability while reducing environmental and public health hazards. The effectiveness of macrobial biocontrol agents in reducing chemical pesticide dependence continues to drive their adoption in sustainable agriculture practices.
Segment Analysis: Crop Type
Row Crops Segment in United States Biocontrol Agents Market
Row crops dominate the United States biocontrol agents market, commanding approximately 71% of the total market value in 2024. The segment's prominence is primarily attributed to the extensive cultivation area of row crops like corn, wheat, rice, and soybean, which accounts for about 71% of the total cultivable land in the country. The increasing adoption of organic farming practices and sustainable agriculture methods has significantly boosted the demand for biocontrol agents in row crop cultivation. Microbial pesticides are the most consumed among the biocontrol agent types by row crops, accounting for nearly 89% of the segment's consumption. The segment is experiencing robust growth driven by government initiatives promoting organic row crop cultivation through financial assistance and increasing demand for organic commodities. The tax reduction on organically grown corn and the expanding organic row crop cultivation area further strengthen the segment's market position.
Horticultural Crops Segment in United States Biocontrol Agents Market
The horticultural crops segment, which includes sugar beets, tomatoes, grapes, oranges, apples, and lettuce, represents a significant portion of the biocontrol agents market. Biological fungicides dominate this segment, with fungal biocontrol agents being the most utilized, accounting for about 63% of the horticultural microbial biocontrol agents market value. The segment has witnessed substantial growth due to increasing consumer awareness about pesticide-free produce and the rising demand for organic fruits and vegetables. The adoption of biological control in horticultural crops has been particularly notable in integrated pest management programs, as these crops are highly susceptible to quality degradation from pest infestations. The segment's growth is further supported by the expanding acreage under organic fruit and vegetable cultivation and the increasing trend toward sustainable farming practices.
Remaining Segments in Crop Type
The cash crops segment, encompassing cotton, sugarcane, coffee, tobacco, cocoa, and tea, plays a vital role in the United States biocontrol agents market. This segment has shown significant potential for growth due to the increasing adoption of organic farming practices in cash crop cultivation. The segment benefits from the rising demand for organic products like organic coffee, tea, and textiles, with a notable preference among U.S. consumers for organic alternatives. The implementation of biocontrol agents in cash crops has been particularly effective in post-harvest applications, helping to safeguard crops during storage and transportation. The segment's development is further supported by various certification programs and organic farming initiatives that encourage the use of biological control methods in cash crop production.
United States Biocontrol Agents Industry Overview
Top Companies in United States Biocontrol Agents Market
The biocontrol agents market in the United States is characterized by continuous product innovation and strategic expansion initiatives by key players. Companies are heavily investing in research and development to improve product efficacy and develop safer interactions with commercial crops. Strategic partnerships and acquisitions have become prominent, with major players acquiring smaller companies to strengthen their regional presence and expand distribution networks. Market leaders are focusing on developing customized solutions for different crop types while expanding their product portfolios through new biocontrol agents discoveries. The industry has witnessed a significant trend towards launching products specifically designed for organic farming, reflecting the growing demand for sustainable agricultural solutions. Companies are also enhancing their technical support services and developing digital platforms to provide better customer service and product guidance.
Fragmented Market with Strong Regional Players
The United States biocontrol agents market exhibits a highly fragmented structure, with the top five players accounting for only a quarter of the market share. The landscape is populated by a mix of global conglomerates and specialized local players, each bringing unique strengths to the market. Global players leverage their extensive research capabilities and international distribution networks, while local specialists excel in providing customized solutions for specific regional agricultural needs. The market has witnessed significant merger and acquisition activity, particularly with larger companies acquiring smaller, innovative firms to enhance their technological capabilities and market reach.
The competitive dynamics are shaped by companies' ability to maintain strong relationships with agricultural distributors and farmers while continuously innovating their product offerings. Market participants range from well-established agricultural input companies to specialized biocontrol agents producers, creating a diverse competitive environment. The industry structure encourages collaboration between companies, particularly in research and development activities, while maintaining competitive differentiation through specialized product offerings and service capabilities. Regional players have maintained their market positions through strong local presence and deep understanding of specific crop requirements.
Innovation and Service Drive Market Success
Success in the biological pest control market increasingly depends on companies' ability to develop effective, targeted solutions while maintaining strong technical support capabilities. Market leaders are focusing on building comprehensive product portfolios that address various crop protection needs while investing in education and awareness programs for farmers. Companies need to establish strong distribution networks and maintain close relationships with agricultural communities to ensure product adoption. The development of integrated pest management solutions and compatibility with conventional farming practices has become crucial for market success. Regulatory compliance and environmental safety demonstrations have emerged as key differentiators in the market.
For new entrants and growing companies, success factors include developing specialized solutions for underserved market segments and establishing strong technical expertise. Companies must focus on building credibility through demonstrated product effectiveness and safety while maintaining competitive pricing strategies. The ability to provide comprehensive customer support and education services has become essential for market growth. Future success will depend on companies' ability to adapt to changing agricultural practices and environmental regulations while maintaining product innovation pipelines. Building strong partnerships with research institutions and agricultural organizations has become increasingly important for maintaining competitive advantage in the agricultural biologicals market.
United States Biocontrol Agents Market Leaders
-
Arizona Biological Control Inc.
-
Beneficial Insectary Inc.
-
Biobee Ltd
-
Bioline AgroSciences Ltd
-
Koppert Biological Systems Inc.
- *Disclaimer: Major Players sorted in no particular order

Need More Details on Market Players and Competitors?
Download PDF
United States Biocontrol Agents Market News
- January 2022: Beneficial Insectary and The Association for Counseling, Education & Support started Shasta Force Farm with an aim to educate the farming community on the importance of chemical-free farming, providing fresh produce and garden healing therapy.
- January 2022: The company announced the merger of Andermatt Biocontrol AG with Andermatt Group AG. After the merger, all companies report directly to Andermatt Group AG, increasing the effectiveness of the management and simplifying the company's structure.
- November 2020: Beneficial Insectary Inc. was acquired by Biobest Group NV in 2020 and became a part of the multinational organization, strengthening its presence and distribution network.
Free With This Report
Along with the report, We also offer a comprehensive and exhaustive data pack on Areas under organic cultivation, one of the key trends that affect the market size of agricultural biologicals. This data pack also includes areas under cultivation by crop types, such as Row Crops (Cereals, Pulses, and Oilseeds), Horticultural Crops (Fruits and Vegetables), and Cash Crops in North America, Europe, Asia-Pacific, South America and Africa.


United States Biocontrol Agents Market Report - Table of Contents
1. EXECUTIVE SUMMARY & KEY FINDINGS
2. REPORT OFFERS
3. INTRODUCTION
- 3.1 Study Assumptions & Market Definition
- 3.2 Scope of the Study
- 3.3 Research Methodology
4. KEY INDUSTRY TRENDS
- 4.1 Area Under Organic Cultivation
- 4.2 Per Capita Spending On Organic Products
-
4.3 Regulatory Framework
- 4.3.1 United States
- 4.4 Value Chain & Distribution Channel Analysis
5. MARKET SEGMENTATION (includes market size in Value in USD and Volume, Forecasts up to 2030 and analysis of growth prospects)
-
5.1 Form
- 5.1.1 Macrobials
- 5.1.1.1 By Organism
- 5.1.1.1.1 Entamopathogenic Nematodes
- 5.1.1.1.2 Parasitoids
- 5.1.1.1.3 Predators
- 5.1.2 Microbials
- 5.1.2.1 By Organism
- 5.1.2.1.1 Bacterial Biocontrol Agents
- 5.1.2.1.2 Fungal Biocontrol Agents
- 5.1.2.1.3 Other Microbials
-
5.2 Crop Type
- 5.2.1 Cash Crops
- 5.2.2 Horticultural Crops
- 5.2.3 Row Crops
6. COMPETITIVE LANDSCAPE
- 6.1 Key Strategic Moves
- 6.2 Market Share Analysis
- 6.3 Company Landscape
-
6.4 Company Profiles (includes Global Level Overview, Market Level Overview, Core Business Segments, Financials, Headcount, Key Information, Market Rank, Market Share, Products and Services, and Analysis of Recent Developments).
- 6.4.1 Andermatt Group AG
- 6.4.2 Arizona Biological Control Inc.
- 6.4.3 Beneficial Insectary Inc.
- 6.4.4 Biobee Ltd
- 6.4.5 Bioline AgroSciences Ltd
- 6.4.6 Bioworks Inc.
- 6.4.7 Koppert Biological Systems Inc.
7. KEY STRATEGIC QUESTIONS FOR AGRICULTURAL BIOLOGICALS CEOS
8. APPENDIX
-
8.1 Global Overview
- 8.1.1 Overview
- 8.1.2 Porter’s Five Forces Framework
- 8.1.3 Global Value Chain Analysis
- 8.1.4 Market Dynamics (DROs)
- 8.2 Sources & References
- 8.3 List of Tables & Figures
- 8.4 Primary Insights
- 8.5 Data Pack
- 8.6 Glossary of Terms
You Can Purchase Parts Of This Report. Check Out Prices For Specific Sections
Get Price Break-up Now
List of Tables & Figures
- Figure 1:
- AREA UNDER ORGANIC CULTIVATION IN HECTARES, UNITED STATES, 2017 - 2022
- Figure 2:
- PER CAPITA SPENDING ON ORGANIC PRODUCTS IN USD, UNITED STATES, 2017 - 2022
- Figure 3:
- UNITED STATES BIOCONTROL AGENTS MARKET, VOLUME, GRAM, 2017 - 2029
- Figure 4:
- UNITED STATES BIOCONTROL AGENTS MARKET, VALUE, USD, 2017 - 2029
- Figure 5:
- BIOCONTROL AGENTS CONSUMPTION IN GRAM, UNITED STATES, 2017 - 2029
- Figure 6:
- BIOCONTROL AGENTS CONSUMPTION IN USD, UNITED STATES, 2017 - 2029
- Figure 7:
- BIOCONTROL AGENTS CONSUMPTION VOLUME BY FORM IN %, UNITED STATES, 2017 VS 2023 VS 2029
- Figure 8:
- BIOCONTROL AGENTS CONSUMPTION VALUE BY FORM IN %, UNITED STATES, 2017 VS 2023 VS 2029
- Figure 9:
- MACROBIALS CONSUMPTION IN GRAM, UNITED STATES, 2017 - 2029
- Figure 10:
- MACROBIALS CONSUMPTION IN USD, UNITED STATES, 2017 - 2029
- Figure 11:
- MACROBIALS CONSUMPTION VOLUME BY ORGANISM IN %, UNITED STATES, 2017 VS 2023 VS 2029
- Figure 12:
- MACROBIALS CONSUMPTION VALUE BY ORGANISM IN %, UNITED STATES, 2017 VS 2023 VS 2029
- Figure 13:
- ENTAMOPATHOGENIC NEMATODES CONSUMPTION IN GRAM, UNITED STATES, 2017 - 2029
- Figure 14:
- ENTAMOPATHOGENIC NEMATODES CONSUMPTION IN USD, UNITED STATES, 2017 - 2029
- Figure 15:
- ENTAMOPATHOGENIC NEMATODES CONSUMPTION VALUE BY CROP TYPE IN %, UNITED STATES, 2022 VS 2029
- Figure 16:
- PARASITOIDS CONSUMPTION IN GRAM, UNITED STATES, 2017 - 2029
- Figure 17:
- PARASITOIDS CONSUMPTION IN USD, UNITED STATES, 2017 - 2029
- Figure 18:
- PARASITOIDS CONSUMPTION VALUE BY CROP TYPE IN %, UNITED STATES, 2022 VS 2029
- Figure 19:
- PREDATORS CONSUMPTION IN GRAM, UNITED STATES, 2017 - 2029
- Figure 20:
- PREDATORS CONSUMPTION IN USD, UNITED STATES, 2017 - 2029
- Figure 21:
- PREDATORS CONSUMPTION VALUE BY CROP TYPE IN %, UNITED STATES, 2022 VS 2029
- Figure 22:
- MICROBIALS CONSUMPTION IN GRAM, UNITED STATES, 2017 - 2029
- Figure 23:
- MICROBIALS CONSUMPTION IN USD, UNITED STATES, 2017 - 2029
- Figure 24:
- MICROBIALS CONSUMPTION VOLUME BY ORGANISM IN %, UNITED STATES, 2017 VS 2023 VS 2029
- Figure 25:
- MICROBIALS CONSUMPTION VALUE BY ORGANISM IN %, UNITED STATES, 2017 VS 2023 VS 2029
- Figure 26:
- BACTERIAL BIOCONTROL AGENTS CONSUMPTION IN GRAM, UNITED STATES, 2017 - 2029
- Figure 27:
- BACTERIAL BIOCONTROL AGENTS CONSUMPTION IN USD, UNITED STATES, 2017 - 2029
- Figure 28:
- BACTERIAL BIOCONTROL AGENTS CONSUMPTION VALUE BY CROP TYPE IN %, UNITED STATES, 2022 VS 2029
- Figure 29:
- FUNGAL BIOCONTROL AGENTS CONSUMPTION IN GRAM, UNITED STATES, 2017 - 2029
- Figure 30:
- FUNGAL BIOCONTROL AGENTS CONSUMPTION IN USD, UNITED STATES, 2017 - 2029
- Figure 31:
- FUNGAL BIOCONTROL AGENTS CONSUMPTION VALUE BY CROP TYPE IN %, UNITED STATES, 2022 VS 2029
- Figure 32:
- OTHER MICROBIALS CONSUMPTION IN GRAM, UNITED STATES, 2017 - 2029
- Figure 33:
- OTHER MICROBIALS CONSUMPTION IN USD, UNITED STATES, 2017 - 2029
- Figure 34:
- OTHER MICROBIALS CONSUMPTION VALUE BY CROP TYPE IN %, UNITED STATES, 2022 VS 2029
- Figure 35:
- BIOCONTROL AGENTS CONSUMPTION IN GRAM, UNITED STATES, 2017 - 2029
- Figure 36:
- BIOCONTROL AGENTS CONSUMPTION IN USD, UNITED STATES, 2017 - 2029
- Figure 37:
- BIOCONTROL AGENTS CONSUMPTION VOLUME BY CROP TYPE IN %, UNITED STATES, 2017 VS 2023 VS 2029
- Figure 38:
- BIOCONTROL AGENTS CONSUMPTION VALUE BY CROP TYPE IN %, UNITED STATES, 2017 VS 2023 VS 2029
- Figure 39:
- BIOCONTROL AGENTS CONSUMPTION BY CASH CROPS IN GRAM, UNITED STATES, 2017 - 2029
- Figure 40:
- BIOCONTROL AGENTS CONSUMPTION BY CASH CROPS IN USD, UNITED STATES, 2017 - 2029
- Figure 41:
- BIOCONTROL AGENTS CONSUMPTION VALUE BY FORM IN %, UNITED STATES, 2022 VS 2029
- Figure 42:
- BIOCONTROL AGENTS CONSUMPTION BY HORTICULTURAL CROPS IN GRAM, UNITED STATES, 2017 - 2029
- Figure 43:
- BIOCONTROL AGENTS CONSUMPTION BY HORTICULTURAL CROPS IN USD, UNITED STATES, 2017 - 2029
- Figure 44:
- BIOCONTROL AGENTS CONSUMPTION VALUE BY FORM IN %, UNITED STATES, 2022 VS 2029
- Figure 45:
- BIOCONTROL AGENTS CONSUMPTION BY ROW CROPS IN GRAM, UNITED STATES, 2017 - 2029
- Figure 46:
- BIOCONTROL AGENTS CONSUMPTION BY ROW CROPS IN USD, UNITED STATES, 2017 - 2029
- Figure 47:
- BIOCONTROL AGENTS CONSUMPTION VALUE BY FORM IN %, UNITED STATES, 2022 VS 2029
- Figure 48:
- UNITED STATES BIOCONTROL AGENTS MARKET, MOST ACTIVE COMPANIES, BY NUMBER OF STRATEGIC MOVES, 2017-2022
- Figure 49:
- UNITED STATES BIOCONTROL AGENTS MARKET, MOST ADOPTED STRATEGIES, 2017-2022
- Figure 50:
- UNITED STATES BIOCONTROL AGENTS MARKET SHARE(%), BY MAJOR PLAYERS
United States Biocontrol Agents Industry Segmentation
Macrobials, Microbials are covered as segments by Form. Cash Crops, Horticultural Crops, Row Crops are covered as segments by Crop Type.| Form | Macrobials | By Organism | Entamopathogenic Nematodes | |
| Parasitoids | ||||
| Predators | ||||
| Microbials | By Organism | Bacterial Biocontrol Agents | ||
| Fungal Biocontrol Agents | ||||
| Other Microbials | ||||
| Crop Type | Cash Crops | |||
| Horticultural Crops | ||||
| Row Crops | ||||
Need A Different Region or Segment?
Customize Now
Market Definition
- AVERAGE DOSAGE RATE - The average application rate is the average volume of biocontrol agents applied per hectare of farmland in the respective region/country.
- CROP TYPE - Crop type includes Row crops (Cereals, Pulses, Oilseeds), Horticultural Crops (Fruits and vegetables) and Cash Crops (Plantation Crops, Fibre Crops and Other Industrial Crops)
- FUNCTION - The Crop Protection function of agirucultural biological include products that prevent or control various biotic and abiotic stress.
- TYPE - Biocontrol agents are the natural predators and parasitoids used to control various pests. Biocontrol agents include both microbials (Microorganisms) and macrobials (Insects).
| Keyword | Definition |
|---|---|
| Cash Crops | Cash crops are non-consumable crops sold as a whole or part of the crop to manufacture end-products to make a profit. |
| Integrated Pest Management (IPM) | IPM is an environment-friendly and sustainable approach to control pests in various crops. It involves a combination of methods, including biological controls, cultural practices, and selective use of pesticides. |
| Bacterial biocontrol agents | Bacteria used to control pests and diseases in crops. They work by producing toxins harmful to the target pests or competing with them for nutrients and space in the growing environment. Some examples of commonly used bacterial biocontrol agents include Bacillus thuringiensis (Bt), Pseudomonas fluorescens, and Streptomyces spp. |
| Plant Protection Product (PPP) | A plant protection product is a formulation applied to crops to protect from pests, such as weeds, diseases, or insects. They contain one or more active substances with other co-formulants such as solvents, carriers, inert material, wetting agents or adjuvants formulated to give optimum product efficacy. |
| Pathogen | A pathogen is an organism causing disease to its host, with the severity of the disease symptoms. |
| Parasitoids | Parasitoids are insects that lay their eggs on or within the host insect, with their larvae feeding on the host insect. In agriculture, parasitoids can be used as a form of biological pest control, as they help to control pest damage to crops and decrease the need for chemical pesticides. |
| Entomopathogenic Nematodes (EPN) | Entomopathogenic nematodes are parasitic roundworms that infect and kill pests by releasing bacteria from their gut. Entomopathogenic nematodes are a form of biocontrol agents used in agriculture. |
| Vesicular-arbuscular mycorrhiza (VAM) | VAM fungi are mycorrhizal species of fungus. They live in the roots of different higher-order plants. They develop a symbiotic relationship with the plants in the roots of these plants. |
| Fungal biocontrol agents | Fungal biocontrol agents are the beneficial fungi that control plant pests and diseases. They are an alternative to chemical pesticides. They infect and kill the pests or compete with pathogenic fungi for nutrients and space. |
| Biofertilizers | Biofertilizers contain beneficial microorganisms that enhance soil fertility and promote plant growth. |
| Biopesticides | Biopesticides are natural/bio-based compounds used to manage agricultural pests using specific biological effects. |
| Predators | Predators in agriculture are the organisms that feed on pests and help control pest damage to the crops. Some common predator species used in agriculture include ladybugs, lacewings, and predatory mites. |
| Biocontrol agents | Biocontrol agents are living organisms used to control pests and diseases in agriculture. They are alternatives to chemical pesticides and are known for their lesser impact on the environment and human health. |
| Organic Fertilizers | Organic fertilizer is composed of animal or vegetable matter used alone or in combination with one or more non-synthetically derived elements or compounds used for soil fertility and plant growth. |
| Protein hydrolysates (PHs) | Protein hydrolysate-based biostimulants contain free amino acids, oligopeptides, and polypeptides produced by enzymatic or chemical hydrolysis of proteins, primarily from vegetal or animal sources. |
| Biostimulants/Plant Growth Regulators (PGR) | Biostimulants/Plant Growth Regulators (PGR) are substances derived from natural resources to enhance plant growth and health by stimulating plant processes (metabolism). |
| Soil Amendments | Soil Amendments are substances applied to soil that improve soil health, such as soil fertility and soil structure. |
| Seaweed Extract | Seaweed extracts are rich in micro and macronutrients, proteins, polysaccharides, polyphenols, phytohormones, and osmolytes. These substances boost seed germination and crop establishment, total plant growth and productivity. |
| Compounds related to biocontrol and/or promoting growth (CRBPG) | Compounds related to biocontrol or promoting growth (CRBPG) are the ability of a bacteria to produce compounds for phytopathogen biocontrol and plant growth promotion. |
| Symbiotic Nitrogen-Fixing Bacteria | Symbiotic nitrogen-fixing bacteria such as Rhizobium obtain food and shelter from the host, and in return, they help by providing fixed nitrogen to the plants. |
| Nitrogen Fixation | Nitrogen fixation is a chemical process in soil which converts molecular nitrogen into ammonia or related nitrogenous compounds. |
| ARS (Agricultural Research Service) | ARS is the U.S. Department of Agriculture's chief scientific in-house research agency. It aims to find solutions to agricultural problems faced by the farmers in the country. |
| Phytosanitary Regulations | Phytosanitary regulations imposed by the respective government bodies check or prohibit the importation and marketing of certain insects, plant species, or products of these plants to prevent the introduction or spread of new plant pests or pathogens. |
| Ectomycorrhizae (ECM) | Ectomycorrhiza (ECM) is a symbiotic interaction of fungi with the feeder roots of higher plants in which both the plant and the fungi benefit through the association for survival. |
Need More Details on Market Definition?
Ask a Question
Research Methodology
Mordor Intelligence follows a four-step methodology in all our reports.
- Step-1: Identify Key Variables: In order to build a robust forecasting methodology, the variables and factors identified in Step-1 are tested against available historical market numbers. Through an iterative process, the variables required for market forecast are set and the model is built on the basis of these variables.
- Step-2: Build a Market Model: Market-size estimations for the forecast years are in nominal terms. Inflation is not a part of the pricing, and the average selling price (ASP) is kept constant throughout the forecast period.
- Step-3: Validate and Finalize: In this important step, all market numbers, variables and analyst calls are validated through an extensive network of primary research experts from the market studied. The respondents are selected across levels and functions to generate a holistic picture of the market studied.
- Step-4: Research Outputs: Syndicated Reports, Custom Consulting Assignments, Databases & Subscription Platforms.

Get More Details On Research Methodology
Download PDF


