
United States Automotive Dealership Market Size and Share
Market Overview
| Study Period | 2019 - 2031 |
|---|---|
| Forecast Data Period | 2026 - 2031 |
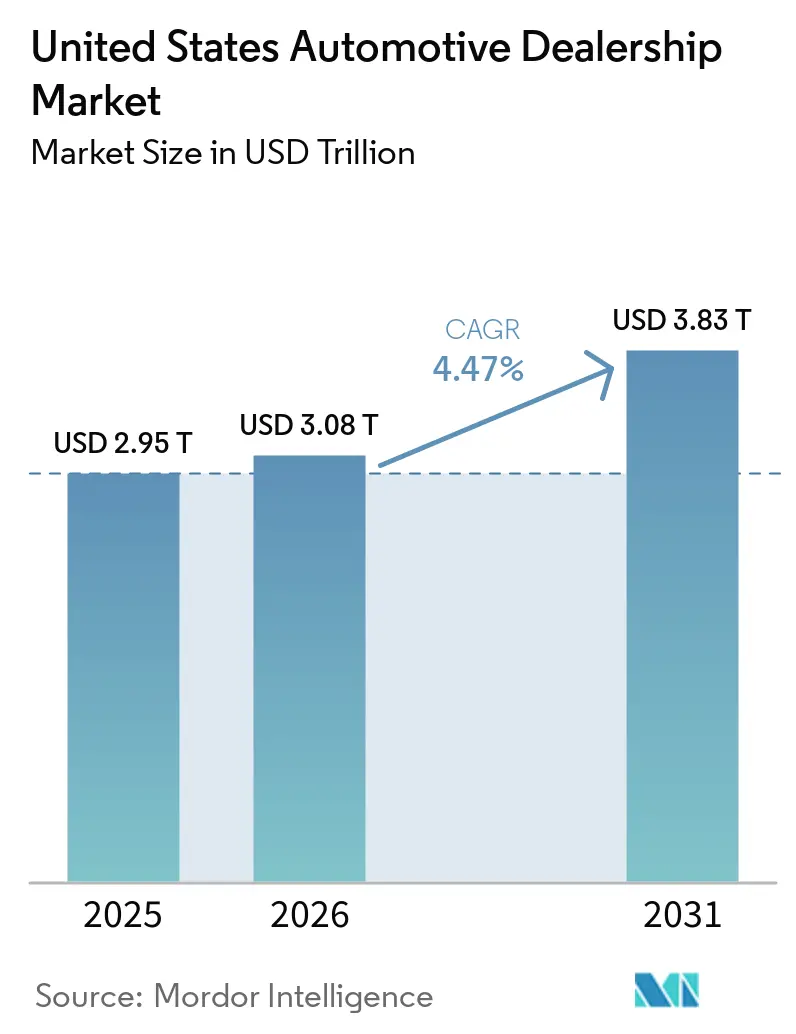
| Base Year Market Size (2025) | USD 2.95 Trillion |
| Market Size (2026) | USD 3.08 Trillion |
| Market Size (2031) | USD 3.83 Trillion |
| Growth Rate (2026 - 2031) | 4.47 % |
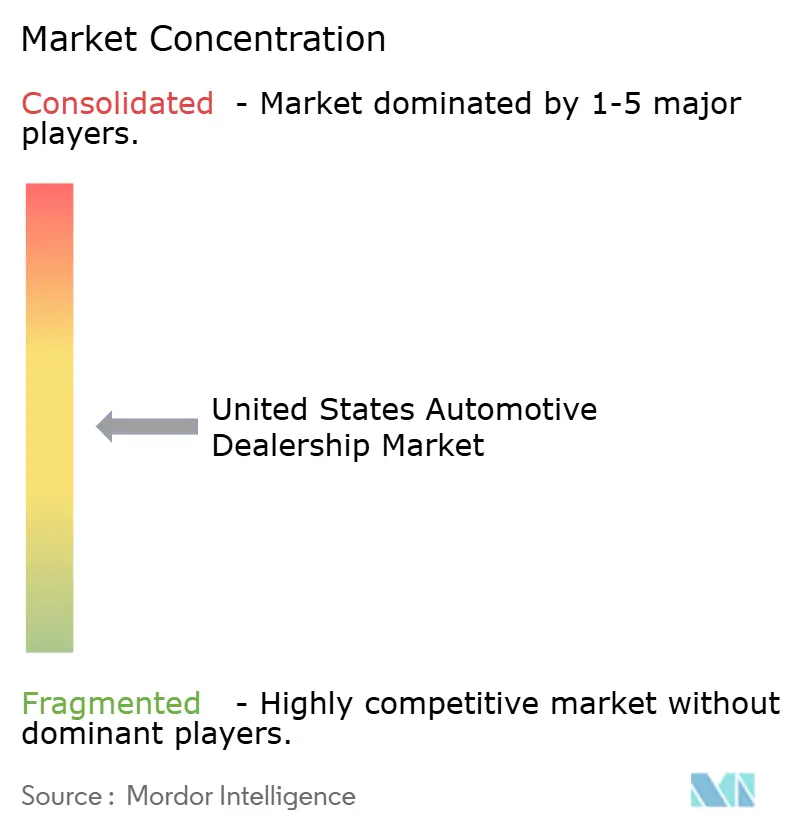
| Market Concentration | Medium |
Major Players *Disclaimer: Major Players sorted in no particular order Image © Mordor Intelligence. Reuse requires attribution under CC BY 4.0. | |
United States Automotive Dealership Market Analysis by Mordor Intelligence
The United States automotive dealership market size is expected to grow from USD 2.95 trillion in 2025 to USD 3.08 trillion in 2026 and is forecast to reach USD 3.83 trillion by 2031 at a 4.47% CAGR over 2026-2031. Well-balanced inventories, surging certified pre-owned (CPO) demand, and heavy electrification investments are underpinning steady revenue gains even as online price transparency squeezes gross margins. Dealer-led expansion of finance and insurance (F&I) portfolios is offsetting pressure on front-end profitability, while favorable state legislation is accelerating digital retail adoption. Rising medium- and heavy-commercial-vehicle sales tied to fleet electrification offer an incremental profit pool, and sustained consumer preference for light trucks and SUVs continues to lift average transaction values. At the same time, substantial capital requirements for EV-ready service bays and over-the-air (OTA) software capability are widening the competitive gap between well-funded consolidators and under-capitalized independents.
Key Report Takeaways
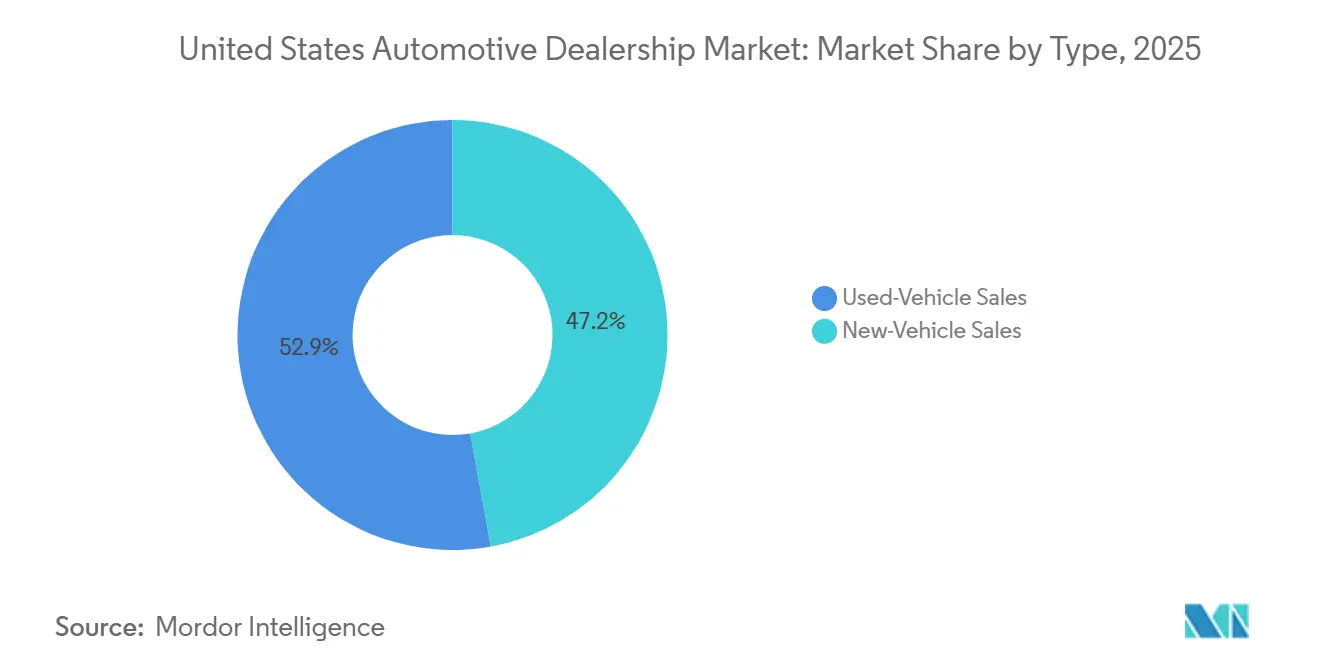
- By type, used-vehicle transactions captured 52.85% of the United States automotive dealership market share in 2025, whereas new-vehicle sales are poised to grow at a 5.41% CAGR through 2031.
- By retailer, franchised dealers retained a 57.60% share of the United States automotive dealership market size in 2025, while direct-to-consumer digital platforms will record the highest forecast CAGR at 6.02% to 2031.
- By vehicle type, light trucks and SUVs led 60.70% of the United States automotive dealership market share in 2025; medium and heavy commercial vehicles are projected to advance at a 4.97% CAGR to 2031.
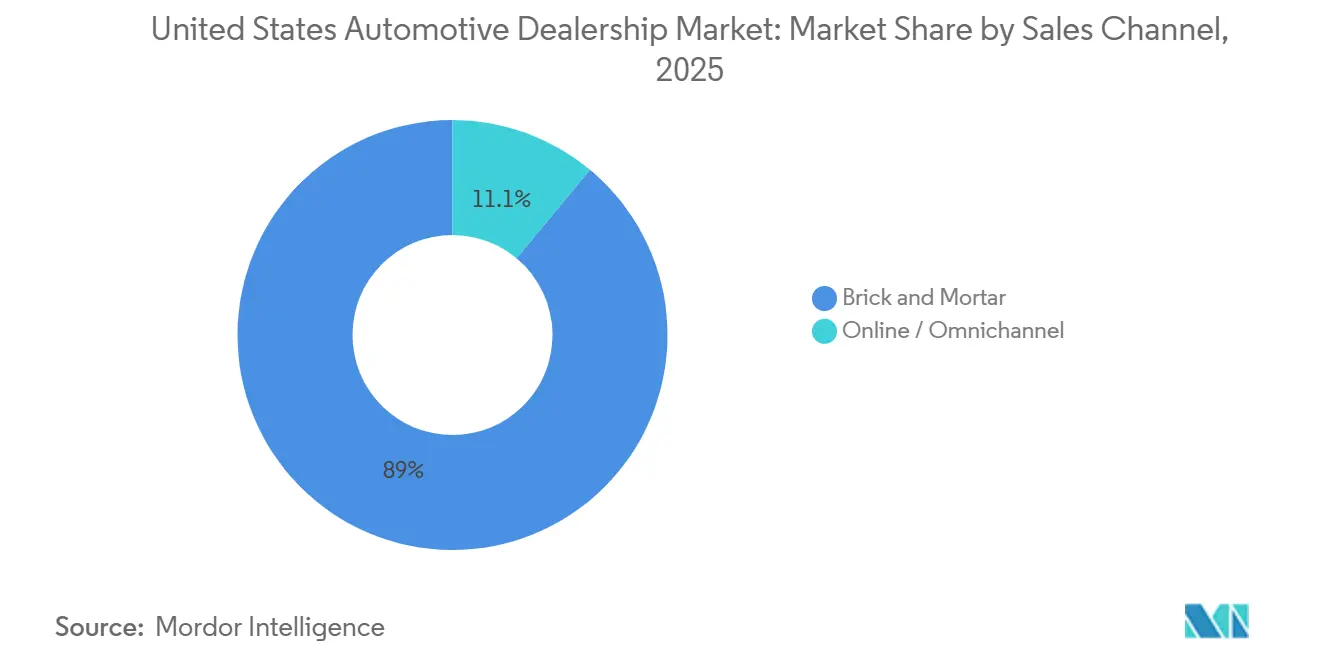
- By sales channel, brick-and-mortar outlets accounted for 88.95% of the United States automotive dealership market share in 2025; online and omnichannel sales will expand at a 7.33% CAGR to 2031.
- By customer segment, individual buyers constituted 76.55% of the United States automotive dealership market share in 2025, yet fleet and corporate clients are set to advance at a 6.51% CAGR to 2031.
- By region, the South dominated with 36.20% of the United States automotive dealership market share in 2025 and is set to grow fastest at 5.78% CAGR through 2031.
Note: Market size and forecast figures in this report are generated using Mordor Intelligence’s proprietary estimation framework, updated with the latest available data and insights as of 2026.
United States Automotive Dealership Market Trends and Insights
Drivers Impact Analysis*
| Driver | (~) % Impact on CAGR Forecast | Geographic Relevance | Impact Timeline |
|---|---|---|---|
| Accelerating EV Model Launches | +0.9% | West and Northeast lead, spreading South and Midwest | Long term (≥ 4 years) |
| New Vehicle Inventory Recover | +0.8% | National, strongest in South and West | Short term (≤ 2 years) |
| Dealers Expand F&I Products | +0.7% | National, state regulations vary | Medium term (2-4 years) |
| Growing Certified Pre-Owned Programs | +0.6% | Nationwide, premium in Northeast luxury hubs | Medium term (2-4 years) |
| State-Level Digital Retailing Laws | +0.4% | Key states such as California, Texas, Illinois | Medium term (2-4 years) |
| OEM Subscription Models | +0.3% | National, concentrated in urban markets | Long term (≥ 4 years) |
| Source: Mordor Intelligence | |||
Accelerating EV Model Launches
Franchise groups have pledged billions for EV-ready showrooms and service bays [1]. Capital outlays per location range from USD 100,000 for Level 2 chargers to more than USD 1 million, where Level 3 DC fast-charging plus utility upgrades are required. Ford’s Model e Certified Elite program illustrates OEM mandates that bundle training, tooling, and charger installation under strict timelines, reshaping cap-ex planning cycles for retailers. Early movers capture incremental service profits from battery warranty work and software-subscription enablement, offsetting EVs’ lower mechanical-repair frequency. Geographic disparity persists; dealers in California and New York see higher charger utilization than peers in the Upper Midwest, yet nationwide EV registration growth in 2024 supports long-run investment viability.
Recovery in New-Vehicle Inventory Levels
OEM production stability lifted dealer stock to 3.23 million units by November 2024, close to the 3.4 – 3.5 million pre-pandemic norm. Improved supply lets retailers restore traditional incentive programs and recoup volume-based bonuses, reversing two years of margin erosion caused by constrained pipelines. Domestic brands, supported by normalized chip supply, re-establish competitive lease offers that draw payment-sensitive buyers back to showrooms. Dealers must manage slower turn-rates than in 2022’s shortage era, prompting heavier reliance on AI-driven demand-forecasting engines to avoid over-stocking. Robust inventory also strengthens the negotiating power of large dealer groups, who can bulk-purchase allocations, widening their cost advantage over smaller independents.
Dealer-Led Expansion of F&I Products
New-vehicle payment elongation has heightened consumer anxiety over long-term repair costs, making service contracts and GAP coverage feel essential rather than optional. Dealers are customizing F&I menus by powertrain, including ICE, hybrid, and EV, to optimize penetration while adhering to disparate state disclosure rules. Digital contracting platforms accelerate approvals and cut delivery times, helping preserve CSI scores even as lenders tighten underwriting standards. The January 2025 vacancy of the FTC’s CARS Rule ended imminent rulemaking. Yet, its compliance benchmarks remain industry best practice, prompting dealers to invest in auditing tools that cut exposure to penalties. Enhanced transparency boosts consumer uptake, transforming F&I into a stabilizing profit hedge against front-end price compression.
Growth of Certified Pre-Owned (CPO) Programs
Certified Pre-Owned (CPO) volumes rebounded in 2024 as warranty-seeking buyers migrated from historically expensive new vehicles, pushing CPO margins for standard used cars. Manufacturers such as Toyota broadened program tiers, allowing franchised outlets to capture 10-15% premiums above comparable non-certified units while keeping days-supply lean. Dealers that embed CPO inventory analytics into acquisition platforms secure faster turns, roughly 25% quicker than non-certified stock, freeing floorplan capacity for higher-margin vehicles. Continuous shortages of lease returns until late 2025 further elevate residual values, preserving dealer gross even in the face of tighter credit conditions. As CPO transforms from an ancillary offer into a core profit pillar, independent operators without OEM certification pathways risk ceding share to franchise rivals.
Restraints Impact Analysis*
| Restraint | (~) % Impact on CAGR Forecast | Geographic Relevance | Impact Timeline |
|---|---|---|---|
| Higher CAPEX For Service Upgrades | -0.6% | National, rural dealers face toughest hurdle | Medium term (2-4 years) |
| OEM Direct-to-Consumer Models | -0.5% | National, strongest in EV-friendly states | Long term (≥ 4 years) |
| Price Transparency Compresses Profit Margins | -0.4% | Urban markets most affected | Short term (≤ 2 years) |
| Increased FTC Compliance Costs | -0.2% | National, state-level variations | Short term (≤ 2 years) |
| Source: Mordor Intelligence | |||
High CAPEX for EV and ADAS Service Upgrades
EV battery hoists, insulated storage, and ADAS calibration rigs cost USD 56,000-650,000 per rooftop [2]. Access to affordable power feeds and specialized technicians is especially constrained in rural markets, forcing some single-point operators to exit instead of refinancing aging facilities. Consolidators enjoy scale cost leverage and can amortize tooling over larger throughput, widening their variable-cost gap. OEM reimbursement programs partially defray expenses but usually require volume commitments, embedding further consolidation incentives. Consequently, capital intensity is the most immediate structural headwind for independents, lowering market-wide growth by an estimated 0.6 percentage points.
OEM Direct-to-Consumer Models
Tesla’s established agency approach and emerging entrants' advertising order-online delivery-storefront hybrids test the durability of franchise protections. While 48 states still restrict factory sales, several OEMs pilot agency pricing that fixes MSRP and positions dealers mainly as delivery and service partners. Such frameworks could erode traditional front-end grosses but stabilize inventory cost risk during downturns. Dealer associations continue lobbying to embed compensation guarantees into any new legislative carve-outs. Yet, a long-term margin drag of roughly 0.5 percentage points on the United States automotive dealership market CAGR is anticipated.
*Our forecasts treat driver/restraint impacts as directional, not additive. The impact forecasts reflect baseline growth, mix effects, and variable interactions.
Segment Analysis
By Type: Used Vehicles Anchor Revenue, New Inventory Fuels Growth
The United States automotive dealership market size for used vehicles held a 52.85% share in 2025, cementing its role as the channel’s economic backbone. Elevated residual values, bolstered by curtailed lease returns, helped dealers protect grosses even as wholesale indices normalized. Margins continue to benefit from private-party acquisition tools that circumvent auction fees and reduce inbound logistics costs. Certified tiers maintain premium pricing and 25% faster turn-rates, improving cash velocity that supports floorplan interest outlays.
New vehicles are projected to log a 5.41% CAGR, outpacing used growth through 2031 as OEM production constraints fade. Incentives averaging 6.8% of transaction price in early 2025 have pulled sidelined buyers back into showrooms, especially on entry-level trims. As supply normalizes, the United States automotive dealership market share for new vehicles is expected to climb modestly, though pricing transparency and agency pilots will cap front-end gross upside. Dealers tighten reconditioning cycles on trade-ins, aiming to flip used inventory within 27 days versus the 35-day industry median, sustaining blended gross performance across both vehicle streams.
By Retailer: Franchise Scale Meets Digital Agility
Franchised groups controlled 57.60% of the United States automotive dealership market in 2025, and direct-to-consumer digital platforms will record the highest forecast CAGR at 6.02% to 2031, underpinned by exclusive OEM allocations, warranty authority, and financing captive ties that erect high entry barriers. Market consolidators leverage acquisition synergies such as Lithia’s economies in procurement and marketing to expand EBITDA per rooftop. Digital pure-plays leverage asset-light models, booking double-digit unit gains despite narrow contribution margins. Still, omnichannel hybrids are emerging, with Amazon Autos integrating dealer fulfillment to keep last-mile logistics cost-effective while preserving consumer convenience.
Independent lots retain relevance where price-sensitive shoppers value negotiation flexibility and non-OEM warranty bundles. Yet franchise operators’ mandated EV tooling and OTA software rights grant them a structural advantage in an electrified future. Over time, the United States automotive dealership market size is expected to skew toward high-performing multi-state groups as succession planning and capital intensity prompt single-store owners to divest. Franchisees that invest in click-to-buy platforms and same-day service lanes will outperform peers relying solely on legacy walk-in traffic.
By Vehicle Type: Trucks Dominate, Commercial EVs Accelerate
Light trucks and SUVs captured 60.70% revenue of the United States automotive dealership market in 2025, aided by favorable fuel-economy regulations for body-on-frame designs and strong residuals that keep payment-to-utility ratios attractive. Automakers’ shift from sedans continues, compressing passenger-car selection on dealer lots and channeling marketing dollars toward profitable pickup trims.
Medium and heavy commercial vehicle demand is set to climb at a 4.97% CAGR as e-commerce and last-mile delivery fleets electrify to meet decarbonization mandates. Dealers can certify high-voltage technicians and unlock annuity-like service streams from battery inspection contracts and telemetry-driven preventive maintenance. The United States automotive dealership industry is also seeing OEMs bundle fleet-management software into vehicle sales, expanding dealers’ consultative role and embedding them deeper into client operations.
By Sales Channel: Showrooms Reinvent the In-Store Experience
Physical storefronts (brick-and-mortar) processed 88.95% of the United States automotive dealership market transactions in 2025, reinforcing the enduring importance of tactile vehicle evaluation and trade-in appraisal. Dealers redesign facilities with express delivery bays and customer lounge workspaces to shorten cycle time and lift CSI metrics.
Online pathways are projected to scale at a 7.33% CAGR, fueled by state legalization of e-contracting, remote wet-signature equivalency, and home-delivery provisions. Retailers adopting unified data stacks seamlessly migrate consumers between website, chatbot, and in-store desks, slashing deal time by 42 minutes on average. As omnichannel matures, the United States automotive dealership market volume will still originate from dealers who master hybrid engagement rather than pure online sales.
By Customer Segment: Fleet Electrification Outpaces Retail Gains
Retail buyers delivered 76.55% of the United States automotive dealership market in 2025, but are slowing as urban consumers gravitate toward subscription models offering lower commitment and bundled insurance. OEM-backed subscriptions sold through dealers, such as Ford Pro, are scaling rapidly, with 400,000 accounts generating SaaS-like recurring revenue streams.
Fleet and corporate volumes are expanding 6.51% annually, bolstered by federal commercial EV tax incentives that cut the total cost of ownership. Dealers offering volume-purchase rebates, consolidated billing, and depot-charging consulting lock in multi-year service revenue. Consequently, the United States automotive dealership market share attributed to fleets is projected to rise by 2031, creating a more balanced customer mix that stabilizes cyclical retail swings.
Geography Analysis
The South contributed 36.20% of 2025 turnover and is projected to advance at a 5.78% CAGR through 2031, buoyed by robust in-migration, comparatively lenient franchise regulations, and a vehicle mix tilted 68% toward light trucks that command higher front-end grosses. States such as Texas and Georgia continue to green-light direct E-signature closings, accelerating omnichannel penetration and lifting per-rooftop volumes as labor markets remain tight in the Sun Belt.
The Northeast is shaped by dense metros where showrooms occupy high-cost real estate, and stringent emission rules accelerate EV adoption. New York’s target for 35% zero-emission sales penetration by 2026 is forcing dealers to retrofit legacy rooftops with DC fast chargers, often supported by utility rebates covering up to 80% of make-ready costs. While passenger-car share is higher here than in other regions, rising insurance premiums nudge buyers toward compact crossovers that balance space with cost.
Midwestern dealers benefit from deep supplier ecosystems and a customer base loyal to domestic brands, sustaining steady replacement demand for pickups used in agriculture and construction. Infrastructure bill spending on highways and bridges is stimulating heavy-duty truck sales, opening service-contract volume that offsets slower retail sedan turnover. Meanwhile, the West’s early-adopter population and state EV rebates of USD 2,000-USD 4,500 have propelled battery-electric registrations to 18% of new-vehicle sales in 2024, stimulating dealership investment in venture-shared charging plazas.
Regulatory Landscape
The United States automotive dealership market operates under a mix of federal consumer-protection and state franchise and dealer-licensing regimes. At the federal level, advertising and pricing practices have drawn increased scrutiny, with the Federal Trade Commission (FTC) issuing warning letters in March 2026 to 97 auto dealerships regarding advertising and pricing conduct, and publicly disclosing the dealer names in May 2026. Even after the earlier vacatur of the FTCs CARS Rule, its expectations around truthful pricing, fee disclosure, and add-on product transparency continue to shape dealer compliance programs.
State-level rules vary materially in how dealers execute digital retailing, fee disclosures, and advertising claims. Several states and attorneys general have aligned guidance with federal transparency themes, including Louisiana Motor Vehicle Commission updates to advertising regulations and a Massachusetts Attorney General advisory addressing documentation fees. Dealers also need operational controls that support compliance with Regulation Z (Truth in Lending Act) for credit advertising and the TCPA for customer outreach, reinforcing investment in audit tooling, call and text consent management, and standardized e-contracting workflows.
Value Chain Analysis
The dealership value chain starts with OEM production and allocation, moves through distribution and wholesale logistics into retail operations across franchised and independent rooftops, and then extends into high-margin aftersales. Retailers manage inventory acquisition (new allocations and used sourcing), reconditioning, merchandising, pricing, and delivery, while coordinating third-party dependencies such as floorplan lenders, auction platforms, logistics providers, and credit bureaus. Market structure data also points to a fragmented operating base beneath consolidators, with the 2022 Economic Census identifying 17,242 firms across more than 21,000 locations, which helps explain wide variation in process maturity and access to capital.
Downstream, profit pools extend beyond vehicle gross into finance and insurance (F&I), warranty administration, parts, and service, increasingly tied to software activation and subscription enablement. The operating model is becoming more capex- and capability-intensive as dealers add EV charging, high-voltage tooling, and ADAS calibration, while also building digital retail stacks that connect lead generation, inventory, underwriting, and contracting. This shift tends to favor groups able to spread technology and compliance costs across multi-location networks, with centralized procurement, marketing, and reconditioning helping improve turn times and reduce acquisition friction for used and CPO inventory.
Competitive Landscape
Market consolidation continues as large publicly traded groups deploy cash flows from record 2021-2023 profits to acquire smaller rooftops. Lithia Motors eclipsed AutoNation in 2024 unit sales after a string of Midwest and Southeast acquisitions, pushing the top-10 groups’ combined share to a significant share of the United States automotive dealership market. Despite this upswing, the field remains moderately concentrated, leaving room for regional champions to defend territory through community engagement and bespoke service offerings.
Strategic themes include luxury-brand clustering, omnichannel technology rollout, and EV-infrastructure scaling. Group 1 Automotive’s USD 210 million-revenue Mercedes-Benz of Buckhead buyout secured premium mix growth and consolidated parts distribution efficiencies[3]. Reynolds and Reynolds’ partnership with UVeye is delivering AI-driven underbody inspection lanes, enhancing upsell rates for tires and safety repairs. Meanwhile, retailers in low-EV-adoption states are deferring charger spend, potentially losing allocation priority once federal tax credits tighten post-2026.
Competitive threats from nontraditional players are crystallizing. Amazon Autos launched national used-vehicle listings in August 2025, leveraging Prime-scale logistics while keeping dealer compliance intact by routing final paperwork through licensed retailers. Direct-to-consumer startups eyeing agency models must still navigate franchise statutes, but their marketing spend is compressing search-engine ad rates for traditional dealers. Consequently, success hinges on balanced capital allocation: investing enough in digital and EV capabilities to remain relevant, yet safeguarding liquidity for cyclical downturn resilience.
United States Automotive Dealership Industry Leaders
-
Auto Nation Inc.
-
Lithia Motors Inc.
-
Group 1 Automotive Inc.
-
Penske Automotive Group
-
Sonic Automotive Inc.
- *Disclaimer: Major Players sorted in no particular order
Market Opportunities and Future Outlook
Consolidation and portfolio optimization continue to create whitespace for scaled operators to expand premium and high-throughput franchises, particularly where aftersales density and brand mix strengthen service absorption. The in-scope evidence points to a cluster approach: AutoNations June 2026 acquisitions of Toyota of Newnan in Georgia and three premium luxury rooftops in the San Francisco Bay Area (Audi Fremont, Mercedes-Benz of Fremont, Porsche Fremont), and Lithia and Driveways March 2026 acquisitions spanning Toyota and Mercedes-Benz franchises across Tennessee and Oregon. Together, these moves support an opportunity set around building contiguous service and parts coverage, and using that footprint to improve leverage in regional advertising, staffing, and training.
A second opportunity area is operational modernization that turns compliance pressure and customer price transparency into repeatable processes across omnichannel journeys. With FTC advertising scrutiny in 2026, alongside state guidance on fees and disclosures, the value of standardized deal jackets, consent and communication controls, and digital contracting that reduces delivery-cycle friction rises. Dealers that pair these controls with EV-ready service capability, including high-voltage and ADAS tooling, are positioned to capture more warranty work, software-related activations, and recurring service as the in-use parc shifts. At the same time, fleet electrification in medium and heavy vehicles expands demand for depot-oriented maintenance, inspection, and uptime services sold through dealership networks.
Recent Industry Developments
- June 2026: AutoNation, Inc. acquired three premium luxury dealerships in the San Francisco Bay Area (Audi Fremont, Mercedes-Benz of Fremont, Porsche Fremont) effective June 22, 2026. The acquisition consolidates AutoNation's premium-luxury footprint in the San Francisco Bay Area. It strengthens the premium mix and regional service and parts network, with potential uplifts to F&I and aftersales revenue.
- June 2026: AutoNation, Inc. acquired Toyota of Newnan (Georgia) effective June 8, 2026. The move expands geographic reach into Georgia and adds a Toyota franchise. It supports scalable revenue growth in suburban markets and strengthens Toyota portfolio.
- March 2026: Lithia & Driveway acquired Toyota of Gallatin (Tennessee) and Mercedes-Benz of Medford (Oregon), adding approx. USD 225 million in annualized U.S. revenue. The deal adds Toyota and Mercedes-Benz brands to Lithia's mix, boosting regional diversification and revenue base.
Research Methodology Framework and Report Scope
Market Definition and Coverage
This market covers the value generated by automotive dealerships operating in the United States, measured at the dealer level as revenue from retailing vehicles and related dealership services. The coverage includes dealer-level financing facilitation, warranty products, and aftersales work.
Scope exclusions: We exclude manufacturing-level vehicle revenue, pure marketplace classifieds, and standalone repair shops that are not run as part of a dealership operation.
Segmentation Overview
- By Type
- New-Vehicle Sales
- Used-Vehicle Sales
- By Retailer
- Franchised Dealers
- Independent Dealers
- Direct-to-Consumer Digital Retailers
- By Vehicle Type
- Passenger Cars
- Light Trucks and SUVs
- Medium and Heavy Commercial Vehicles
- By Sales Channel
- Brick and Mortar
- Online / Omnichannel
- By Customer Segment
- Individual Consumers
- Fleet and Corporate
- By Region (United States)
- Northeast
- Midwest
- South
- West
Data Sources, Market Sizing, and Validation
Desk Research
Desk research sets the boundaries and gives us clean inputs before modeling begins. We use official datasets and industry references to anchor the demand context, including sources such as the U.S. Census Bureau (NAICS retail trade statistics), Bureau of Labor Statistics employment and wage series, Bureau of Economic Analysis personal consumption trends, Federal Reserve Economic Data (FRED) interest rate and credit indicators, and U.S. Department of Transportation vehicle and travel statistics.
Alongside these, we review public company filings and investor decks from listed dealership groups, association publications, and reputed press coverage to understand pricing patterns, margin pressures, and shifts between new, used, and service work. To fill structural gaps, we selectively rely on paid subscriptions for company financials and intelligence, news and financials, and patent databases when technology shifts affect dealer operations. These desk sources are illustrative only, and we also used other public references during data collection, validation, and research clarification.
Primary Interviews and Surveys
Primary work is used to pressure-test the desk view and convert broad indicators into usable model assumptions. We speak with dealership group executives, used vehicle managers, fixed-ops leaders, finance and insurance specialists, and channel partners, so the final totals reflect how revenue is booked and how quickly pricing and incentives are changing across the United States.
Distribution of primary research fieldwork respondents
| Company type | Respondent position |
|---|---|
| Top tier: 33% | CXOs: 13% |
| Mid tier: 45% | Functional/Unit leaders: 37% |
| Smaller Players: 22% | Managers: 50% |
Market-Sizing & Forecasting
Market sizing is built using a top-down and bottom-up logic, so the final value is explainable and can be replicated with practical inputs. The top-down view reconstructs dealer-level revenue by linking U.S. light-vehicle retail volumes to average transaction values, and then layering typical dealership add-ons such as finance and insurance penetration and service absorption. After that, we check results through selective bottom-up approximations, using sampled dealership financial disclosures, rooftop productivity ranges, and channel checks on typical gross and F&I income per unit, which are then used to adjust totals where a gap shows up.
Inputs that matter most in this market include new versus used unit mix, average retail selling prices, incentives and floorplan interest costs, lease share and credit availability, service and parts ticket sizes, and inventory turn rates that affect throughput. Forecasts are produced using scenario analysis supported by a simple multivariate regression on drivers like rates, unit sales outlook, and pricing normalization. Assumptions are refined after re-contacting experts when dispersion is high. Where bottom-up reads are thin, such as small independent stores, we use ranges tied to establishment counts and typical revenue per location bands instead of forcing false precision.
Data Validation & Update Cycle
Outputs are validated through triangulation across independent signals, then reviewed for anomalies before sign-off. We compare modeled revenue direction against unit sales context, credit conditions, and public dealership operating metrics. If we see a large variance, we run a second pass on definitions, timing, and price assumptions.
Reports are refreshed annually, with interim updates when major events can materially change sales volumes or dealer economics. Before delivery, we check the latest public releases again, and we do targeted follow-ups when new evidence shifts a key input.
Mordor Intelligence's United States Automotive Dealership Market Size Compared Against Other Published Estimates
Published numbers for this market can look far apart, even when they all refer to the United States, because the revenue boundary is not always consistent. Differences usually come from whether an estimate counts only franchised new-car dealers, whether used-only retailers are included, and how service, parts, and finance and insurance income are treated.
The biggest gap drivers are typically scope and accounting treatment. Some sources use NAICS-style industry revenue for new-car dealers only, which can miss used-focused rooftops and related dealership income streams. Other sources may mix consumer vehicle spending with dealer revenue, which inflates totals. Year timing also matters, since transaction prices, incentives, and interest rates move quickly. An older base year or a simple price uplift can overstate growth.
Benchmark comparison
| Source | Market Size | Gaps in Research Methodology |
|---|---|---|
| Mordor Intelligence | USD 2.95 T (2025) | |
| Industry Association A | USD 1.30 T (2025) | Often limited to franchised light-vehicle dealerships and reported dealership sales totals, which can undercount used-only retail and may not fully align with broader dealership revenue pools. |
| Trade Data Publisher B | USD 1.49 T (2026) | Typically mapped to NAICS new-car dealer revenue and then projected with macro indicators, which can miss non-franchised retail activity and can smooth out fast swings in prices, incentives, and finance income. |
In Mordor Intelligence's model, the totals include retail vehicle revenue plus typical dealer-linked income streams like F&I and fixed operations, rather than only NAICS new-car dealer revenue. When the same year and revenue components are aligned, most of the remaining difference is timing, since pricing, incentives, and floorplan costs can shift the value quickly. We keep assumptions traceable to observable indicators and re-check them with interviews before finalizing totals.
Key Questions Answered in the Report
How large is the United States automotive dealership market in 2026?
The United States automotive dealership market size is USD 3.08 trillion in 2026, with a forecast value of USD 3.83 trillion by 2031.
Which segment is growing fastest within dealership sales?
Medium and heavy commercial vehicles are projected to expand at a 4.97% CAGR as fleet electrification gains momentum.
How are online channels affecting dealership profitability?
Online/Omnichannel sales are set to grow at 7.33% annually, forcing dealers to invest in digital tools that maintain gross margins while improving customer convenience.
Which region leads U.S. dealership revenues?
The South holds the largest share at 36.20% and is forecast to grow fastest at 5.78% CAGR through 2031.