
Market Overview
| Study Period | 2020 - 2031 |
|---|---|
| Forecast Data Period | 2026 - 2031 |
| Base Year Market Size (2025) | USD 41.81 Billion |
| Market Size (2026) | USD 46.27 Billion |
| Market Size (2031) | USD 76.84 Billion |
| Growth Rate (2026 - 2031) | 10.68% CAGR |
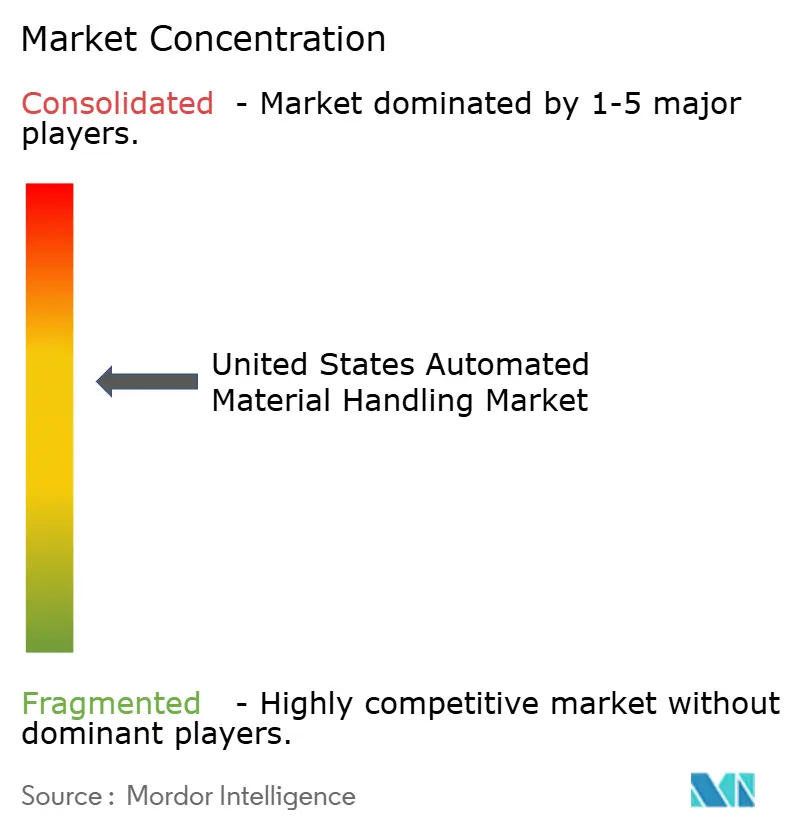
| Market Concentration | Medium |
Major Players *Disclaimer: Major Players sorted in no particular order Image © Mordor Intelligence. Reuse requires attribution under CC BY 4.0. | |
United States Automated Material Handling Market Analysis by Mordor Intelligence
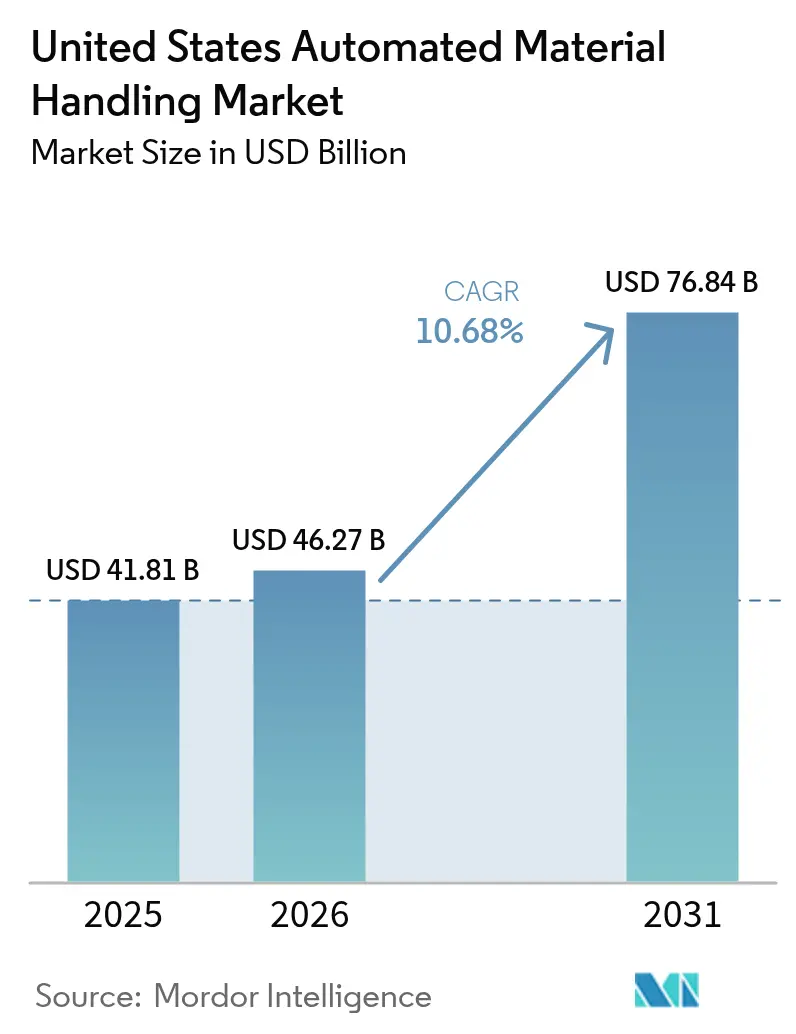
The United States automated material handling market size is expected to grow from USD 41.81 billion in 2025 to USD 46.27 billion in 2026 and is forecast to reach USD 76.84 billion by 2031 at 10.68% CAGR over 2026-2031. Robust capital spending on high-density storage, autonomous mobile robotics, and AI-enabled orchestration platforms anchors this growth as supply-chain operators seek speed, accuracy, and resilience. E-commerce fulfilment now requires near-perfect order precision, while persistent labour constraints make automation a strategic necessity rather than a tactical upgrade. Federal tax incentives, rising industrial rents, and the maturation of 5G private networks further accelerate technology adoption, especially among mid-market manufacturers upgrading legacy facilities. Competitive intensity stays moderate: large incumbents expand via partnerships that bundle hardware, software, and lifecycle services, discouraging point-solution entrants even as venture-backed robotics firms target specialized niches.
Key Report Takeaways
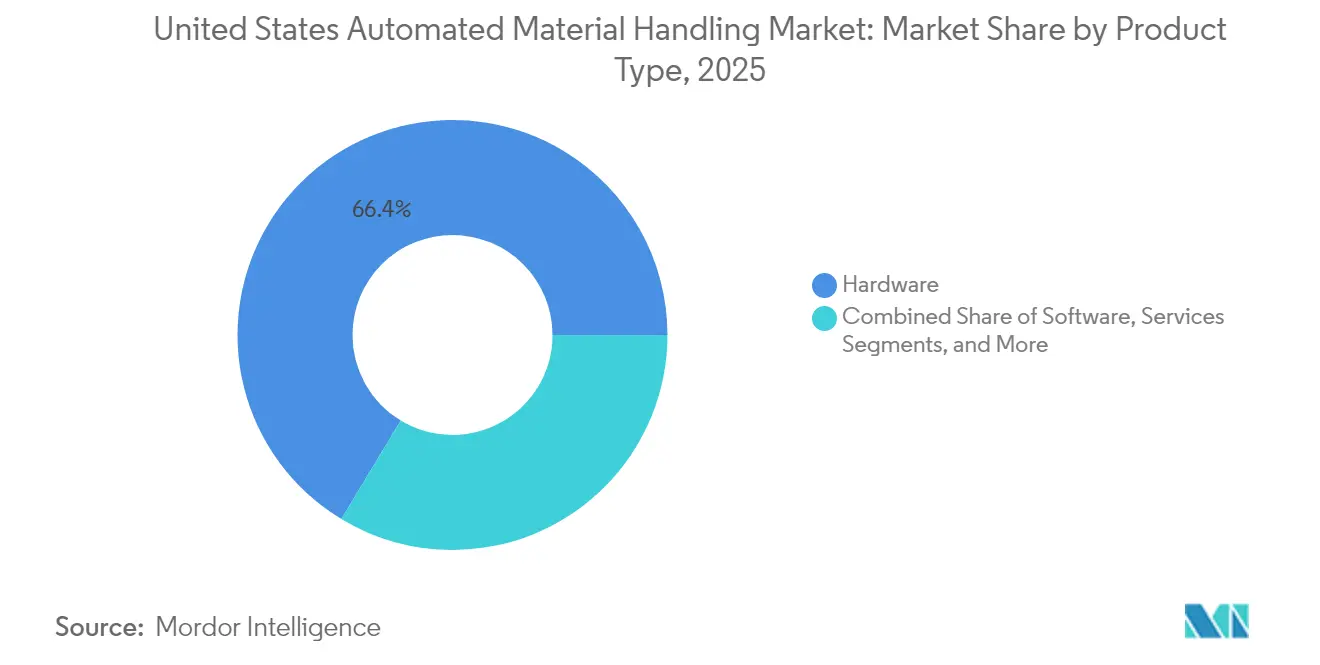
- By product type, hardware led with a 66.35% share of the United States automated material handling market in 2025, whereas software is projected to advance at a 14.74% CAGR through 2031.
- By equipment type, automated storage and retrieval systems accounted for 24.20% of the United States automated material handling market size in 2025, while autonomous mobile robots are tracking a 13.08% CAGR to 2031.
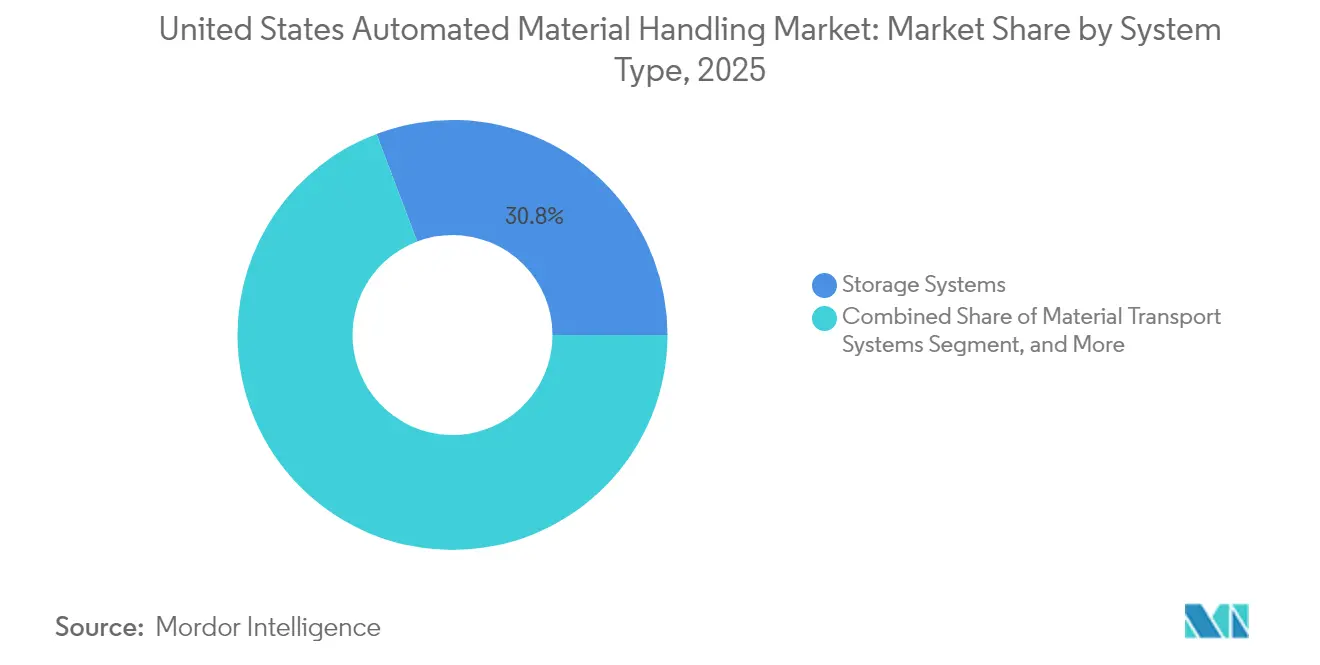
- By system type, storage systems captured 30.75% of the United States automated material handling market share in 2025; material transport systems are forecast to post an 11.38% CAGR to 2031.
- By end-user vertical, retail, warehousing, distribution, and logistic centers held 34.85% of the United States automated material handling market size in 2025, yet pharmaceuticals show the fastest trajectory at a 12.92% CAGR to 2031.
Note: Market size and forecast figures in this report are generated using Mordor Intelligence’s proprietary estimation framework, updated with the latest available data and insights as of 2026.
United States Automated Material Handling Market Trends and Insights
Drivers Impact Analysis*
| Driver | (~) % Impact on CAGR Forecast | Geographic Relevance | Impact Timeline |
|---|---|---|---|
| Increasing Manufacturing Complexity and Technology Availability | +2.10% | National, concentrated in manufacturing hubs | Medium term (2-4 years) |
| Increasing Demand for Improving Order Accuracy and SKU Proliferation | +1.80% | National, strongest in e-commerce corridors | Short term (≤ 2 years) |
| Emergence of Smart City Logistics and Wide Adoption of Robotics in Warehouse Applications | +1.50% | Urban centers and major logistics hubs | Medium term (2-4 years) |
| Tax Incentives Under Section 179 Accelerated Depreciation for Automation Equipment | +1.30% | National | Short term (≤ 2 years) |
| Industrial Real Estate Scarcity Driving Vertical Storage Solutions | +1.00% | Coastal markets and major metropolitan areas | Long term (≥ 4 years) |
| 5G Private Networks Enabling Real-Time Orchestration of AMRs | +0.90% | Early adopters in tech-forward regions | Long term (≥ 4 years) |
| Source: Mordor Intelligence | |||
Increasing Manufacturing Complexity and Technology Availability
Automotive, aerospace, and electronics plants now juggle tens of thousands of active SKUs, making fixed conveyor layouts obsolete. Flexible automation platforms integrate machine-learning algorithms that re-route totes or pallets in real time, trimming picking errors by 40% while preserving throughput. Digital-twin simulations de-risk capital projects, letting engineers model material-flow scenarios before steel meets concrete; facilities that embrace this approach report 25-35% higher line productivity after go-live. Open software architectures encourage rapid reconfiguration when product lifecycles shrink, safeguarding return on investment as customization proliferates. The result is a virtuous cycle: heightened complexity sparks automation demand, while intelligent systems tame that complexity, allowing manufacturers to scale without proportional labour growth. As component prices fall and integrators package turnkey solutions, even mid-sized plants can deploy advanced robotics once reserved for tier-one OEMs.
Increasing Demand for Improving Order Accuracy and SKU Proliferation
Same-day delivery promises drive fulfilment centers toward 99.9% accuracy, a bar unattainable with manual picking at current wage levels. Vision-guided sorters paired with AI quality checks now process up to 15,000 units per hour and deliver 99.95% precision, slashing returns and boosting margin. Labor savings range from 60-70% because robots operate every shift without overtime premiums. Retailers that automate both picking and pack-out note double-digit jumps in Net Promoter Scores as consumers receive the right goods faster. Furthermore, high accuracy curtails chargebacks from marketplace partners, preserving seller reputations and sustaining growth. The financial logic is compelling: payback periods under two years allow CFOs to green-light multi-site rollouts, embedding automation deep into network strategy.
Emergence of Smart City Logistics and Wide Adoption of Robotics in Warehouse Applications
Urban micro-fulfilment nodes squeeze full DC functionality into footprints below 15,000 ft². Compact shuttle systems stack inventory ceiling-high, while fleets of cooperative autonomous mobile robots swarm narrow aisles to raise order throughput by as much as 300% relative to single-robot implementations. Smart-city ordinances focused on emissions reduction catalyse interest in electric AMRs and energy-frugal ASRS, trimming warehouse carbon footprints by up to 40%. Integration with cloud-based warehouse management systems forms a closed loop: operational data, predictive analytics, and robotic control converge to elevate asset utilization. Municipal incentives for low-impact logistics further sweeten the economics, especially in congested metros where last-mile speed is a competitive weapon.
Tax Incentives Under Section 179 Accelerated Depreciation for Automation Equipment
For the 2025 tax year, firms can expense up to USD 2.5 million of qualified automation purchases immediately rather than over multi-year schedules, cutting effective project costs by 21-37% depending on the marginal tax rate. This provision levels the playing field for mid-market manufacturers that historically struggled to justify high upfront spending. Integrators report sales pipelines swelling as finance teams recalculate ROI: payback windows that once spanned 36-48 months compress to 18-24 months. The incentive also sparks a service-economy tailwind, amplifying demand for system design, integration, and employee upskilling. By accelerating capital turnover, Section 179 not only fuels adoption but also refreshes the installed base, keeping domestic facilities technologically current in global competition.
Restraints Impact Analysis*
| Restraint | (~) % Impact on CAGR Forecast | Geographic Relevance | Impact Timeline |
|---|---|---|---|
| Gap in Supply Chain Skills and Workforce Shortage | -1.40% | National, acute in manufacturing regions | Medium term (2-4 years) |
| High Initial Costs | -1.10% | National, particularly affecting SMEs | Short term (≤ 2 years) |
| Fragmented State-Level Safety Standards Slowing Deployments | -0.80% | States with extensive additional requirements | Medium term (2-4 years) |
| Semiconductor Supply Chain Volatility Limiting Sensor Availability | -0.60% | National | Short term (≤ 2 years) |
| Source: Mordor Intelligence | |||
Gap in Supply-Chain Skills and Workforce Shortage
Deloitte estimates 1.9 million U.S. manufacturing jobs could remain unfilled by 2033, with automation technicians among the scarcest roles. Integrators routinely cite commissioning delays of six to twelve months because local talent pools lack PLC programming and robotics troubleshooting capability. Retirements drain institutional knowledge faster than community-college curricula can replenish it, magnifying the shortfall. Employers respond by launching internal academies and partnering with vocational schools, but these efforts take years to bear fruit. Until the pipeline widens, project timelines will extend, constraining the growth potential of the United States automated material handling market.
Semiconductor Supply-Chain Volatility Limiting Sensor Availability
Advanced lidar, time-of-flight, and vision chips remain on allocation as fabs juggle competing orders from automotive and consumer-electronics clients. Lead times for niche industrial sensors lengthened from 12 weeks in 2020 to more than 40 weeks by late 2024. Integrators either pay premiums for brokered stock or redesign systems around available components, each option damaging margins or schedules. Critical functions collision avoidance, AI vision, high-speed sortation cannot revert to lower-grade sensors without sacrificing safety or performance, so many projects simply wait. Although domestic chip investments promise relief, material impacts will take several years to surface.
*Our forecasts treat driver/restraint impacts as directional, not additive. The impact forecasts reflect baseline growth, mix effects, and variable interactions.
Segment Analysis
By Product Type: Software Unlocks Orchestration Advantages
Hardware maintained 66.35% of the United States automated material handling market share in 2025 because cranes, conveyors, and robots remain the backbone of any automated installation. Software, however, is projected to expand at a 14.74% CAGR as cloud platforms, AI engines, and predictive-maintenance modules become indispensable. The United States automated material handling market size captured by software-centric deals is rising as operators seek unified control towers that telescope across multiple sites.
Warehouse management suites now ingest telemetry from every asset, run machine-learning models to optimize routings, and push updates back to robots in seconds. Facilities that integrate business-intelligence dashboards see 15-25% throughput gains by dialling workflow settings daily. Subscription licenses convert capex to opex, aligning costs with seasonality while ensuring continuous feature updates. Services complete the triad: expert audits, 24-7 remote diagnostics, and phased retrofits preserve uptime and stretch asset lives, reinforcing vendor stickiness in the broader United States automated material handling market.


By Equipment Type: AMRs Bring Flexible Mobility
Automated storage and retrieval systems held a 24.20% revenue share in 2025 because space-constrained DCs require cubic maximization and inventory traceability. Yet autonomous mobile robots headline growth with a 13.08% CAGR, redefining intralogistics flow across greenfield and brownfield sites. AMRs navigate without fixed guide paths, slashing reconfiguration cost when product mixes shift an everyday reality in omnichannel commerce.
Pilot fleets typically start small, but API-first architectures let operators scale to hundreds of units without forklift-heavy redesigns. KION’s partnership with Fox Robotics to build autonomous trailer loaders exemplifies a push to automate yard operations, the final frontier in end-to-end flow. Traditional AGVs, laser-guided vehicles, and palletizers remain relevant in heavy or predictable routes, while high-speed sortation maintains a foothold in parcel hubs that prize throughput over flexibility. Overall, the United States automated material handling market continues to favour equipment portfolios that combine fixed precision with mobile agility.
By System Type: Material Transport Gains Momentum
Storage systems captured 30.75% of the United States automated material handling market size in 2025 because vertical cube utilization offsets soaring rents. Material transport systems, recording an 11.38% CAGR, answer the call for dynamic routing as SKU velocity grows unpredictable. AMRs, intelligent tow trains, and modular conveyors integrate with cloud analytics to plan the shortest path in real time, cutting empty travel and energy use.
Hybrid approaches now merge dense storage with mobile shuttles that ferry totes directly to pick stations, blending the efficiencies of ASRS and the flexibility of robots. Packaging and sortation-palletizing lines close the loop, automating end-of-line tasks where ergonomic risks and labour churn run highest. As 5G private networks mature, latency falls below 10 milliseconds, enabling fleet-level optimization at rack speed a competitive edge in the United States automated material handling market.
By End-User Vertical: Pharmaceuticals Accelerate Automation Spend
Retail, warehousing, distribution, and logistic centers represented 34.85% of 2025 revenue because e-commerce giants operate mega-sites requiring lights-out material flow. Pharmaceuticals, however, record a 12.92% CAGR as FDA traceability mandates make serialized, temperature-controlled storage obligatory. Clean-room-rated robots now shuttle vials from fill-finish to cold-pack without human touch, ensuring validation compliance.
Pharma facilities often retrofit legacy warehouses rather than build a new, spurring demand for narrow-aisle shuttles and goods-to-person pick towers. Elsewhere, airports invest in automated baggage handling, food and beverage processors seek hygienic palletizers, and automotive plants adopt AGV-driven kitting for just-in-sequence assembly. Collectively, these sectors contribute recurring demand for tailored solutions, expanding the application universe of the United States automated material handling market.
Geography Analysis
The United States automated material handling market exhibits dense penetration in traditional industrial belts across the Northeast and Midwest, where automotive, aerospace, and heavy machinery firms modernize decades-old plants. Tax incentives and robust supplier networks encourage continuous upgrades, so these regions account for a significant share of integrated ASRS and conveyor installations. Skill availability, although tightening, still exceeds national averages, allowing faster commissioning relative to newer manufacturing states.
Growth velocity is strongest in the Southeast and Southwest. Lower labour costs, ample land, and right-to-work statutes lure greenfield factories and mega-distribution campuses. New facilities specify automation at blueprint stage, leapfrogging legacy conveyor-only layouts toward AMR fleets orchestrated by cloud software. State economic-development agencies augment Section 179 benefits with grants and property-tax abatements, compressing ROI periods and stimulating supplier expansion corridors from Texas to Georgia.
The West Coast remains the nation’s testbed for cutting-edge solutions. Technology firms experiment with AI digital-twin control towers, while port-adjacent logistics operators deploy collaborative robots to break container bottlenecks. Stringent California safety codes add cost and time but also drive demand for advanced safeguarding features like lidar-based zone enforcement. Although regulatory fragmentation lengthens project timelines, it pushes innovation boundaries and, once validated, diffuses eastward, elevating capability standards across the United States automated material handling market.
Regulatory Landscape
In the United States, automated material handling deployments generally fall under OSHA workplace safety requirements rather than a robotics-specific federal rulebook. OSHA applies established standards such as 29 CFR 1910.178 (powered industrial trucks) and provides guidance in the OSHA Technical Manual (OTM) Section IV, Chapter 4 for industrial robot systems and safeguarding practices, shaping system design, commissioning checklists, and operator training across warehouses and manufacturing plants.
For robot system integration, many projects align engineering controls, risk assessment, and validation documentation with the consensus standard ANSI/RIA R15.06-2012 (the US national adoption of ISO 10218-1/10218-2). In parallel, the US Department of Labor has published non-binding guidance on Artificial Intelligence and Worker Well-being for developers and employers, and in March 2026 OSHA launched the Safety Champions Program as part of the DOL FY 2026-2030 Strategic Plan, reinforcing emphasis on structured safety and health programs, compliance assistance, and self-audit behavior during automation rollouts.
Competitive Landscape
Competition is moderately consolidated: the top tier KION Group, DAIFUKU, Honeywell Intelligrated, and Toyota-owned Bastian Solutions bundle hardware, software, and multiyear services to create sticky ecosystems. Their combined approach discourages piecemeal sourcing and ensures stable annuity revenues. KION’s alliance with NVIDIA and Accenture injects AI into planning, while Fox Robotics manufacturing deals extend reach into trailer-loading niches, demonstrating a strategy of complementary partnerships over outright acquisitions.
Challengers concentrate on robotics-as-a-service and software-defined material flow. Locus Robotics and 6 River Systems sell subscription fleets that lower capex barriers, appealing to 3PLs in seasonal markets. However, scalability favours incumbents that own global service networks able to guarantee parts availability and 24-7 field support. Financing arms within conglomerates sweeten bids with deferred-payment structures tailored to Section 179 eligibility, locking in multi-site contracts.
White-space opportunities persist in cold-chain pharmaceuticals and micro-fulfilment centers where regulatory nuance and space constraints demand specialized engineering. Smaller specialists succeed when they partner with integrators serving national retailers, feeding innovation back to large OEMs that may eventually acquire proven technologies. Overall, brand trust, service reach, and AI-driven ROI metrics define buying decisions in the United States automated material handling market.
United States Automated Material Handling Industry Leaders
Kion Group AG
Bastian Solutions Inc.
DMW&H
Westfalia Technologies Inc.
Dorner Manufacturing Corporation
- *Disclaimer: Major Players sorted in no particular order

Market Opportunities and Future Outlook
A key shift is moving automation budgets from discrete equipment upgrades toward software-led orchestration and risk-managed operations that connect AMRs, AS/RS, conveyors, and sortation into a single execution layer. The 2026 MHI Annual Industry Report (with Deloitte) elevated AI as the most disruptive supply chain technology, with 24% of surveyed leaders calling it transformational and 48% citing significant impact, while robotics and automation also increased in perceived disruption (39% rating significant or greater, up 16 percentage points versus 2025). This creates opportunities for vendors that package controls, fleet management, and analytics into deployable modules that support measurable accuracy and throughput improvements without requiring a full facility rebuild.
Another opportunity is aligning automated material handling investments with government and standards-driven resilience programs focused on visibility and data integration across the domestic supply chain. The US Department of Commerce Supply Chain Center uses tools such as the SCALE risk assessment framework (built on 40+ indicators) to assess vulnerabilities, and NIST has published work on digital thread roadmaps for integrating data across manufacturing products and processes. These efforts open space for automation providers and integrators that can instrument material flow, standardize event data from equipment, and connect shop-floor and warehouse execution systems into auditable, interoperable digital records that support resilience, compliance workflows, and multi-site optimization.
Recent Industry Developments
- July 2026: KION Group and Colruyt Group launched a new R&D center focused on next-generation supply chain robotics. The collaboration strengthens robotics development pipelines and can accelerate the transfer of advanced picking and handling concepts into scalable warehouse automation portfolios.
- April 2026: Toyota Automated Logistics was launched as a combined brand bringing together Bastian Solutions, Vanderlande warehousing activities, and viastore. The consolidation simplifies go-to-market for integrated automation projects spanning AS/RS, sortation, software, and lifecycle services under a single umbrella.
- May 2024: KION North America and Fox Robotics announced a non-exclusive strategic partnership to manufacture and assemble FoxBot autonomous trailer loader and unloader systems at KION's Summerville, South Carolina facility. Local assembly supports faster deployment and serviceability for trailer-loading automation, extending AMH adoption into yard and dock operations beyond traditional in-warehouse flows.


Research Methodology Framework and Report Scope
Market Definition and Coverage
This market covers revenue generated in the United States from automated systems and equipment used to move, store, sort, and control materials inside facilities such as warehouses, distribution centers, and factories.
Scope exclusions: We exclude manual handling equipment and facility construction work that is not sold as part of an automated handling system.
Segmentation Overview
- By Equipment Type
- Forklifts
- Automated Guided Vehicles (AGVs)
- Conveyor Systems
- Storage and Retrieval Systems
- Cranes and Hoists
- By End-User Industry
- E-commerce and 3PL
- Food and Beverage
- Manufacturing
- Retail (non-e-commerce)
- Pharmaceuticals
- By Capacity Range
- Below 5,000 lbs
- 5,000 - 10,000 lbs
- 10,001 - 20,000 lbs
- Above 20,000 lbs
- By Financing Type
- Operating Lease
- Capital Lease
- Loan / Hire-Purchase
- Sale and Lease-Back
Data Sources, Market Sizing, and Validation
Desk Research
Desk work starts by grounding the demand context and the investment cycle behind warehouse automation. We rely on public sources such as the US Census Bureau for economic and manufacturing data, the Bureau of Labor Statistics for wage and productivity series, the US International Trade Commission for trade statistics, and Federal Reserve industrial production indicators to set the macro envelope.
To keep the assumptions tied to how facilities operate, we also review materials from trade bodies and open publications, such as logistics and warehousing associations, academic journals on intralogistics and robotics, and public safety and standards guidance relevant to industrial automation. Company filings, earnings decks, and press releases are used to capture order commentary, backlog signals, and product mix changes, and then selected paid subscriptions are used for company financials, patent lookups, and shipment-level import and export checks where helpful. These sources are illustrative, and many other references were used during data collection and cross-checking.
Primary Interviews and Surveys
Primary discussions are used to sanity-check adoption rates, average selling price movement, and project timelines across key buyers such as e-commerce fulfillment operators, 3PLs, and manufacturers. We also speak with system integrators, component suppliers, and service teams so gaps from public data are reduced, and the assumptions are filtered through what is actually being installed across US sites.
Distribution of primary research fieldwork respondents
| Company type | Respondent position | Region |
|---|---|---|
| Top tier: 34% | CXOs: 14% | |
| Mid tier: 52% | Functional/Unit leaders: 33% | |
| Smaller Players: 14% | Managers: 53% |
Market-Sizing & Forecasting
Sizing is built using a top-down approach where US warehouse and manufacturing activity, automation penetration, and typical system spend are combined to reconstruct the annual demand pool. The model is then corroborated with selective bottom-up approximations, such as sampled project values from integrator pipelines, installed-base replacement cycles, and checks using ASP times shipment and deployment volumes, which are then used to tune the totals.
Inputs that matter in this market include warehouse new-build and expansion activity, labor availability and wage inflation, e-commerce parcel volumes and throughput needs, average system price by equipment mix (for example conveyors versus mobile robots), and lead times that shift revenue recognition across years. When a bottom-up view is incomplete for a niche system type, we bridge the gap using adoption ratios and share-of-spend patterns validated in interviews so the total stays consistent.
Forecasts are produced through scenario analysis anchored to facility investment cycles, labor-cost sensitivity, and expected automation adoption, and the scenarios are adjusted using what interviewees describe for budget approvals and commissioning timelines over the next 12 to 24 months.
Data Validation & Update Cycle
Outputs are checked against independent signals, including trade flows for key equipment categories, public revenue trends from major participants, and logistics capex commentary, before the numbers are finalized. If a large variance shows up, the assumptions are revisited, and targeted follow-ups are triggered to confirm what changed and whether timing effects are involved.
A multi-step internal review is followed so the final model logic and inputs remain consistent across years, and outliers are explained rather than averaged away. The report is refreshed annually, and interim updates are made when a material event affects demand, pricing, or installation schedules, followed by a final pre-delivery review so clients receive the latest view.
Mordor Intelligence's United States Automated Material Handling Market Estimate Compared With Other Published Estimates
It is normal to see different market sizes for US automated material handling because publishers do not always count the same equipment set, revenue point, or service layer. The year chosen for the starting value also matters, since large warehouse projects can shift revenue between adjacent years.
Key gaps usually come from scope edges and pricing logic. Some estimates focus mainly on equipment shipments and leave out software, integration, and after-sales services, while others count only a limited group of systems such as conveyors and AGVs. By checking equipment-type boundaries, software and services attach rates, and annual currency timing, Mordor Intelligence keeps the market total aligned to what buyers procure for full automation projects across US facilities.
Benchmark comparison
| Source | Market Size | Gaps in Research Methodology |
|---|---|---|
| Mordor Intelligence | USD 41.81 B (2025) | |
| Industry Research Publisher A | USD 12.50 B (2024) | This estimate appears to cover a narrower equipment-only set and uses an earlier base year, which can exclude system integration, software layers, and service revenue tied to larger automation projects. |
| Global Research Publisher B | USD 13.15 B (2025) | The scope is framed as automated material handling equipment revenue and may not consistently include installation, integration, and recurring software and services, which tends to lower the captured project value. |
Across the table, the spread is mainly explained by what is counted as a complete automation system sale versus standalone equipment revenue, and by the handling of software and service attachments. Our process stays traceable because the assumptions are tied to observable facility activity, validated project economics, and repeatable checks on pricing and adoption.


Key Questions Answered in the Report
What is the projected 2031 value of United States material handling leasing and financing?
The market is forecast to reach USD 3.65 billion by 2031, reflecting a 15.48% CAGR over 2026-2031.
Which equipment category is growing fastest in U.S. warehouse financing?
Automated guided vehicles lead with a 16.05% CAGR forecast through 2031 as firms accelerate automation.
How do Section 179 deductions influence equipment leasing decisions?
Lessees can expense up to USD 1.22 million immediately, making operating leases the preferred structure for fast-turnover fleets.
Why are sale-and-leaseback deals becoming popular among warehouse operators?
They unlock trapped equity from existing fleets, funding automation upgrades without increasing balance-sheet debt, and are projected to grow at 16.98% CAGR.
Which regions are hotspots for new leasing activity?
Californias Inland Empire, Texas distribution corridors, and the Southeast logistics belt exhibit the highest growth due to port modernization and e-commerce fulfillment expansion.
Page last updated on:






