
Market Overview
| Study Period | 2020 - 2031 |
|---|---|
| Forecast Data Period | 2026 - 2031 |
| Base Year Market Size (2025) | USD 4.18 Billion |
| Market Size (2026) | USD 4.56 Billion |
| Market Size (2031) | USD 7.03 Billion |
| Growth Rate (2026 - 2031) | 9.05 % |
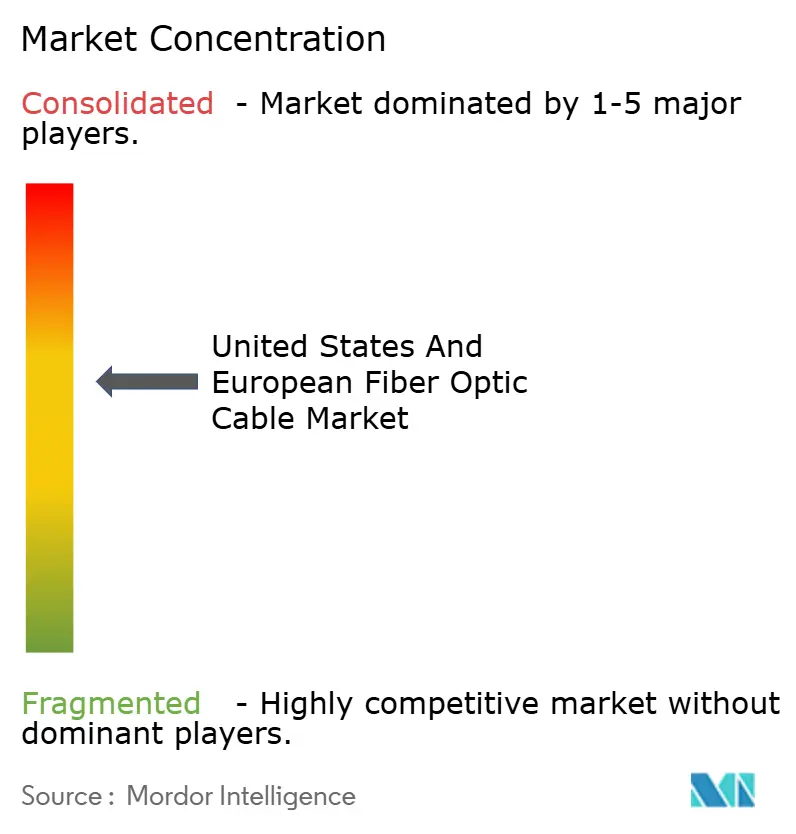
| Market Concentration | Medium |
Major Players *Disclaimer: Major Players sorted in no particular order Image © Mordor Intelligence. Reuse requires attribution under CC BY 4.0. | |
United States And European Fiber Optic Cable Market Analysis by Mordor Intelligence
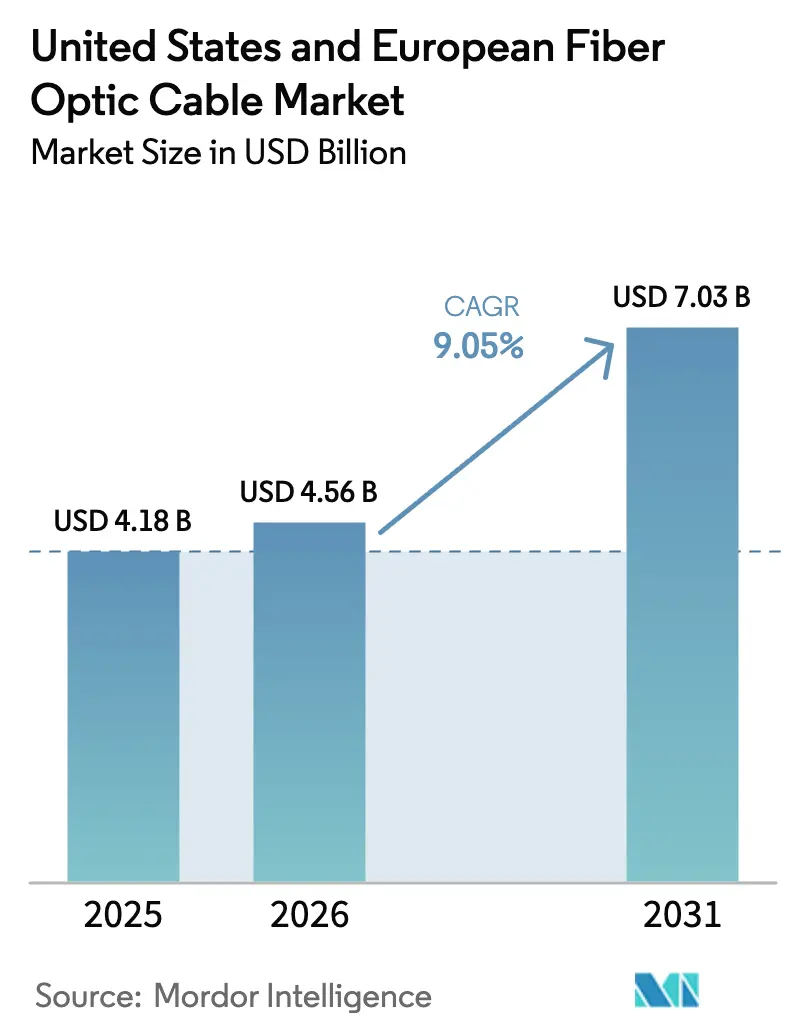
The United States and European Fiber Optic Cable Market size in 2026 is estimated at USD 4.56 billion, growing from 2025 value of USD 4.18 billion with 2031 projections showing USD 7.03 billion, growing at 9.05% CAGR over 2026-2031. Accelerated 5G densification, government broadband stimulus, and AI-centric hyperscale data centers are synchronizing spending cycles, driving long-haul, metro, and in-building deployments. Stimulus packages such as the USD 42.45 billion BEAD program and the European Union’s Digital Decade plan deliver clear long-term demand visibility, while neutral-host and utility dark-fiber models unlock incremental opportunities for manufacturers able to supply specialty assemblies. Submarine investments by hyperscalers, including Meta’s Project Waterworth, are catalyzing technical shifts toward ultra-low-loss G.654.E fibers, and a persistent shortage of skilled splice technicians is tightening project timelines but sustaining pricing power for integrators with turnkey field services.
Key Report Takeaways
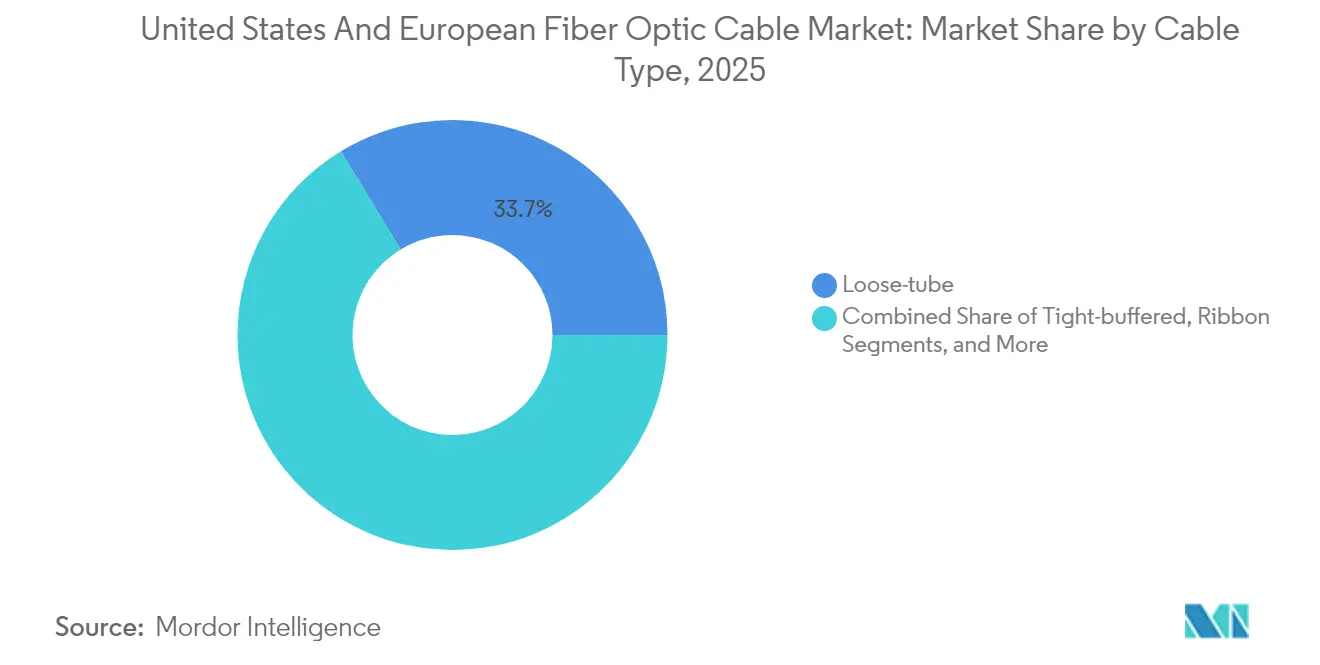
- By cable type, loose-tube products captured 33.68% revenue share of the fiber optic cable market in 2025; tight-buffered variants are forecast to advance at a 9.54% CAGR through 2031.
- By mode, single-mode solutions held 60.92% of the fiber optic cable market share in 2025, whereas multi-mode offerings posted the highest projected CAGR of 9.41% during 2026-2031.
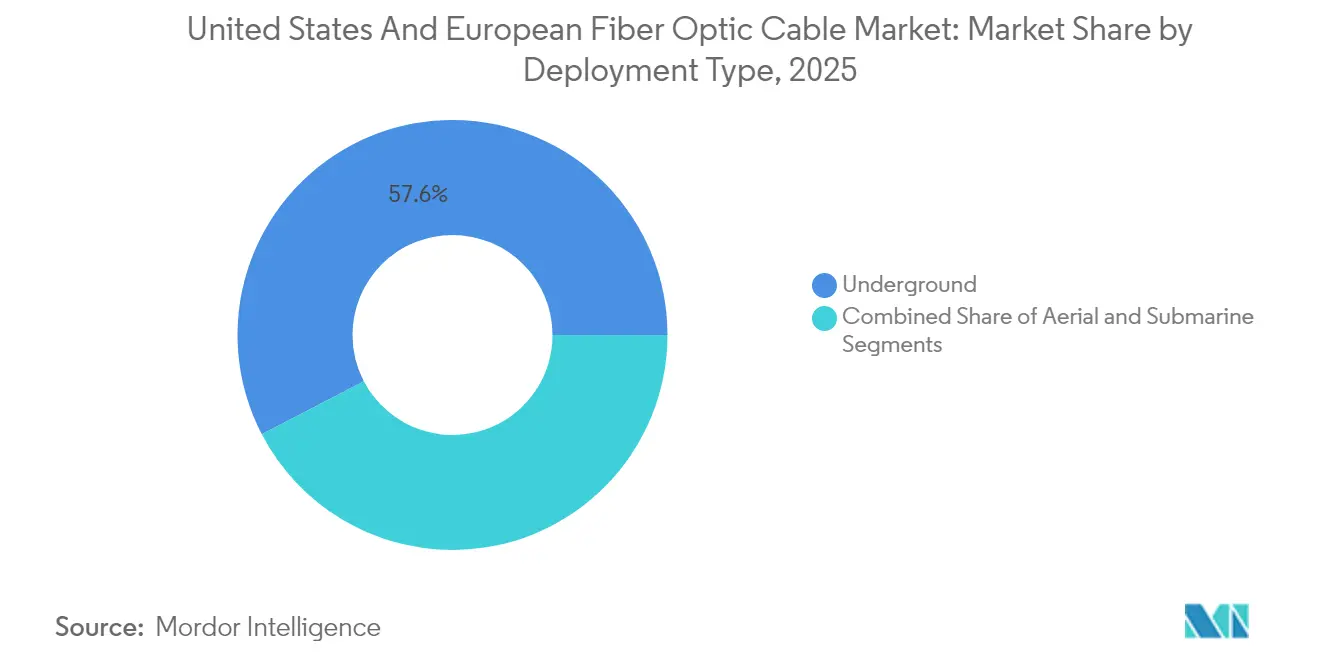
- By deployment type, underground installations accounted for 57.64% of the fiber optic cable market size in 2025; submarine systems are positioned to grow at a 9.78% CAGR through 2031.
- By end-user industry, telecommunications dominated with a 65.71% share in 2025, and it is expanding at a 9.95% CAGR outlook through 2031.
- By country, the United States led with 38.12% of the total 2025 value and is forecast to expand at a 10.46% CAGR to 2031.
Note: Market size and forecast figures in this report are generated using Mordor Intelligence’s proprietary estimation framework, updated with the latest available data and insights as of 2026.
Market Trends and Insights
Drivers Impact Analysis of United States And European Fiber Optic Cable Market*
| Driver | (~) % Impact on CAGR Forecast | Geographic Relevance | Impact Timeline |
|---|---|---|---|
| Surging data traffic and cloud workloads | +2.1% | North American and EU hyperscale clusters | Medium term (2-4 years) |
| Accelerated FTTH and 5G rollout investments | +1.8% | EU39 nations, US rural corridors | Medium term (2-4 years) |
| Government broadband stimulus (US BEAD/EU Digital Decade) | +1.5% | United States, Germany, France, Italy, Spain | Short term (≤ 2 years) |
| Adoption of ultra-low-loss single-mode fibers | +1.2% | Global subsea and long-haul routes | Long term (≥ 4 years) |
| Open-RAN neutral-host densification needs dark fiber | +0.9% | Dense urban areas in US and EU | Medium term (2-4 years) |
| Utility-owned fiber commercialization for grid modernization | +0.8% | North America, Northern Europe | Long term (≥ 4 years) |
| Source: Mordor Intelligence | |||
Surging Data Traffic and Cloud Workloads
Hyperscale data centers dedicated to AI training clusters are consuming high-density ribbon assemblies at an unprecedented pace, reflecting east-west traffic patterns that copper links cannot support. Meta’s Project Waterworth and Amazon’s Ireland-US cable exemplify multibillion-dollar commitments to private backbone infrastructure that prioritize 400 G and 800 G optical lanes. Connector lead times exceed 16 weeks for MPO/MTP formats, illustrating a tightening supply environment that strengthens the hand of vertically integrated suppliers [1]. Ultra-low-loss G.654.E fibers are gaining traction because they reduce regeneration sites across ocean spans, thereby decreasing the total cost of ownership for cloud operators. As a result, manufacturers capable of delivering specialty tight-buffered and ribbon designs optimized for AI workloads secure premium pricing while broadening recurring services revenue from on-premise moves, adds, and changes.
Accelerated FTTH and 5G Rollout Investments
EU39 fiber coverage rose to 74.6% by September 2024, with Germany adding 3.8 million premises and the United Kingdom passing 4.2 million during that period. Competitive overbuilds by Delta Fibre, Open Dutch Fibre, and KPN’s Glaspoort drove the Netherlands to an 88% household coverage milestone. In parallel, millimeter-wave 5G densification depends on dark-fiber backhaul to small-cell clusters, prompting mobile network operators to co-deploy FTTH and 5G assets to amortize trenching costs. Infrastructure sharing and neutral-host tower models lower barriers for alternative operators, while multitenant data centers leverage the same conduit systems to integrate meet-me rooms. This convergence accelerates order pipelines for cable makers that maintain modular product portfolios adaptable to both aerial and underground pathways.
Government Broadband Stimulus Programs
The USD 42.45 billion BEAD initiative prioritizes fiber-first build plans, effectively sidelining fixed-wireless proxies in federally funded US rural deployments. Parallel Digital Decade policies mandate universal gigabit access across the European Union by 2030, complemented by Germany’s EUR 1.2 billion Gigabitförderung 2.0 grants and France’s successive national rollouts. Build America Buy America content provisions protect domestic cable plants, granting incumbents such as Prysmian’s North American factories preferred supplier status. State broadband offices’ milestone-based disbursement schedules improve cash-flow predictability, allowing cable producers to optimize furnace utilization rates and negotiate longer quartz supply contracts. Collectively, these programs underpin a predictable multi-year revenue runway for US and European manufacturers with compliant product credentials.
Adoption of Ultra-Low-Loss Single-Mode Fibers
G.654.E designs deliver attenuation below 0.16 dB/km, extending repeater spacing to 100 km on subsea routes while supporting 100G/λ coherent modulation [2]. As Meta, Google, and AWS pursue private transatlantic links, ultra-low-loss specifications become baseline requirements, prompting suppliers to invest in advanced vapor-deposition preform lines. Similar upgrades spill into terrestrial long-haul builds where Tier-1 carriers aim to slash amplifier expenditures. Early adopters command a pricing premium supported by quantifiable capex savings at the network-owner level. The technical barrier narrows the vendor field to a handful of players with proprietary doping profiles and tight furnace-temperature control, reinforcing existing market concentration.
Restraints Impact Analysis of United States And European Fiber Optic Cable Market*
| Restraint | (~) % Impact on CAGR Forecast | Geographic Relevance | Impact Timeline |
|---|---|---|---|
| High civil-works and right-of-way costs | -1.4% | Dense urban cores in US and Western Europe | Short term (≤ 2 years) |
| Competition from fixed-wireless and satellite | -0.8% | Rural spots, low-density districts | Medium term (2-4 years) |
| Skilled labor shortage for splicing | -0.6% | Global, acute in North America | Medium term (2-4 years) |
| Volatility in glass-preform supply chain | -0.5% | China, Japan, US manufacturing hubs | Short term (≤ 2 years) |
| Source: Mordor Intelligence | |||
High Civil-Works and Right-of-Way Costs
Underground construction reached USD 18.25 per foot in 2024, a 12% leap attributed to labor inflation and lengthy permitting cycles in dense metros [3]. Civil works represent up to 80% of project budgets, compelling operators to pursue micro-trenches and conduit reuse strategies. Aerial placement, priced at USD 6.55 per foot, remains attractive but faces European mandates for burial to preserve streetscapes. These dynamics tilt the playing field toward incumbents holding legacy pole-attachment rights and pre-existing ducts, deterring greenfield overbuilds and moderating competitive intensity in mature ZIP codes.
Competition from Fixed-Wireless and Satellite Broadband
Starlink surpassed 4 million subscribers by 2025, validating low-Earth-orbit broadband for low-density locales where fiber penetration is economically prohibitive. Concurrently, 5G fixed wireless delivers gigabit throughput in suburban clusters using existing macro tower footprints, compressing payback periods compared with trench-based FTTH. While latency and capacity ceilings persist for satellite and wireless modalities, they still siphon off the most price-sensitive residential subscribers, lowering penetration projections for select rural fiber projects. Cable manufacturers mitigate risk by targeting enterprise, wholesale, and dark-fiber leases where fiber’s deterministic performance remains irreplaceable.
*Our forecasts treat driver/restraint impacts as directional, not additive. The impact forecasts reflect baseline growth, mix effects, and variable interactions.
United States And European Fiber Optic Cable Market Segment Analysis
By Cable Type:
Tight-Buffered Lines Up Indoor UpsideLoose-tube designs maintained a 33.68% revenue lead within the fiber optic cable market in 2025, owing to moisture-blocked constructions ideal for outdoor ducts and aerial spans. This segment capitalizes on government-funded rural builds, where extended temperature swings demand gel-filled or dry-core loose-tube formats for long-term reliability. Demand ties closely to statewide broadband grants that prioritize buried networks over wireless substitutes, enabling predictable furnace loading at domestic facilities owned by incumbents.
Hyperscale and colocation operators, however, are accelerating procurement of tight-buffered assemblies that demonstrate a 9.54% CAGR to 2031, reflecting growing intra-data-hall deployments where bend-insensitive jacketing and 900-µm coatings reduce installation time. Port counts per rack have tripled in AI clusters, and ribbonized tight buffers ease mass-fusion splicing to pre-terminated MPO trunks, attracting price premiums amid ongoing connector shortages. As GPU expansion favors multi-tenant buildings located near renewable energy, the cable mix skews toward flame-retardant plenum ratings, prompting vendors to retool jacketing lines for lower-toxicity compounds.

By Mode:
Multi-Mode Reclaims Short-Reach RelevanceSingle-mode solutions controlled 60.92% of 2025 revenue, given their long-haul reach and future-proof bandwidth for FTTH, metro, and subsea backbones. Government subsidies cement single-mode dominance for access loops where 1 Gbps services are baseline. Operators deploy standard G.652.D or bend-tolerant G.657.A2 cores to extend the life cycles of new plant investments.
Multi-mode fiber volumes are set for a 9.41% CAGR through 2031 as OM4/OM5 variants support 400G SR8 and 800G SR4 lanes inside hyperscale leaf-spine fabrics. Parallel-optic architectures limit reach to 150 m but slash transceiver costs, reclaiming share in data halls. Vendors respond with graded-index profiles optimized for 850 nm VCSEL sources that improve modal dispersion, tightening spec tolerances. The trend lifts overall volume for short-reach jumpers, enhancing factory utilization rates between long-haul campaign runs and helping buffer revenue cyclicality inherent in carrier capex cycles.
By Deployment Type:
Subsea Systems Lift Growth PremiumUnderground construction held 57.64% of 2025 spending because most EU jurisdictions mandate buried new builds for safety and aesthetics. Municipal dig-once rules and conduit-sharing policies reduce incremental costs, yet labor shortages push project timelines beyond statutory disbursement milestones in select German Länder, incentivizing micro-trenching and HDD techniques. Service providers focus on duct standardization to streamline fiber-sensing upgrades for grid and traffic management in future smart-city pilots.
Submarine builds post the fastest 9.78% CAGR through 2031, propelled by hyperscale content providers bypassing carrier consortium models. Meta’s Project Waterworth and Google’s Nuvem adopt 24-fiber pairs with space-division multiplexing that drive composite pull tensions above legacy limits, demanding new steel-wire armoring compositions. Cable yards in the United States and France accelerate G.654.E qualification to meet post-quantum encryption overhead, while European bankers expand green-bond frameworks covering subsea sustainability metrics, thus diversifying funding sources for future Atlantic and Nordic routes.
By End-User Industry:
Telcos Remain Anchor TenantTelecommunications accounted for 65.71% of 2025 revenue and is projected to post a 9.95% CAGR, underwritten by dual-track FTTH and 5G backhaul plans targeting symmetrical gigabit experiences. Subsidies lower hurdle rates, allowing regional ISPs to pre-order multi-year fiber volumes that stabilize factory lines and justify quartz furnace expansions. Incumbent telcos also upgrade inter-central-office rings to 800G ZR+ pluggable optics, stimulating demand for ultra-low-loss trunks already qualified for subsea use, thereby spreading R&D amortization across segments.
Utilities, defense agencies, manufacturers, and medical OEMs diversify the customer base, capturing incremental volumes in high-margin specialty niches. Grid-modernization grants let electric companies commercialize surplus fibers along transmission corridors, creating new dark-fiber revenues and sparking orders for armored OPGW cables. Defense ministries specify hermetically sealed tactical reels resistant to electromagnetic pulses, while minimally invasive surgical devices integrate biocompatible silica strands for real-time imaging. These pockets cushion cyclical swings in carrier capex and support sustained R&D around coating chemistries and geometry tolerances.
Geography Analysis
United States and European Fiber Optic Cable Market
The United States commanded a 38.12% share of 2025 spending with a 10.46% CAGR outlook, reflecting the fiber-first orientation of the BEAD program and the Build America Buy America preference for domestic sources. Hyperscale clusters in Virginia, Oregon, and Texas trigger continuous pull orders for pre-terminated trunks, while Midwestern rural electrification cooperatives leverage USDA loans to wire underserved counties. Domestic manufacturers benefit from stable quartz sourcing contracts and an on-shored preform ecosystem that insulates them from Asian export controls on high-purity silica.
Broader European Markets
Germany is Europe’s largest single market, fueled by EUR 1.2 billion Gigabitförderung 2.0 grants that shorten payback periods for altnets expanding into second-tier cities. The United Kingdom trails closely, adding 4.2 million premises in 2024 amid aggressive competition between CityFibre, Openreach, and Virgin Media O2, which accelerates duct leasing opportunities for dark-fiber specialists. France, Italy, and Spain deliver steady contributions via national broadband strategies aligned with the EU connectivity toolbox that streamlines permitting and mandate conduit sharing.
Northern and Central Europe and European Fiber Optic Cable Market
Smaller European economies, the Netherlands, Austria, Switzerland, and Nordic states, show above-average penetration owing to high GDP per capita and municipal ownership models that reinvest returns into incremental rural runs. The Netherlands’ 88% household coverage milestone raises marginal deployment costs as operators tackle complex brownfield builds in historic city centers. Nordic utilities exploit long rights-of-way along power corridors for bundled OPGW, while Swiss carriers harness existing rail rights-of-way to lower civil-works costs. Collectively, these geographies maintain robust demand for specialty outdoor ribbons, snow-shedding jacketing, and low-temperature bend-insensitive cores.
Regulatory Landscape
In the United States, federal broadband priorities and national security requirements shape how fiber optic cable is specified and documented for subsea and terrestrial projects. The USD 42.45 billion BEAD program reinforces fiber-first architectures, and Build America Buy America content preferences support domestic cable and connectivity manufacturing for federally funded builds. For submarine systems, the FCC adopted a Second Report and Order on June 30, 2026, updating licensing and national security-related requirements and increasing process and documentation rigor for new long-haul and transoceanic cable projects, including those using ultra-low-loss fiber designs.
Across Europe, policy focuses on accelerating gigabit coverage while reducing deployment friction. The EU Gigabit Infrastructure Act entered into force on May 11, 2024, with key provisions applying primarily from November 12, 2025, standardizing access to in-building infrastructure and coordination mechanisms that affect last-mile and metro build economics. Separately, the European Commission introduced the Digital Networks Act proposal on January 21, 2026, aimed at streamlining telecom regulation across member states and reinforcing next-generation network investment frameworks, which intersects with national grant programs such as Germany's Gigabitfoerderung 2.0 and sustains underground and in-building fiber demand.
Value Chain Analysis
The fiber optic cable value chain in the United States and Europe runs from (1) upstream materials and fiber manufacture (high-purity silica, dopants, preforms, and fiber draw), to (2) midstream cabling and assembly (loose-tube, ribbon, tight-buffered, armored, and specialty constructions, including factory pre-termination), and then to (3) downstream deployment and consumption (FTTH contractors, mobile backhaul integrators, hyperscale and colocation data centers, utilities, and subsea system suppliers). Supply tightness in high-density data center assemblies and components raises the value of short lead times for connectors and pre-terminated trunks, while subsea adoption of G.654.E shifts more value to specialty fiber qualification, testing, and repeatable process control.
Vertical integration and long-term offtake agreements are increasingly used to protect upstream-to-downstream continuity and reduce capacity planning risk. Corning has disclosed steps to expand U.S. optical connectivity manufacturing and fiber production capacity tied to AI infrastructure demand, while Prysmian has highlighted multiyear investments and partner agreements spanning fiber capacity and data center optical cable supply. On the demand side, government-funded rural builds in the United States and coordinated EU connectivity programs raise compliance, documentation, and sourcing discipline, favoring suppliers with regional manufacturing footprints, certified product portfolios, and turnkey field support that helps manage skilled-splicing constraints.
Competitive Landscape
Prysmian Group’s USD 950 million purchase of Encore Wire expands its North American installation accessories and copper cable footprint, positioning the firm to bundle electrical wire with fiber bundles in BEAD-funded projects. Nokia’s 2025 acquisition of Infinera forms a USD 2.4 billion optical entity with combined coherent transceiver and subsea repeater assets, enabling bundled bids on turnkey submarine and terrestrial long-haul contracts. Belden, CommScope, and Corning deepen vertical integration across jacketing compounds, fiber draw towers, and factory-terminated assemblies, raising entry barriers for niche rivals.
Technology differentiation now centers on producing ultra-low-loss G.654.E cores and MPO-16/24 high-density connectors validated to IEC 61754-7 specs. Proprietary vapor-axial deposition furnaces guard intellectual property and demand capital intensity, reinforcing moderate market concentration. Supply-side risks linger around helium shortages for draw towers and fluctuating germanium prices used as dopants, but integrated players mitigate exposure through multi-year supply agreements. Skilled-labor shortages in field splicing intensify demand for plug-and-play modules, favoring companies with factory pre-termination capabilities and nationwide technician networks.
White-space growth appears in medical, defense, and power-utility niches where stringent certifications (ISO 13485, MIL-DTL-38999, IEEE Std 1596) permit premium pricing. AFL and Clearfield target these segments with hermetic coatings and hardened terminals, capturing value beyond commodity long-haul strands. Meanwhile, European players partner with local construction firms to ensure Build-and-Transfer contract compliance, bundling warranty services that lock in annuity-like maintenance fees.
United States And European Fiber Optic Cable Industry Leaders
-
Prysmian Group
-
Corning Inc.
-
Nexans SA
-
CommScope Holding Company Inc.
-
Furukawa Electric Co., Ltd.
- *Disclaimer: Major Players sorted in no particular order
United States And European Fiber Optic Cable Market Companies Covered in this Report
- Prysmian Group
- Corning Inc.
- Nexans SA
- CommScope Holding Company Inc.
- Furukawa Electric Co., Ltd.
- Sumitomo Electric Industries Ltd.
- Sterlite Technologies Limited
- Fujikura Ltd.
- Leoni AG
- Belden Inc.
- LS Cable and System
- HUBER+SUHNER AG
- Hexatronic Group AB
- AFL (Fujikura)
- Optical Cable Corp.
- Coherent Corp. (Finisar Corporation)
- ZTT Group
- Molex LLC
Market Opportunities and Future Outlook
Hyperscale AI data centers are creating whitespace for high-density, factory-terminated assemblies, ultra-low-loss single-mode fiber, and rapid-turn supply models that reduce on-site labor intensity. That shift is visible in long-term supply commitments and capacity expansions: Corning announced a multiyear agreement with Meta worth up to USD 6 billion to accelerate U.S. data center buildout and related optical supply, and it also disclosed manufacturing expansions covering U.S. optical connectivity and fiber capacity. Prysmian signed a long-term agreement with Molex for data center optical cable supply and communicated an investment plan of EUR 1.25 billion through 2031 to expand optical cable and fiber production, supporting larger, programmatic procurement cycles rather than one-off project buying.
In Europe, policy and permitting frameworks also create opportunity around access deployment and in-building readiness, particularly where coordination reduces build friction and supports copper-to-fiber migration. The Gigabit Infrastructure Act, in force since May 2024 and applying primarily from November 2025, supports more standardized access to passive infrastructure, improving the business case for dense urban infill, in-building cabling upgrades, and shared-asset build models that favor suppliers with modular indoor and outdoor portfolios. The proposed Digital Networks Act, introduced in January 2026, provides another anchor for harmonized investment conditions, while existing gigabit targets and subsidy programs keep demand for long-haul, metro, and access-layer cables active across markets including Germany, France, Italy, Spain, and the United Kingdom.
Recent Industry Developments in United States And European Fiber Optic Cable Market
- July 2026: Prysmian Group signed a long-term agreement with Molex for optical cable supply to data centers, backed by a 1.25 billion euro investment to double U.S. fiber capacity by 2031. The launch expands high-volume fiber cable supply for data-center builds. Strengthens North American production footprint; enables large-scale, multiyear BEAD-like deployment readiness.
- June 2026: Corning Inc announced a multibillion-dollar agreement with Amazon to supply fiber optic and connectivity solutions, creating 1,000 jobs in North Carolina. Anchors AI-driven cloud connectivity expansion in the U.S. Enhances Corning’s scale in data-center fiber supply and downstream services; reinforces US regional capacity.
- May 2026: Corning Inc partnered with NVIDIA to expand U.S. optical connectivity manufacturing capacity by tenfold and fiber production by over 50%, including three new facilities in North Carolina and Texas. Catalyzes fiber capacity for AI/ML data-center workloads. Material increase in domestic manufacturing capacity; accelerates AI-focused fiber deployment.
United States And European Fiber Optic Cable Market Report Scope and Research Methodology
Market Definition and Coverage
For this study, the market includes fiber optic cable sold for telecom and enterprise network buildouts across the United States and Europe, counted on a value basis at manufacturer level. It covers cable used in long-haul, metro, access, and in-building deployments, regardless of the customer channel.
Scope exclusions: We exclude optical transceivers, active network equipment, and ongoing managed network services, even if they are sold in the same project bundle.
Segments Covered in This Report
- By Cable Type
- Loose-tube
- Tight-buffered
- Ribbon
- Armoured
- By Mode
- Single-mode
- Multi-mode
- By Deployment Type
- Underground
- Aerial
- Submarine
- By End-user Industry
- Telecommunications
- Power Utilities
- Defense and Military
- Industrial and Manufacturing
- Medical
- By Country
- United States
- Germany
- United Kingdom
- France
- Italy
- Spain
- Netherlands
- Austria
- Switzerland
- Rest of Europe
Data Sources, Market Sizing, and Validation
Desk Research
Desk work started by mapping fiber deployment demand signals and policy timelines, since these two regions are heavily influenced by public broadband programs and build targets. We relied on public sources such as the US Federal Communications Commission broadband datasets, US Census construction indicators, Eurostat digital and construction statistics, the European Commission Digital Decade tracking, and the International Telecommunication Union connectivity indicators, to set directionally correct volume and rollout context.
To translate activity into a value model, we screened import and export trade releases where relevant, reviewed cable standards and safety requirements that affect product mix, and then checked demand themes through company filings, earnings decks, and reputable industry press. Select paid subscriptions were used only to speed up company financials, patent lookups, and shipment level trade scans where public reporting was incomplete. The desk sources listed above are illustrative only, and many other references were also used for data collection, validation, and research clarification.
Primary Interviews and Surveys
Primary work focused on validating what is actually being purchased and installed, since procurement shifts quickly between single-mode counts, ribbon designs, and deployment types. We spoke with a mix of cable makers, distributors, installers, telecom operators, and large enterprise network teams across the United States and key European markets, so gaps from desk findings could be closed and assumptions could be triangulated. Interviews were also used to sanity-check pricing movement, lead times, and how much of demand is tied to new builds versus upgrades.
Distribution of primary research fieldwork respondents
| Company type | Respondent position |
|---|---|
| Top tier: 29% | CXOs: 14% |
| Mid tier: 57% | Functional/Unit leaders: 27% |
| Smaller Players: 14% | Managers: 59% |
Market-Sizing & Forecasting
Sizing used a top-down and bottom-up approach, but it was led by a demand pool build that ties back to network build activity in the United States and Europe. We first reconstructed addressable cable demand by linking fiber passings and route expansion patterns to typical cable consumption by deployment type (aerial, underground, and in-building), and then converted it into value using region-appropriate pricing assumptions.
To keep the model grounded, a few practical inputs were tracked closely, including fiber-to-the-home build rates, 5G backhaul densification, data center interconnect projects, average fiber counts per cable, and the split between single-mode and multi-mode demand. We also used indicators like construction cadence and public broadband funding release schedules as timing checks, because spending does not translate into cable orders on day one.
Forecasts were built using scenario analysis, since project pacing is sensitive to permitting, labor availability, and program disbursement. Base, conservative, and faster-rollout cases were discussed with industry respondents, and then the final path was selected after price and volume assumptions were reconciled against recent ordering behavior. Where bottom-up data was missing for smaller channels, we filled gaps using sampled average selling prices multiplied by implied volumes, and then adjusted totals after channel checks.
Data Validation & Update Cycle
Validation was done in layers so one data point could not drive the outcome. Model totals were compared against independent signals such as deployment activity announcements, trade movement direction, and changes in stated capacity and utilization shared in public materials, and then variances were investigated before sign-off.
If an assumption moved sharply, such as a sudden price reset, a policy timeline change, or a major shift in deployment mix, respondents were re-contacted and the model was re-run with updated inputs. The report is refreshed annually, and interim updates are made when material events change the demand picture. Before delivery, an analyst completes a fresh review pass so the final numbers reflect the latest available information.
Mordor Intelligence's United States and European Fibre Optic Cable Market Size Versus Other Published Estimates
Different published market sizes for the same topic are common, because each publisher can draw the line differently on what counts as cable revenue and what gets treated as adjacent hardware or installation activity. The year used, the currency conversion timing, and how pricing is progressed also create visible gaps, especially when the product mix is shifting.
Some estimates fold in passive connectivity components and installation related bundles that travel with cable orders in large projects. For Mordor Intelligence, the value is limited to fiber optic cable shipped into the United States and Europe, and items like connectors, splice closures, and patch panels are excluded even when procured together.
Benchmark comparison
| Source | Market Size | Gaps in Research Methodology |
|---|---|---|
| Mordor Intelligence | USD 4.18 B (2025) | |
| Regional Consultancy A | USD 3.40 B (2025) | Uses a narrower capture of cable demand tied mainly to access builds like FTTx, and it can undercount metro and data center linked pull-through in the same year. |
| Industry Aggregator B | USD 3.10 B (2024) | Combines cable with related passive components and then reports a different base year, which changes the value level when pricing and project timing shift between years. |
Taken together, the spread mostly comes from scope choices and base-year alignment, followed by how each model treats pricing and deployment timing. By keeping cable-only rules consistent and then checking the result against rollout signals and buyer feedback, the final value stays traceable to inputs that can be repeated in future refreshes.
Key Questions Answered in the Report
How large is the United States and European fiber optic cable market in 2026?
The fiber optic cable market size across these two regions is valued at USD 4.56 billion in 2026.
What is the forecast CAGR for regional fiber deployments through 2031?
Aggregate revenue is expected to grow at a 9.05% CAGR between 2026 and 2031.
Which cable type is growing fastest?
Tight-buffered designs aimed at data center interiors post the highest 9.54% CAGR forecast to 2031.
Why are ultra-low-loss single-mode fibers gaining attention?
G.654.E fibers lower attenuation below 0.16 dB/km, cutting the number of repeaters in long-haul and subsea links and reducing total system cost.
How do government broadband programs influence demand?
The U.S. BEAD and EU Digital Decade initiatives supply multi-year funding that guarantees volume commitments, improving factory utilization rates for cable producers.
Which country leads spending within the studied regions?
The United States holds 38.12% of 2025 regional revenue and continues to outpace Europe, supported by hyperscale data center builds and fiber-first subsidies.