
United States Aluminum Beverage Cans Market Size and Share
Market Overview
| Study Period | 2020 - 2031 |
|---|---|
| Forecast Data Period | 2026 - 2031 |
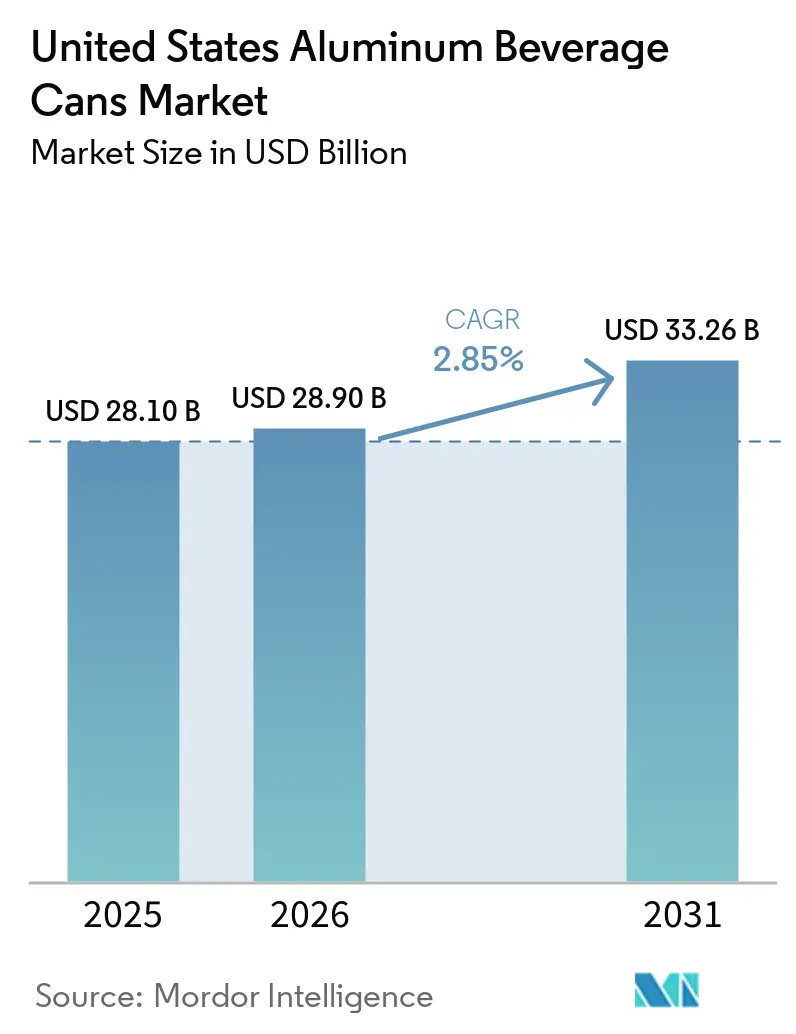
| Base Year Market Size (2025) | USD 28.10 Billion |
| Market Size (2026) | USD 28.90 Billion |
| Market Size (2031) | USD 33.26 Billion |
| Growth Rate (2026 - 2031) | 2.85 % |
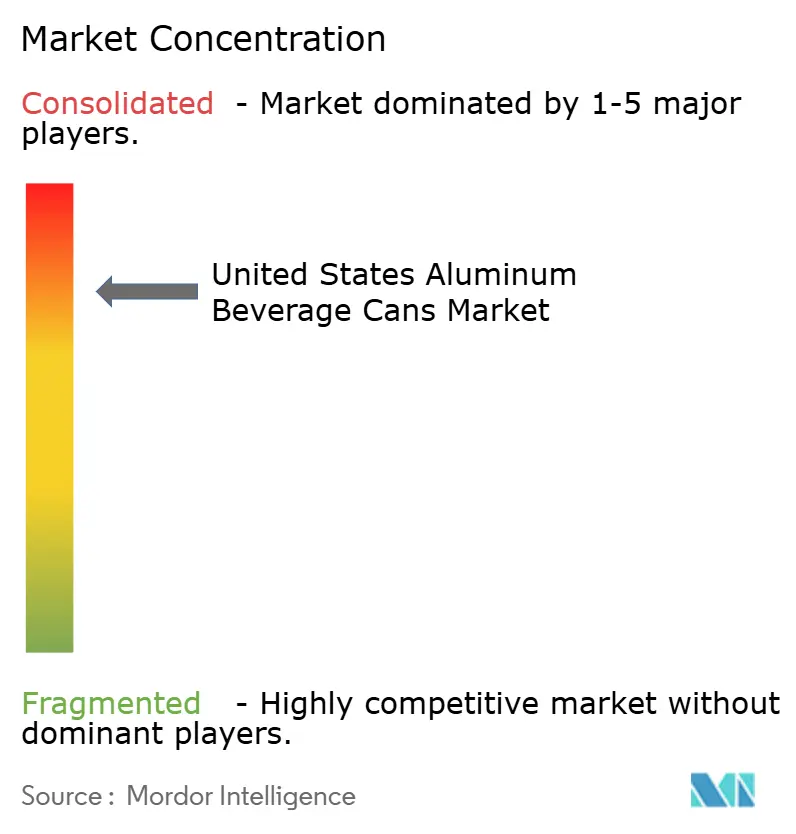
| Market Concentration | High |
Major Players *Disclaimer: Major Players sorted in no particular order Image © Mordor Intelligence. Reuse requires attribution under CC BY 4.0. | |
United States Aluminum Beverage Cans Market Analysis by Mordor Intelligence
The United States aluminum beverage cans market size in 2026 is estimated at USD 28.9 billion, growing from 2025 value of USD 28.10 billion with 2031 projections showing USD 33.26 billion, growing at 2.85% CAGR over 2026-2031. Demand remains resilient as large beverage brand owners tighten sustainability targets, while two-piece draw-and-iron technology keeps production costs in check despite aluminum tariffs that inflate domestic metal prices by about 10%. Capacity additions such as Novelis’s Bay Minette rolling mill are expected to ease sheet shortages from 2026, but lead times for non-contract buyers still extend to 12-16 weeks. Equipment upgrades that integrate IoT sensors cut change-over losses by 8-12%, helping fillers offset higher material costs. Ongoing FDA restrictions on PFAS will require full coating reformulations by 2026, creating short-term compliance costs but long-term competitive advantage for first move.
Key Report Takeaways
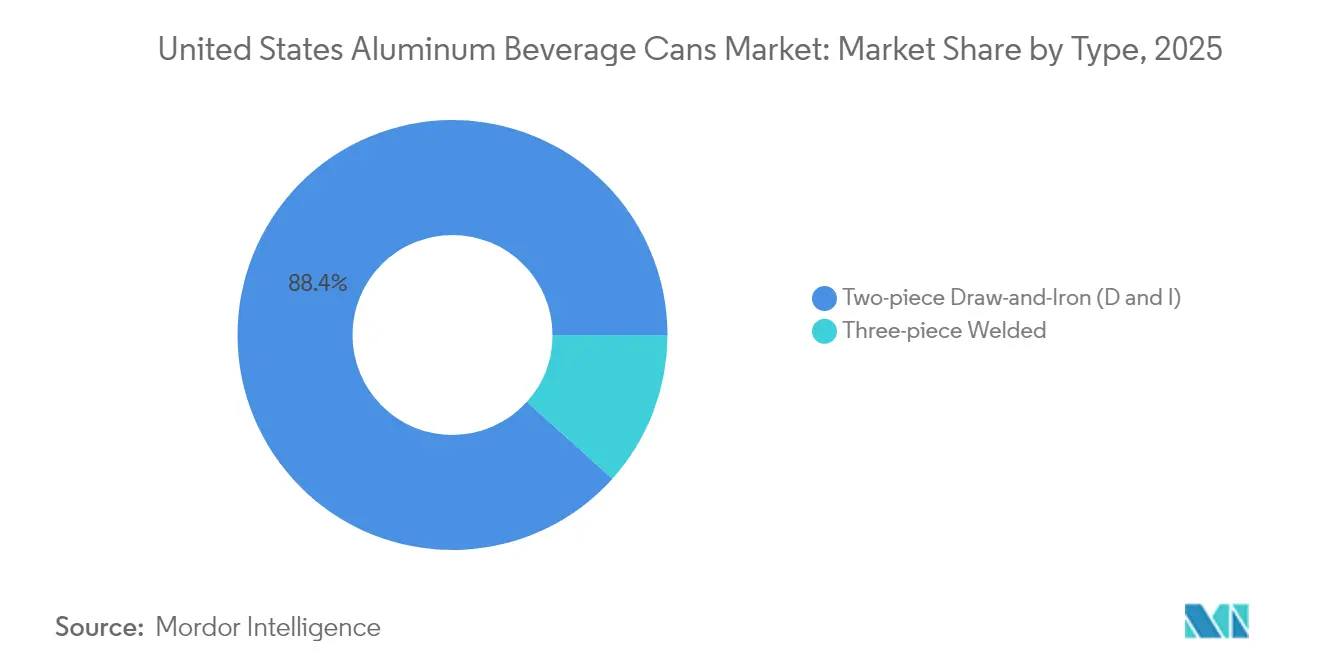
- By type, two-piece draw-and-iron technology held 88.35% of the United States aluminum beverage cans market share in 2025 and is projected to expand at a 3.58% CAGR through 2031.
- By beverage type, flavored alcoholic drinks led growth and are set to record a 3.95% CAGR between 2026 and 2031, while beer retained 31.05% revenue share in 2025.
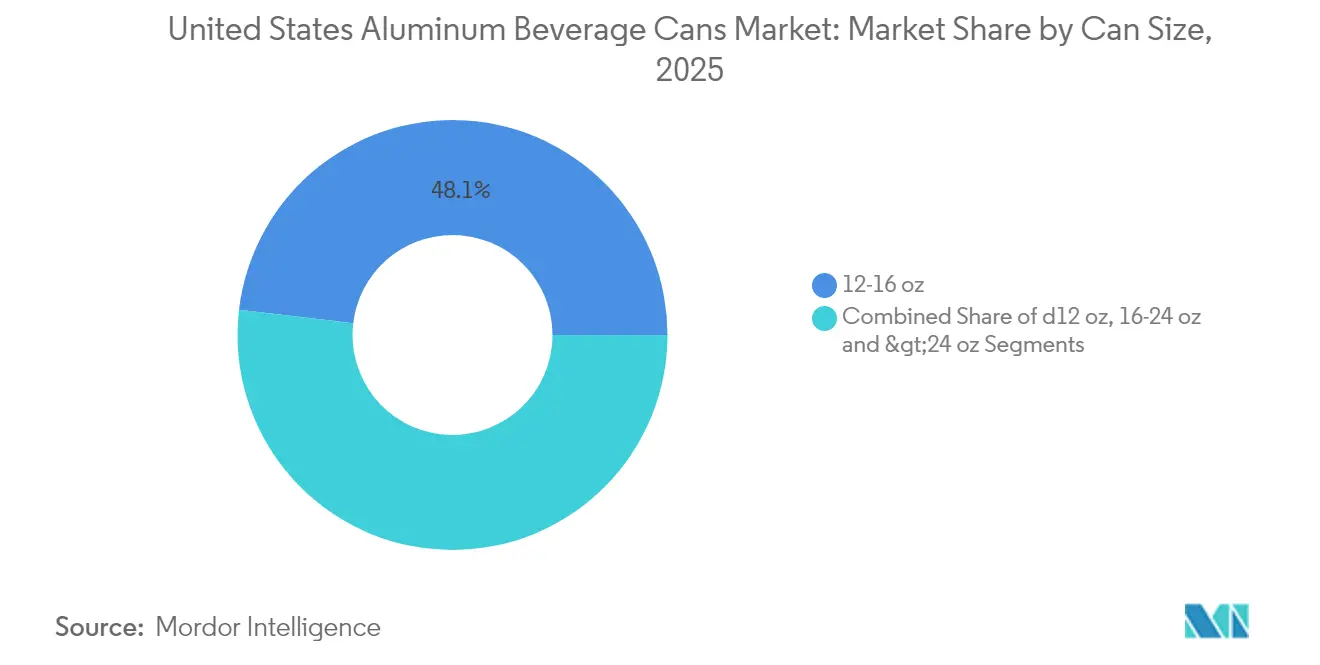
- By can size, the ≤12-oz segment captured 3.39% CAGR potential through 2031, whereas 12-16 oz formats maintained 48.12% share of the United States aluminum beverage cans market size in 2025.
- By distribution channel, direct sales accounted for 64.10% of the United States aluminum beverage cans market share in 2025, while indirect channels are forecast to rise at a 4.55% CAGR to 2031.
Note: Market size and forecast figures in this report are generated using Mordor Intelligence’s proprietary estimation framework, updated with the latest available data and insights as of 2026.
Market Trends and Insights
Drivers Impact Analysis of United States Aluminum Beverage Cans Market*
| Driver | (~) % Impact on CAGR Forecast | Geographic Relevance | Impact Timeline |
|---|---|---|---|
| Growing demand from non-alcoholic beverage producers | +0.8% | National – Southeast and West Coast | Medium term (2-4 years) |
| Surge in craft beer and hard seltzer launches | +0.9% | National – Colorado, California, North Carolina | Short term (≤ 2 years) |
| Corporate ESG targets favoring infinitely recyclable packaging | +0.6% | National – led by Fortune 500 beverage companies | Long term (≥ 4 years) |
| Aluminum smelter capacity expansions in North America | +0.4% | Gulf Coast and Pacific Northwest | Long term (≥ 4 years) |
| IoT-enabled filling lines | +0.3% | Major metropolitan hubs | Medium term (2-4 years) |
| Blockchain traceability pilots | +0.2% | Premium beverage segments | Long term (≥ 4 years) |
| Source: Mordor Intelligence | |||
Growing Demand from Non-Alcoholic Beverage Producers
Energy drink and ready-to-drink coffee brands favor aluminum formats to boost shelf life and brand differentiation. Red Bull’s Phoenix complex runs a through-the-wall setup that merges can making with beverage filling, trimming logistics costs, and protecting its proprietary 250 ml format. National retailers report that aluminum containers lift premium shelf pricing by 6-8%, allowing functional beverage makers to maintain margins despite stiff competition. RTD tea producers similarly leverage aluminum’s light barrier to save 25% in cold-chain expenses compared with PET. These format advantages are translating into firm purchase commitments that lock in rolled sheet contracts through 2027. As demand widens beyond energy drinks into sports nutrition beverages, small fillers expect can volumes to rise another 5% annually.
Surge in Craft Beer and Hard Seltzer Launches
Hard seltzer’s sleek 12 oz profile became a packaging standard after multiple brands captured double-digit share in flavored alcohol sales during 2024. Craft breweries that once relied on bottles migrated to cans as large converters like Ball offered short-run graphics and lighter gauge material. However, spot buyers paid up to 60% premiums in 2024 when contract volumes were fully allocated, forcing many small breweries to secure distributor-managed inventory buffers. With capacity additions coming online, price gaps are narrowing, yet sleek and 16 oz formats continue to dominate new product launches as consumers associate cans with freshness and recyclability. The trend is likely to persist as alcoholic sparkling teas and spirit-based RTDs replicate hard seltzer’s marketing playbook.
Corporate ESG Targets Favoring Infinitely Recyclable Packaging
Ball’s Perfect Circle roadmap aims for 90% global collection rates and 85% recycled content by 2030, aligning with beverage brand pledges for fully recyclable packaging. [1]These commitments elevate demand for can-sheet that carries ≥70% recycled aluminum, prompting premium fees of 12–15 USD per tonne. Novelis committed USD 2.5 billion to rolling and recycling upgrades that support higher post-consumer content. CPGs are inserting minimum recycled-content clauses into multiyear supply contracts, effectively locking in demand growth for closed-loop can material even as overall beverage volumes plateau.
Aluminum Smelter Capacity Expansions in North America
The 600,000-tonne Bay Minette plant remains the single largest addition planned for U.S. beverage can sheet, though commissioning slipped to late 2025 due to equipment delays. Additional debottlenecking projects in the Pacific Northwest aim to leverage renewable hydroelectric power to reduce scope-2 emissions for can-sheet. Once operational, fresh capacity should shave freight costs for West Coast fillers by roughly USD 80 per tonne. In the interim, converters are maintaining higher inventory days to mitigate sheet shortages during seasonal demand spikes.
Restraints Impact Analysis of United States Aluminum Beverage Cans Market*
| Restraint | (~) % Impact on CAGR Forecast | Geographic Relevance | Impact Timeline |
|---|---|---|---|
| PET lightweighting and tethered-cap compliance | -0.4% | Regions with active EPR programs | Medium term (2-4 years) |
| Domestic aluminum price volatility from Section 232 tariffs | -0.6% | Nationwide – highest for non-integrated fillers | Short term (≤ 2 years) |
| Can-sheet coil bottlenecks | -0.5% | Areas distant from Gulf Coast mills | Medium term (2-4 years) |
| High capex for 3-piece to Dand I conversion | -0.3% | Small regional producers | Long term (≥ 4 years) |
| Source: Mordor Intelligence | |||
PET Lightweighting and Tethered-Cap Compliance
Competing PET bottle suppliers trimmed resin by up to 10% per unit in 2024, narrowing the delivered-cost gap with cans. European tethered-cap mandates inspired a pipeline of universal lid systems that global beverage multinationals could adopt across regions, threatening can volumes if consumer acceptance grows. State-level extended producer responsibility legislation will add further compliance costs to all packaging materials, though aluminum’s 30-day average recycling loop remains an advantage. To counter PET’s advances, can makers are testing even thinner gauges and exploring printable embossing to maintain brand shelf impact without extra weight.
Domestic Aluminum Price Volatility from Section 232 Tariffs
Section 232 duties keep Midwest Transaction Prices 15–20% above LME trends, pressuring converters that lack vertical integration and forcing quarterly surcharge pass-throughs to beverage customers. Spot price swings of up to 5 cents per pound in 2024 compelled some small fillers to hedge through distributor pools, raising working capital needs. If tariff relief does not emerge, continued cost uncertainty could dampen can adoption among emerging beverage brands with thin margins.
*Our forecasts treat driver/restraint impacts as directional, not additive. The impact forecasts reflect baseline growth, mix effects, and variable interactions.
United States Aluminum Beverage Cans Market Segment Analysis
By Type:
Production Efficiency Anchors D and I DominanceTwo-piece draw-and-iron cans accounted for 88.35% of the United States aluminum beverage cans market share in 2025, and performance gains should lift this segment at a 3.58% CAGR to 2031. Ball’s STARcan family already delivers up to 8% weight savings versus legacy D and I-designs, reinforcing margins as metal premiums rise. Incremental lightweighting through base compression and alloy refinements reduces material consumption while preserving the top-load strength required for high-speed filling. Embedded vision systems now inspect every formed shell, cutting defect rates below 50 parts per million and minimizing scrap. These advances are particularly relevant to canned beverages, where manufacturers are balancing material efficiency with the performance requirements of high-volume production.
Three-piece welded cans remain a niche for specialty beverages that favor distinctive shapes, yet the FDA’s PFAS phase-out will drive coating redesign and could accelerate their decline. Production cycle times for welded formats remain roughly 30% slower than high-speed D and I lines, discouraging volume beverages from adopting them. Nonetheless, select craft producers opt for three-piece to create retro branding cues, and aerospace-grade coatings under development may extend shelf life for acidic juice blends. Capital requirements for D and I presses, however, still deter small fillers, leaving limited pockets of demand for welded cans.

By Beverage Types:
Flavored Alcoholic Drinks Sustain OutperformanceFlavored alcoholic beverages, led by hard seltzer line extensions, are forecast to post a 3.95% CAGR and will continue outpacing core beer volumes through 2031. Sleek 12-oz formats deliver strong visual differentiation at retail while catering to calorie-conscious consumers who prefer smaller serving sizes. Carbonated soft drinks retain a broad consumption base, but growth trails functional beverage categories that promise energy, immunity, or hydration benefits.
RTD coffee and tea exploit aluminum’s barrier to oxygen and light, allowing ambient shipping for products that once required costly refrigeration. As nitro coffee grows, pressurized aluminum containers provide consistent crema, sparking partnerships between independent roasters and regional canners. Energy drinks sustain volume growth in 16 oz sizes, cementing aluminum’s role in high-impact branding with matte and textured finishes. Innovations in can lining chemistry now tolerate low-pH citrus mixes, opening potential for canned juice cocktails.
By Can Size:
Premiumization Moves to Smaller ProfilesThe ≤12 oz category is projected to rise at 3.39% CAGR through 2031, reflecting consumer appetite for portion control and premium positioning. Specialty coffee, hard kombucha, and craft beer brands often select 8-10 oz cans to justify higher unit pricing while managing alcohol or caffeine thresholds.
In contrast, the 12-16 oz bracket captured 48.12% of the United States aluminum beverage cans market size during 2025 and continues as the mainstream option for carbonated beverages and energy drinks. Larger 19.2 oz and 24 oz cans serve convenience-store multipacks and value beer offerings, but face cooler-space limitations. Manufacturer R and D now focuses on necked sleek variants that maintain shelf standout while enabling easier stacking for downstream logistics.
By Distribution Channel:
Service Levels Drive Channel ChoicesDirect contracts constituted 64.10% of the United States aluminum beverage cans market share in 2025, with brand owners valuing assured supply and joint innovation programs. Multi-year agreements allow converters to dedicate specific line time, stabilizing utilization rates above 90%.
Indirect channels, growing at 4.55% CAGR, cater to craft breweries and start-ups that lack volume scale. Specialist distributors aggregate orders, provide graphic design support, and finance working capital, but premiums range from 40% to 60% over direct pricing. Some intermediaries are installing small-batch digital printers to shorten lead times for limited-edition runs, helping emerging brands launch seasonal SKUs without committing to large minimums.
Geography Analysis
The Southeast ranks as the largest regional contributor, benefiting from proximity to Gulf Coast smelters and the Atlanta beverage corridor, where multiple fillers and brand headquarters cluster. Integrated supply chains shorten freight lanes, letting converters pass through lower delivered metal costs to local brand owners. Continued inward manufacturing investment in Alabama and Georgia could further entrench the region’s dominance once Novelis’s Bay Minette mill reaches full ramp in 2026.
The West Coast forms the second-largest consumption node but faces higher sheet freight surcharges, spurring can makers to hold larger local inventories. Craft beer density in California, Oregon, and Washington keeps demand buoyant, and container deposit laws enhance aluminum recovery rates that feed a closed-loop supply. However, periodic smelter curtailments in the Pacific Northwest, triggered by power price spikes, tighten alloy availability and inject price volatility.
Midwestern demand remains stable thanks to long-established soft-drink bottling hubs, though older equipment fleets require modernization to match the high-speed throughput of newer Southeast plants. The Northeast maintains niche premium beverage growth, leveraging dense urban markets but relying heavily on inbound sheet from Gulf producers. Emerging extended producer responsibility legislation could alter recycling economics across states, providing advantages to regions that already hit high collection benchmarks.
Regulatory Landscape
US aluminum beverage can producers operate under a mix of food-contact and emissions compliance requirements, with oversight anchored by the FDA for food-contact substances (including can body and end materials and internal coatings) and the EPA for air emissions from can surface-coating operations. For coating lines, EPA rules under the Clean Air Act apply through NSPS (section 111) and NESHAP (section 112), including requirements referenced under 40 CFR 63.3481 for metal can surface coating, which shape solvent selection, abatement systems, and documentation practices across can-forming and decorating plants.
Trade policy also remains a key cost and sourcing variable through Section 232 actions affecting aluminum and derivative products. In April 2025, the Department of Commerce implemented 25% tariffs on imported beer and empty aluminum cans, and in June 2026 the White House issued Proclamation 11021 adjusting Section 232 tariff regimes while keeping 25% ad valorem duties on certain metal derivative products, including aluminum cans. This reinforces the importance of domestic contracting and surcharge pass-through mechanisms. Legislative attention to scrap tracking also increased in 2026 with the introduction of the CANS Act (H.R. 7992), which mandates a continuous USGS study of aluminum disposed of in US landfills and related scrap flows, supporting policy focus on recovery and circular supply.
Value Chain Analysis
The value chain starts with primary aluminum supply and recycled aluminum feedstock, then moves into can-sheet rolling, can forming (predominantly two-piece DWI/D and I), coating and decoration, and finally distribution to beverage fillers and brand owners through direct contracts and distributors serving smaller buyers. Sheet producers and recyclers sit upstream of can makers, while downstream performance depends on high-speed filling compatibility, end and tab supply, and graphics conversion. In most cases, plants are positioned near filling operations to reduce freight and support just-in-time delivery, whereas spot buyers can face longer lead times when sheet or line time is fully allocated.
Recycling and scrap recovery also operate as a parallel loop feeding can-to-can material. Industry sources cite a 43% US aluminum beverage can recycling rate in 2023 alongside multi-decade targets (70% by 2030, 80% by 2040, 90% by 2050). The Aluminum Association has described the can as a high-value recycling stream material (reported around USD 1,338 per ton on average), which supports investments in capture and sorting at material recovery facilities and strengthens closed-loop contracting between sheet mills, can makers, and major beverage customers. Trade actions and tariff advocacy further shape the chain by influencing import economics for metal inputs and encouraging greater reliance on domestic rolling, recycling upgrades, and long-term supply agreements.
Competitive Landscape
Ball Corporation and Crown Holdings jointly control roughly 60–65% of United States aluminum beverage cans market share, reflecting a moderately consolidated structure. Ball’s acquisitions of Alucan in October 2024 and Florida Can Manufacturing in February 2025 added 1.2 billion-can annual capacity, securing slots for craft beverage growth. Crown’s capacity extensions in Virginia and Nevada bolster service to Western independents, raising its geographic balance.
Second-tier players Silgan Holdings, Ardagh Metal Packaging, and Independent Can Company pursue regional specialization or custom formats to sidestep head-on volume competition. Many invest in IoT-ready vision modules that lift line utilization and furnish real-time quality data to brand owners. Patent filings show heightened activity in PFAS-free coatings and alloy blends optimized for additive manufacturing, fields where smaller innovators could license technology to majors.[3]
Regulatory compliance costs favor scale operators able to spread R and D spending across multiple plants, yet white-space opportunities persist in shaped cans, tactile inks, and resealable end technology. Partnerships between coaters and converters accelerate qualification cycles as the 2026 PFAS deadline approaches, with early adopters likely to win premium beverage contracts seeking greener credentials.
United States Aluminum Beverage Cans Industry Leaders
-
Crown Holdings Inc.
-
Ball Corporation
-
Silgan Holdings Inc.
-
Ardagh Group S.A.
-
Envases Universales de México S.A. de C.V.
- *Disclaimer: Major Players sorted in no particular order
United States Aluminum Beverage Cans Market Companies Covered in this Report
- Crown Holdings, Inc.
- Ball Corporation
- Silgan Holdings Inc.
- Mauser Packaging Solutions Holding Company
- Ardagh Metal Packaging S.A.
- DS Containers, LLC
- CCL Industries Inc. (CCL Container division)
- Independent Can Company
- Tecnocap S.p.A.
- CAN-PACK S.A.
- Allstate Can Corporation
- Envases Universales Group
- Trivium Packaging B.V.
- Greif, Inc.
- Toyo Seikan Group Holdings, Ltd.
- Montebello Packaging Inc.
- Berlin Packaging LLC
- TricorBraun Inc.
- Crown Cork and Seal USA, Inc.
- Metal Container Corporation
Read Analysis of United States Aluminum Beverage Cans Companies
Market Opportunities and Future Outlook
Near-term whitespace centers on supply assurance, recycled-content sourcing, and coatings that can pass compliance and customer qualification. Brand owners push sustainability clauses into multiyear contracts, and converters respond by managing high utilization alongside lead-time risk for non-contracted buyers. Evidence of tight capacity includes Ball reporting that 2026 US production capacity was fully committed and citing mid-to-high 90% utilization across North American operations during 2026, which increases the value of long-term offtake agreements, distributor-managed inventory buffers, and localized capacity planning near major filling corridors.
Recycling-related opportunities connect to can-sheet availability and cost stability, with industry bodies such as the Can Manufacturers Institute and The Aluminum Association prioritizing higher can capture and can-to-can recycling (targets of 70% by 2030, 80% by 2040, and 90% by 2050). Investments that expand domestic rolling and recycling throughput can also widen procurement headroom for higher post-consumer content; Novelis, for example, initiated a restart of its Oswego, New York rolling and recycling plant following 2025 fire-related downtime. At the same time, 2026 regulatory and customer pressure on PFAS-free and low-migration linings keeps coating reformulation and qualification capacity as a competitive lever for securing premium beverage programs and reducing switching barriers for categories including RTD coffee, tea, and flavored alcoholic beverages.
Recent Industry Developments in United States Aluminum Beverage Cans Market
- April 2026: Crown Holdings announced plans to build a new two-line beverage can manufacturing facility in Northern India, with production capacity cited at about 2.2 billion cans annually and start of operations targeted for the second half of 2027. While outside the United States, it shows where a major US supplier is directing incremental growth capital and how global capacity allocation can affect equipment queues, technology standardization, and internal capital prioritization across its can network.
- February 2025: Ball Corporation completed the acquisition of Florida Can Manufacturing, adding two plants in the Southeast and expanding its footprint serving high-growth beverage corridors. The deal strengthened Ball's ability to secure multiyear contracts with brand owners that prioritize supply assurance and faster changeovers for short-run and specialty formats.
- October 2024: Ball Corporation acquired Alucan to expand capabilities in premium can forming and specialty coatings. This supported higher-margin format innovation and accelerated qualification pathways for differentiated packaging used by craft and premium beverage brands.
United States Aluminum Beverage Cans Market Report Scope and Research Methodology
Market Definition and Coverage
This market covers the value of aluminum beverage cans sold in the United States for filling and packaging drinks, counted at the point of can supply into beverage packaging. It reflects demand linked to beverage can shipments and typical can formats used across major beverage categories.
Scope exclusions: We exclude non-beverage metal cans, plastic or glass packaging, and aluminum used in foils, trays, or other non-can beverage components.
Segments Covered in This Report
- By Material Type
- Aluminium
- Steel
- By Can Structure
- Two-Piece
- Three-Piece
- Monobloc Aerosol
- By Capacity / Size
- ≤12 oz
- 250-500 ml
- 500-1,000 ml
- >1,000 ml
- By Manufacturing Process
- Drawn and Ironed (DandI)
- Drawn and Redrawn (DRD)
- Impact Extrusion
- By End-User Industry
- Food
- Beverage
- Personal Care and Cosmetics
- Pharmaceuticals
- Paints and Industrial Chemicals
- Automotive Fluids and Lubricants
- Other End-User Industry
Data Sources, Market Sizing, and Validation
Desk Research
Desk work starts with public data that helps us understand how many cans the US market is likely absorbing and what is changing in the packaging mix. We refer to sources such as the US Census Bureau's manufacturing and trade statistics, the US International Trade Commission data for tariff and trade context, and the Bureau of Labor Statistics price series that help explain conversion cost pressure.
We also use packaging and recycling references such as the Aluminum Association and other industry bodies, along with FDA notices that can impact can coatings and compliance timing. Company filings, investor presentations, and reputable press are used to understand capacity additions, plant utilization commentary, and pricing pass-through language. Where it helps, we also cross-check select company financials and shipment signals through paid subscriptions focused on company intelligence, patents, and import/export shipment-level data. The sources listed here are illustrative, and many other public and industry references were also reviewed for data collection, validation, and research clarification.
Primary Interviews and Surveys
Primary work is used to pressure-test the desk model with people who see orders and mix changes early, including can makers, sheet suppliers, beverage fillers, and packaging distributors. We also speak with operations and commercial roles to confirm how can size mix, beverage category shifts, and contract pricing cadence are moving across the United States, and then we reconcile differences before finalizing assumptions.
Distribution of primary research fieldwork respondents
| Company type | Respondent position |
|---|---|
| Top tier: 37% | CXOs: 13% |
| Mid tier: 46% | Functional/Unit leaders: 36% |
| Smaller Players: 17% | Managers: 51% |
Market-Sizing & Forecasting
Sizing is built by reconstructing the demand pool from US beverage can usage. We translate beverage category volumes and the share packed in aluminum into can-equivalent demand, then express value using realized pricing and mix. The top-down and bottom-up logic is kept straightforward, with totals first anchored to beverage consumption and packaging mix signals, then corroborated with selective bottom-up approximations such as sampled ASP by can size and channel checks on shipment patterns.
Inputs are kept practical and repeatable, and they include can size mix (for example, 12 oz versus 12 to 16 oz and larger), the split between two-piece D and I and three-piece formats, aluminum sheet cost direction and pass-through timing, tariff-related cost pressure, and capacity additions that affect availability and lead times. For gaps where exact volumes are not publicly visible, we interpolate using conservative ranges validated in interviews and we avoid forcing one-off announcements into the full-year totals.
Forecasts are developed using scenario analysis. The base case ties to expected beverage demand, gradual mix shifts toward cans, and pricing progression consistent with contract reset cycles. Assumptions are adjusted only after cross-checking with interview feedback on utilization, order books, and expected can-format mix changes.
Data Validation & Update Cycle
Outputs are checked against independent signals such as beverage category momentum, recycling and sustainability commitments that influence packaging choices, and capacity utilization commentary from the supply chain. When values move outside expected ranges, the drivers are reviewed, the input series is re-checked, and follow-up calls are triggered to confirm whether the change is real or data noise.
Before publication, the model and assumptions go through multiple analyst reviews so the logic, arithmetic, and units stay consistent across years. Reports are refreshed annually, and interim updates are made when material events occur, such as major capacity start-ups, policy shifts, or sharp cost swings. Right before delivery, an analyst does a fresh pass so clients receive the latest updated view.
Mordor Intelligence's United States Aluminum Beverage Cans Market Size Compared With Other Published Estimates
Published market values for US aluminum beverage cans often do not match, and the reason is usually not one single math step. Differences typically come from what each publisher counts as a can market, the pricing point they apply (sheet, can, or packaged beverage), and how they handle beverage mix changes across sizes and formats.
The main gap comes from counting upstream aluminum sheet value or broader beverage packaging spend, where only finished aluminum beverage cans supplied for US beverage use are included, and Mordor Intelligence ties the value build to can-size mix and contract reset timing instead of short-term metal price swings.
Benchmark comparison
| Source | Market Size | Gaps in Research Methodology |
|---|---|---|
| Mordor Intelligence | USD 28.10 B (2025) | |
| Industry Bulletin A | USD 36.95 B (2024) | This figure is presented with broader industry impact framing and can blend can value with wider cost exposure, which can inflate value versus a cans-only total tied to can shipments and mix. |
| Specialist Publisher B | USD 12.50 B (2024) | This estimate appears to use a narrower pricing basis or partial scope (for example, selected can types or a different value capture point), which can understate totals when standard can sizes, formats, and full beverage coverage are included. |
The spread is mostly explained by what gets included and where value is measured in the chain, which is why the same year can show very different totals. We keep the steps explicit so the final number can be traced back to beverage demand signals, packaging mix, and repeatable pricing assumptions.
Key Questions Answered in the Report
How large is the United States aluminum beverage cans market in 2026?
The market stands at USD 28.9 billion in 2026 and is on track to reach USD 33.26 billion by 2031.
What is the forecast CAGR for aluminum beverage cans through 2031?
The market is projected to expand at a 2.85% CAGR over the 2026-2031 period.
Which can technology holds the biggest share?
Two-piece draw-and-iron cans dominate with 88.35% share in 2025 and continue to grow.
Why are indirect sales channels becoming more popular?
Craft breweries and emerging beverage brands rely on distributors to aggregate volumes and provide just-in-time inventory despite higher pricing.
How will FDA’s PFAS ban affect can manufacturers?
Companies must reformulate interior coatings by 2026, incurring short-term R and D costs but ultimately strengthening sustainability credentials.