
Market Overview
| Study Period | 2020 - 2031 |
|---|---|
| Forecast Data Period | 2026 - 2031 |
| Base Year Market Size (2025) | USD 23.23 Billion |
| Market Size (2026) | USD 25.63 Billion |
| Market Size (2031) | USD 41.84 Billion |
| Growth Rate (2026 - 2031) | 10.33 % |
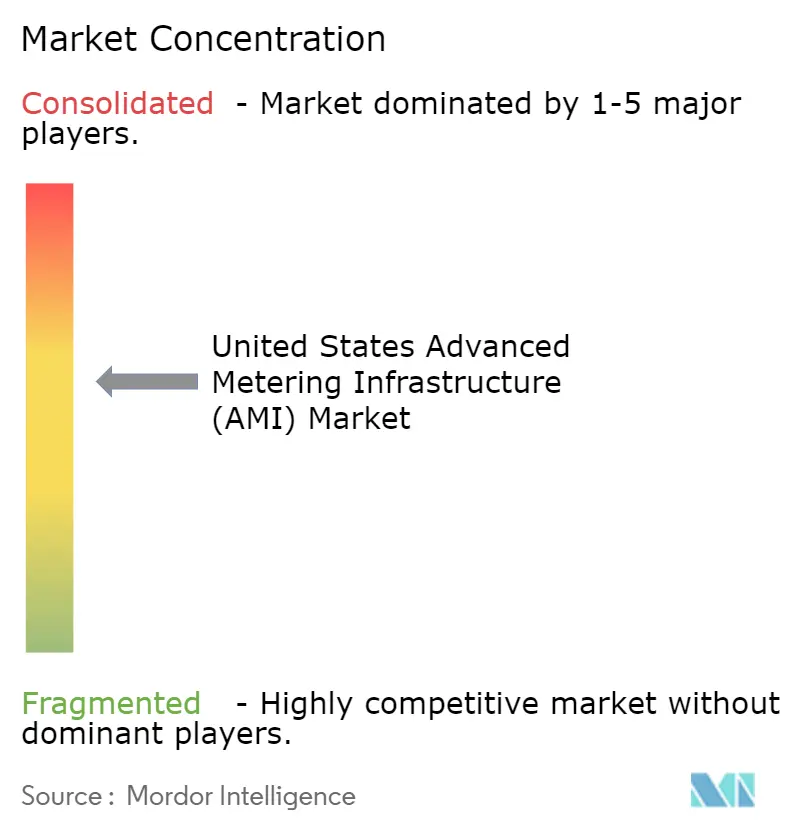
| Market Concentration | Medium |
Major Players *Disclaimer: Major Players sorted in no particular order Image © Mordor Intelligence. Reuse requires attribution under CC BY 4.0. | |
United States Advanced Metering Infrastructure (AMI) Market Analysis by Mordor Intelligence
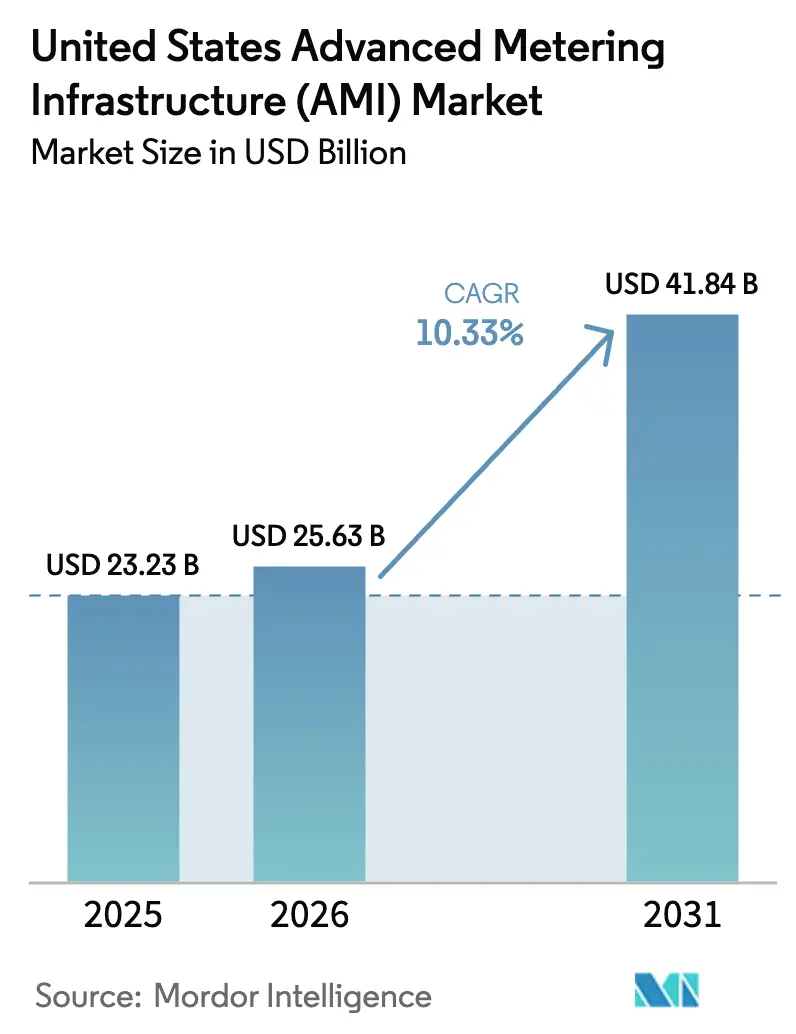
The US AMI market size is expected to grow from USD 23.23 billion in 2025 to USD 25.63 billion in 2026 and is forecast to reach USD 41.84 billion by 2031 at 10.33% CAGR over 2026-2031. Federal infrastructure incentives are shortening payback cycles and pushing utilities of every ownership model to procure advanced metering systems.[1] Vendors now compete on analytics depth rather than meter counts, because utilities want grid optimization tools that create new revenue and customer value. Cybersecurity directives require embedded network monitoring, steering adoption toward secure, standards-compliant platforms.[2] A tightening labour pool is nudging utilities toward vendor-managed services and AI-enabled automation that streamlines grid operations.[3] These forces are reshaping competitive strategies throughout the US AMI market by putting data-centric value creation ahead of hardware volume.
Key Report Takeaways
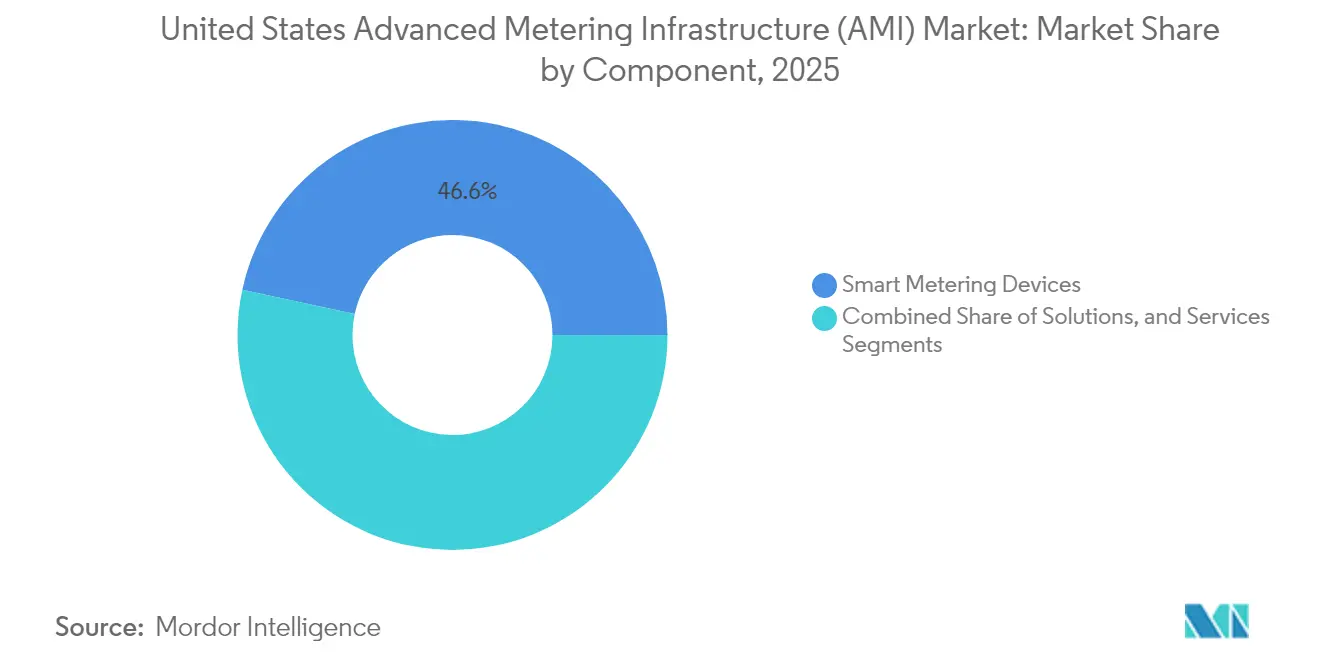
- By component, Smart Metering Devices captured 46.62% of the US AMI market share in 2025, while Software led by Meter Data Analytics is expanding at a 13.62% CAGR through 2031.
- By end-user, residential customers accounted for 88.35% of the US AMI market in 2025, whereas the industrial segment is growing at a 12.92% CAGR to 2031.
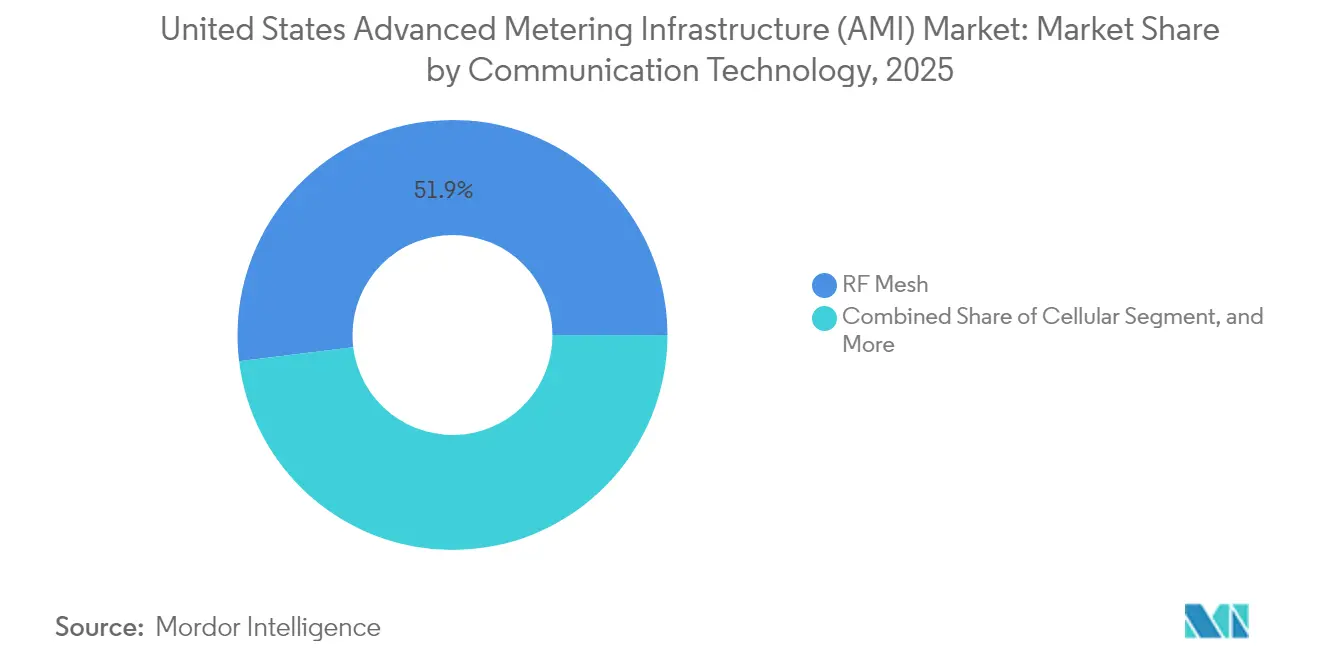
- By communication technology, RF Mesh commanded 51.94% share in 2025, yet Cellular connectivity is rising fastest with a 13.78% CAGR through 2031.
- By utility ownership type, Investor-Owned Utilities held 64.12% share in 2025, but Electric Cooperatives are advancing at the highest rate of 14.31% CAGR to 2031.
Note: Market size and forecast figures in this report are generated using Mordor Intelligence’s proprietary estimation framework, updated with the latest available data and insights as of 2026.
United States Advanced Metering Infrastructure (AMI) Market Trends and Insights
Drivers Impact Analysis*
| Driver | (~) % Impact on CAGR Forecast | Geographic Relevance | Impact Timeline |
|---|---|---|---|
| Federal Roll-out Mandates and Funding Surge | +2.80% | National, concentrated in rural and disadvantaged communities | Medium term (2-4 years) |
| Rising Grid Modernization and DER Integration Needs | +2.10% | National, with higher intensity in California, Texas, and Northeast | Long term (≥ 4 years) |
| Increasing Cybersecurity Standards for Critical Infrastructure | +1.60% | National, with stricter enforcement for investor-owned utilities | Short term (≤ 2 years) |
| Customer Demand for Near Real-Time Billing Insights | +1.20% | National, with higher adoption in urban and suburban markets | Medium term (2-4 years) |
| Shift Toward Cellular-Based AMI Backhaul | +1.40% | National, with faster adoption in areas with strong 5G coverage | Short term (≤ 2 years) |
| AI-Driven Meter Data Analytics Monetization | +1.80% | National, led by large investor-owned utilities and technology-forward cooperatives | Long term (≥ 4 years) |
| Source: Mordor Intelligence | |||
Federal Roll-Out Mandates and Funding Surge
Historic federal spending is changing the economics of the US AMI market by providing direct capital that lowers upfront cost risk for utilities. The Grid Resilience and Innovation Partnerships program has directed USD 5.7 billion across two rounds, with smart grid grants covering AMI, monitoring tools, and automation hardware. State and tribal formula grants have added USD 1.3 billion for resilience projects, many tagged specifically as “monitoring and control technologies.” Direct-pay tax credits under the Inflation Reduction Act allow municipal utilities and cooperatives to claim up to 30% of qualifying AMI investments, which improves project cash flow. These mechanisms shorten regulatory approval cycles and let smaller utilities bundle AMI upgrades with broader grid projects. Procurement momentum that once peaked near rate-case windows now continues year-round, giving vendors steadier order books across the US AMI market.
Rising Grid Modernization and DER Integration Needs
Distributed energy resource growth is forcing utilities to replace legacy meters that lack time-synchronized data. The Department of Energy’s Connected Communities 2.0 program awarded USD 32 million to pilot projects that rely on interval data for EV charging management and renewable coordination.[4] AMI datasets now feed queue-management software that accelerates clean-energy interconnections, as seen in the i2X Innovative Queue Management Solutions program. Utilities need deterministic visibility at the feeder level to run hosting-capacity studies in hours rather than months. This operational requirement turns AMI from a billing upgrade into a core grid-sensing layer for the US AMI market. States with high renewable targets are issuing guidance that any distribution upgrade plan must include metering visibility enhancements, feeding a virtuous cycle of demand.
Increasing Cybersecurity Standards for Critical Infrastructure
FERC’s 2025 order that requires NERC to craft Internal Network Security Monitoring rules pushes AMI procurement toward platforms with built-in encryption and continuous traffic analysis. Upcoming CIP-015-1 language stresses the detection of anomalous traffic inside segmented utility networks. Vendors now highlight packet-level inspection tools embedded in head-end software and endpoint clients. Utilities consider security posture a gating requirement equal to meter accuracy. Engineering firms warn that meters without secure boot or signed firmware create entry points for load oscillation attacks, which can trigger protective relays and jeopardize stability. Compliance deadlines accelerate refresh cycles, raising the baseline security bar across the US AMI market.
AI-Driven Meter Data Analytics Monetization
Analytics platforms that disaggregate appliance loads and forecast feeder headroom are generating new revenue paths for utilities. Honeywell’s integration of Innowatts analytics into its Forge platform illustrates how vendors stitch AI models into device fleets for real-time insight. Investor-owned utilities in high-growth states use AI tools to identify flexible loads and design dynamic pricing tiers. Cooperatives leverage cloud analytics to rank transformer overload risks and plan capital deferrals. These use cases translate raw meter reads into actionable intelligence, raising the ROI narrative that fuels adoption in the US AMI market. The trend also underpins an emerging service model where vendors license predictive modules alongside hardware.
Restraints Impact Analysis*
| Restraint | (~) % Impact on CAGR Forecast | Geographic Relevance | Impact Timeline |
|---|---|---|---|
| Legacy IT/OT Interoperability Gaps | -1.80% | National, with higher impact at smaller utilities with limited IT resources | Medium term (2-4 years) |
| Persistent Consumer-Privacy Pushback | -1.20% | National, with concentrated opposition in privacy-conscious states | Long term (≥ 4 years) |
| Utility Workforce Skill Shortages for Digital Integration Applications | -1.40% | National, with acute shortages in rural and smaller utility territories | Long term (≥ 4 years) |
| Semiconductor Supply Constraints for Meter Integrated Circuits | -0.90% | Global supply chain impacts affecting all US deployments | Short term (≤ 2 years) |
| Source: Mordor Intelligence | |||
Legacy IT/OT Interoperability Gaps
Many first-generation rollouts underinvested in enterprise architecture, producing siloed systems that complicate data exchange. Utilities now face costly middleware deployments to link AMI head-ends with outage, distribution, and customer platforms. Integration of labour shortages inflates project budgets, especially for small public power entities that lack in-house talent. Cloud-native head-ends and open APIs promise relief, yet migration from on-premises environments remains a multiyear process. These technical complexities can delay procurement and slow revenue realization for vendors in the US AMI market.
Persistent Consumer Privacy Pushback
Several states are debating or enacting opt-in clauses for smart meters, reflecting public concerns about granular usage visibility. Colorado’s HB25-1175 mandates consent and obliges utilities to provide non-communicating meters on request. Privacy advocates argue that 15-minute data can disclose occupancy patterns, generating heightened scrutiny over data retention and third-party sharing. Compliance requirements raise deployment costs because utilities must maintain parallel inventory and scheduling processes. Uncertainty around forthcoming privacy statutes complicates long-term AMI value-case modelling across the US AMI market.
*Our forecasts treat driver/restraint impacts as directional, not additive. The impact forecasts reflect baseline growth, mix effects, and variable interactions.
Segment Analysis
By Component: Software Intelligence Surpasses Hardware Scope
Smart Metering Devices represented 46.62% of the US AMI market in 2025, underlining ongoing meter replacement programs, yet Software is set to outpace with a 13.62% CAGR to 2031. This growth pivots on analytics modules that transform interval data into revenue-generating grid services and customer-focused insights. The US AMI market size for software is forecast to narrow the revenue gap with devices before the forecast horizon ends. Utilities pair communication gateways and head-end systems with cloud dashboards that benchmark transformer loading and automate voltage set-points. As data value overtakes meter counts, vendors bundle subscription layers into contracts, creating an annuity stream that boosts margins.
Services are evolving from basic installation to outcome-based agreements, such as guaranteed read-success thresholds and analytics-driven energy savings. Managed services appeal to utilities that cannot staff new data science teams. In the US AMI market, suppliers now propose turnkey models where they own backend infrastructure and deliver meter data through secure APIs. This reduces customer capex and speeds adoption while enlarging vendors’ total contract value.

By End-User: Residential Dominance, Industrial Acceleration
Residential connections made up 88.35% of 2025 revenue, reflecting household volume and federal equity priorities. Large utilities tie AMI rollouts to rate structures that reward conservation, reinforcing residential penetration. Industrial accounts, however, are posting the highest 12.92% CAGR through 2031 as factories electrify processes and integrate renewables. The US AMI market share for industrial users is still modest, yet high growth stems from granular metering needed for demand charges, power-quality monitoring, and wholesale participation.
Many industrial sites operate as prosumers with behind-the-meter solar, storage, or microgrids. They rely on time-synchronized data for settlement and reliability assurances. Some plants require redundant communications paths and cybersecurity certifications because outages translate directly to production losses. Vendors with hardened meters and real-time analytics capture this opportunity, raising the visibility of the industrial segment inside the US AMI market.
By Communication Technology: Cellular Growth Challenges Mesh Supremacy
RF Mesh held 51.94% of 2025 revenue thanks to proven resilience and utility control. Yet Cellular connectivity, propelled by nationwide 5G coverage, is registering the fastest 13.78% CAGR. Utilities like SECO Energy have chosen 5G-ready meters that accept over-the-air firmware updates without truck rolls. The US AMI market size for cellular is expanding as utilities favour carrier-managed backhaul, which lowers network operating complexity.
Private LTE pilots offer dedicated spectrum while leveraging telecom security controls. Mesh technology remains viable for dense urban circuits where hop-by-hop redundancy offsets bandwidth limits. Hybrid architectures combining mesh for local aggregation and cellular for backhaul are common in rural cooperatives. Choices now center on lifecycle cost, latency tolerance, and cybersecurity features rather than signal reach alone, broadening competitive channels across the US AMI market.
By Utility Ownership Type: Cooperatives Lead Pace of Change
Investor-Owned Utilities held 64.12% of 2025 revenue, reflecting expansive customer bases and stable capital flows. Yet, Electric Cooperatives are expanding at a 14.31% CAGR as federal programs earmark grants for rural infrastructure. The US AMI market size allocated to cooperatives grows faster because joint-action groups negotiate bulk hardware pricing and shared analytics hosting. Cooperative case studies, such as Southwestern Electric Cooperative’s Revelo deployment, illustrate how small utilities leapfrog to advanced grid sensing without shouldering full integration risk.
Municipal utilities leverage direct-pay tax incentives to close funding gaps. They often adopt subscription models that spread costs over service life, reducing rate shock. Public power entities benefit from community alignment, which lowers consumer pushback. Diversity in ownership models stimulates varied procurement strategies, widening addressable channels for vendors across the US AMI market.
Geography Analysis
California, Texas, and New York remained the largest state contributors in 2024, reflecting sizable customer bases and aggressive renewable mandates that require granular metering data for hosting-capacity studies. The US AMI market benefits from state programs that channel grants toward disadvantaged neighbourhoods in Los Angeles, Houston, and Buffalo, accelerating meter swap-outs. Western states secured significant allocations under federal resilience grants, sending funds to tribal utilities in Alaska and Arizona for voltage monitoring upgrades.
The Northeast shows accelerating uptake as aging infrastructure meets rising electrification. Utilities in Massachusetts and Maine bundle AMI with load-management pilots to support winter heat-pump adoption. Midwest cooperatives leverage Grain Belt Express interconnection planning to justify AMI analytics that inform power-flow modelling. Southern states, historically slower adopters, now pursue AMI to comply with FERC cybersecurity deadlines and to prepare distribution systems for EV corridor charging.
Privacy legislation creates regional complexity. Colorado’s opt-in rule forces utilities to manage dual meter inventories, while Texas operates under a competitive retail market that demands interval data for supplier billing. These contrasts shape vendor sales cycles and product features. Workforce constraints vary: coastal regions lure data scientists, whereas rural Plains utilities rely on managed-service contracts. Despite these differences, all regions converge on the need for secure, analytics-ready platforms, sustaining unified momentum inside the US AMI market.
Regulatory Landscape
The US AMI regulatory environment is shaped by reliability and cybersecurity oversight, state utility commission rules on data access, and federal funding compliance requirements. At the federal level, Federal Energy Regulatory Commission (FERC) direction in 2025 for NERC to develop Internal Network Security Monitoring-related requirements elevates embedded security monitoring, encryption, and firmware integrity as de facto procurement qualifiers for AMI head-end and field networks.
On the state side, utility commissions are tightening governance for customer and third-party access to interval data, which is reshaping AMI data-management and consent workflows. For example, the New Jersey Board of Public Utilities proposed AMI Data Access Standards (N.J.A.C. 14:5-10) that define how AMI data is collected and shared. Federal infrastructure programs administered by the US Department of Energy (DOE), including Grid Resilience and Innovation Partnerships (GRIP) and Smart Grid Grants, also affect AMI projects through Build America, Buy America Act (BABA) requirements. DOE issued project-specific non-availability waivers (February 2026) where domestic sourcing constraints exist for certain cellular meters/routers and related components.
Competitive Landscape
The US AMI market features moderate concentration, with a handful of vendors offering integrated suites. Itron, Landis+Gyr, and Honeywell stand out for full-stack solutions that blend devices, communications, and analytics. Each is layering AI modules into edge devices to detect voltage anomalies in real time, positioning analytics as a differentiator. Honeywell’s 5G alliance with Verizon showcases how meter suppliers tap telecom expertise for connectivity scale.
Acquisitions broaden portfolios. Badger Meter bought SmartCover Systems for USD 185 million to add sewer-line monitoring, signalling a push into adjacent infrastructure. ConnectM’s purchase of MHz Invensys deepened RF mesh capabilities for large-scale deployments. Partnerships are equally strategic; Itron’s collaboration with Schneider Electric and Microsoft bundles distributed intelligence with digital-grid software and cloud AI, aiming to raise grid capacity without new conductors.
Regulatory compliance is now a sales qualifier. Vendors advertise NERC-aligned encryption, role-based access, and signed firmware. Utilities prioritize suppliers able to deploy workforce training and managed SOC services that offset internal staffing gaps. Open-standard commitments, such as support for IEEE 2030.5, influence RFP scores. Competitive emphasis on cybersecurity, analytics depth, and service flexibility drives ongoing differentiation inside the US AMI market.
United States Advanced Metering Infrastructure (AMI) Industry Leaders
-
Itron Inc.
-
IBM Corporation
-
Cisco Systems Inc.
-
Mueller Systems LLC
-
Oncor Electric Delivery Company LLC
- *Disclaimer: Major Players sorted in no particular order
Market Opportunities and Future Outlook
Federal grid investment and grant structures are continuing to create whitespace for AMI projects that bundle metering, communications, and software into resilience, monitoring, and automation scopes. The DOE SPARK funding opportunity (released March 12, 2026) makes USD 1.9 billion available for selected projects, with applications due May 20, 2026, supporting advanced transmission and related monitoring upgrades that utilities can pair with AMI-driven visibility, telemetry, and analytics. As utilities build multi-year modernization portfolios, this funding pathway supports vendor offerings that position AMI as part of a broader sensor-to-software architecture rather than a stand-alone meter swap.
Opportunity is also widening around cellular-enabled, multi-commodity AMI and interoperability layers that reduce operational friction across gas and water deployments. In March 2026, Itron expanded its UtilityIQ Application Suite to support Cellular 500G and 500W modules, reinforcing market demand for carrier-backed connectivity and software compatibility across mixed device fleets. Utilities and municipalities also show active procurement appetite for end-to-end AMI platforms through longer-duration, sole-source and platform-support agreements, as reflected in SMUD board materials (April 2026) covering a five-year, USD 40 million AMI-related contract scope with Itron. Proposed data-access frameworks such as New Jersey BPU’s AMI Data Access Standards, along with federal legislative proposals like the E-Access Act of 2026, further highlight growing needs for consent management, standardized sharing, and audit-ready data governance, creating room for AMI software, analytics, and managed services that operationalize secure data exchange.
Recent Industry Developments
- April 2026: Sacramento Municipal Utility District (SMUD) Board reviewed a five-year, $40 million sole-source contract with Itron Networked Solutions for smart meters and AMI platform support (effective May 2026 through April 2031). The action reinforces incumbent AMI deployment and points to early-lock-in with Itron. The development also underscores ongoing vendor consolidation in the US AMI market.
- March 2026: Itron, Inc. Expanded UtilityIQ Application Suite to support Cellular 500G and 500W communication modules for gas and water meters in the United States. The expansion advances cellular-enabled AMI capabilities. It broadens Itron's programmable connectivity edge and analytics scope for multi-utility AMI deployments.
- February 2026: Collier County (Florida) Issued a notice of intent to designate Itron, Inc. as a single-source provider for Fixed Network Software and Itron Total AMI for a contract starting July 10, 2026. The notice solidifies Itron as a sole-source AMI software provider for a Florida county. It also signals tighter vendor alignment and faster deployment.
Research Methodology Framework and Report Scope
Market Definition and Coverage
For this study, the United States advanced metering infrastructure market covers the spending tied to smart metering systems that support two-way meter data collection, communications, and utility back-end processing for billing and operations.
Scope exclusions: We exclude non-AMI utility grid equipment that does not directly support meter data capture, transport, or head-end and MDMS type processing.
Segmentation Overview
- By Component
- Smart Metering Devices (Electricity - Water - Gas)
- Solutions
- Meter Communication Infrastructure
- Software
- Meter Data Management
- Meter Data Analytics
- Services
- By End-User
- Residential
- Commercial
- Industrial
- By Communication Technology
- RF Mesh
- Power Line Carrier (PLC)
- Cellular
- Wi-Fi and Other Communication Technologies
- By Utility Ownership Type
- Investor-Owned Utilities
- Public Power Utilities
- Electric Cooperatives
Data Sources, Market Sizing, and Validation
Desk Research
Desk work was used to set the market frame and anchor the model with public signals that are stable year to year. We referred to US Energy Information Administration (EIA) datasets for electricity customers and consumption context, and US Census Bureau series for macro indicators that influence utility capital plans. We also reviewed Federal Energy Regulatory Commission (FERC) materials and utility filings where available, to understand rate case timing and grid modernization priorities.
To ground the technology and rollout cadence, we checked sources such as the US Department of Energy (smart grid and AMI program materials), public utility commission dockets and orders, and standards and technical references from organizations such as NIST and IEEE. Company annual reports, investor decks, and reputable press releases were used to map contract wins, product mix shifts, and backlog commentary. In addition, we used paid subscriptions for company financial intelligence, news and filings screening, and patent databases to verify innovation areas and timeline claims. This list is not exhaustive, and many other public and paid sources were used for data collection, cross-checking, and clarification.
Primary Interviews and Surveys
Primary work focused on validating what buyers procure in AMI programs and how spend splits across meters, communication layers, and utility software. We spoke with a mix of utility program teams, system integrators, and product and sales leaders across the United States, so gaps from desk research could be filled and assumptions could be stress tested across different service territories. Inputs from these discussions were then used to align adoption timing, replacement cycles, and pricing movement with what buyers and suppliers are reporting in live bids and deployments.
Distribution of primary research fieldwork respondents
| Company type | Respondent position |
|---|---|
| Top tier: 28% | CXOs: 13% |
| Mid tier: 50% | Functional/Unit leaders: 41% |
| Smaller Players: 22% | Managers: 46% |
Market-Sizing & Forecasting
Sizing starts from a top-down build where utility meter populations and rollout progress are translated into an addressable AMI demand pool, then the value is reconstructed using typical system bundles. To keep the math practical, we set unit and project counts first, then apply pricing and services intensity assumptions that are checked through procurement and deployment patterns.
Key inputs used in the model include smart meter shipment and replacement timing, AMI communication mix (RF mesh, cellular, and PLC where relevant), software and integration scope per deployment, utility capital spending outlook tied to grid modernization, and the pace of time-of-use and demand response enablement that often triggers AMI upgrades. Forecasting is run using scenario analysis, because utility approvals and funding timing can shift, and primary feedback helps us set an expected case plus conservative and aggressive adoption paths. Bottom-up approximations are then used selectively, such as sampling typical contract values, validating average selling price movement for meters and endpoints, and doing channel checks on multi-year rollout schedules, before totals are adjusted.
Where a bottom-up view is incomplete, such as smaller municipal deployments with limited disclosure, the gap is handled using penetration based estimates derived from comparable utilities and then normalized with regional rollout signals.
Data Validation & Update Cycle
Outputs are validated through multiple checks so the totals do not rely on a single data point. We compare model results with independent signals, such as disclosed deployment counts, regulatory program milestones, and supplier commentary on backlog and shipment timing, and then investigate any outliers before correcting assumptions.
A second analyst reviews key assumptions, and we re-contact sources when pricing, rollout timing, or component mix appears inconsistent with recent awards and filings. The report is refreshed on an annual cycle, and interim updates are made when material events occur, such as large statewide mandates, major contract resets, or sudden shifts in communication technology choices. Before delivery, a final review pass is completed so clients receive the most current view available.
Mordor Intelligence's United States Advanced Metering Infrastructure Market Size Versus Other Published Estimates
Published market numbers for US advanced metering infrastructure do not always match because groups define AMI differently, and they also choose different timing for when a project is counted as market revenue. Differences also come from how pricing is treated across meters, networks, and software, and whether forecasts assume a smooth spend curve or a lumpy utility approval cycle.
Some external estimates roll AMI into a narrower smart meter hardware only view, and others fold in adjacent smart grid software beyond metering operations. In the Mordor Intelligence model, AMI value is counted only when it is directly tied to meter endpoints, communications, and the utility head-end and meter data management stack, and then verified through rollout schedules and award timing checks.
Benchmark comparison
| Source | Market Size | Gaps in Research Methodology |
|---|---|---|
| Mordor Intelligence | USD 23.23 B (2025) | |
| Regional Consultancy A | USD 6.41 B (2023) | Uses a hardware-led definition that is closer to smart meter devices and endpoints, and it tends to undercount head-end software, integration, and ongoing system services that scale with deployments. |
| Trade Journal B | USD 8.90 B (2026) | Often reflects a conservative project revenue recognition timing, and it may not fully capture multi-utility rollouts where spending is spread across meters, communication upgrades, and deployment services. |
The spread in the table is mainly explained by what is included (full AMI system versus a device-heavy view) and by when project value is recognized across multi-year deployments. By keeping the scope tied to clearly observable rollout drivers and by checking pricing and mix against field feedback, the estimate stays repeatable and easier to reconcile with real procurement activity.
Key Questions Answered in the Report
What is the projected value of the US AMI market in 2031?
The market is expected to reach USD 41.84 billion by 2031.
Which component is growing fastest within the US AMI market?
Software, led by meter data analytics, is expanding at a 13.62% CAGR through 2031.
Which communication technology is gaining share most rapidly?
Cellular connectivity is growing at a 13.78% CAGR thanks to nationwide 5G coverage.
How fast are electric cooperatives increasing AMI spending?
Cooperative investment is advancing at a 14.31% CAGR, the highest among ownership types.
Why are utilities prioritizing cybersecurity in AMI procurements?
FERC mandates for internal network security monitoring require secure, standards-compliant platforms.
What federal program provides direct capital for utility AMI projects?
The Grid Resilience and Innovation Partnerships program allocates billions for smart grid upgrades.