
Market Overview
| Study Period | 2020 - 2031 |
|---|---|
| Forecast Data Period | 2026 - 2031 |
| Base Year Market Size (2025) | USD 5.89 Billion |
| Market Size (2026) | USD 6.81 Billion |
| Market Size (2031) | USD 14.02 Billion |
| Growth Rate (2026 - 2031) | 15.55% CAGR |
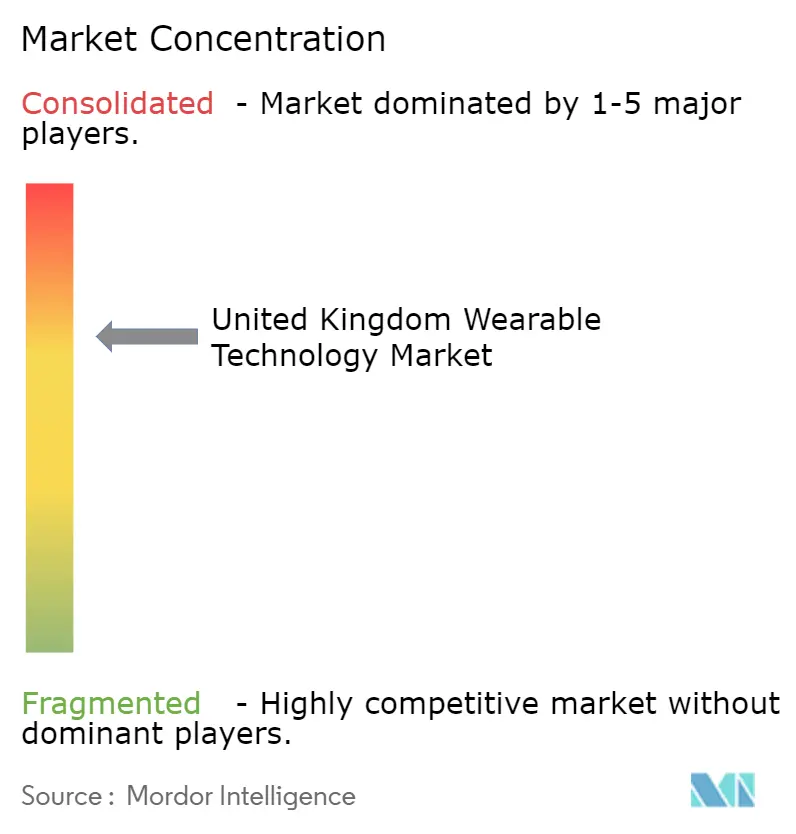
| Market Concentration | Medium |
Major Players *Disclaimer: Major Players sorted in no particular order Image © Mordor Intelligence. Reuse requires attribution under CC BY 4.0. | |
United Kingdom Wearable Technology Market Analysis by Mordor Intelligence
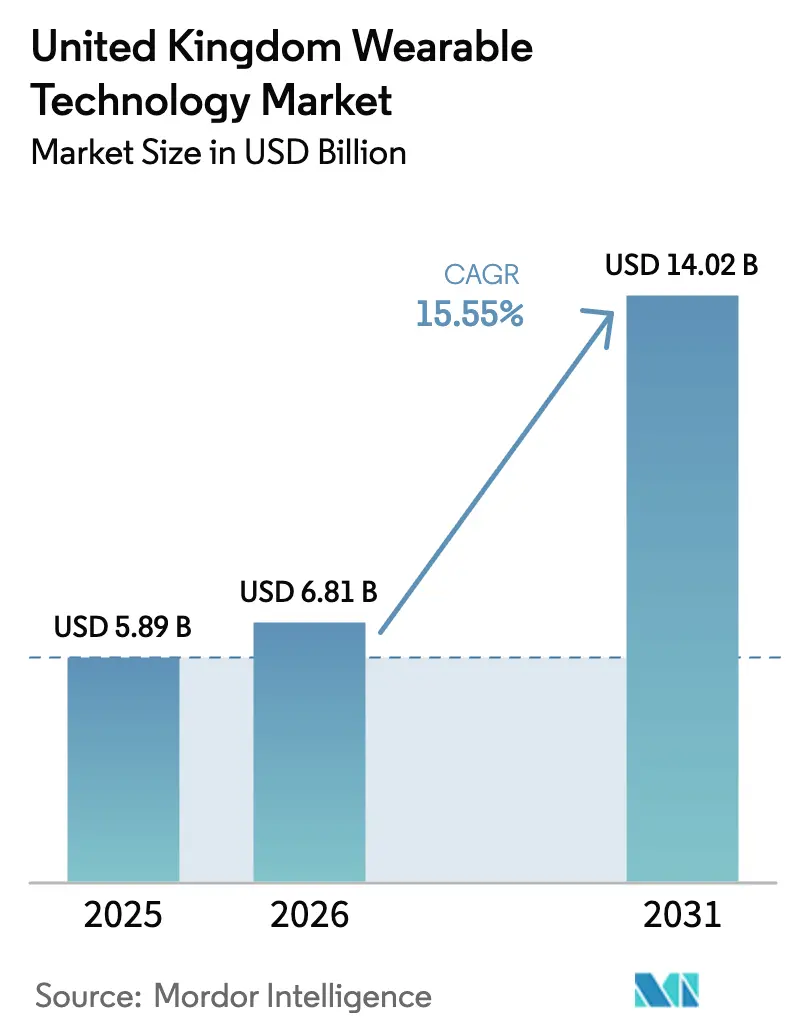
The UK wearable technology market size is expected to grow from USD 5.89 billion in 2025 to USD 6.81 billion in 2026 and is forecast to reach USD 14.02 billion by 2031 at 15.55% CAGR over 2026-2031. Ongoing NHS virtual ward rollouts, rapid 5G coverage expansion, and fintech-linked health-insurance incentives combine to accelerate device demand across England, Scotland, Wales, and Northern Ireland. Smart watches strengthen clinical credibility after Apple secured FDA clearance for hypertension monitoring, while ear-wearables grow fastest as Meta’s Ray-Ban Display and Apple’s biosignal-enabled AirPods push the frontier of discreet sensing. Ultra-Wideband adoption gains pace despite Bluetooth’s dominance, giving manufacturers sub-centimeter indoor positioning that meets emerging hospital asset-tracking and logistics needs. Simultaneously, online direct-to-consumer retail leads distribution, aided by bundled subscription services that deliver continuous software and analytics upgrades. Competitive intensity stays moderate, yet regulatory compliance costs under WEEE battery rules and possible VAT reclassification continue to pressure smaller entrants.
Key Report Takeaways
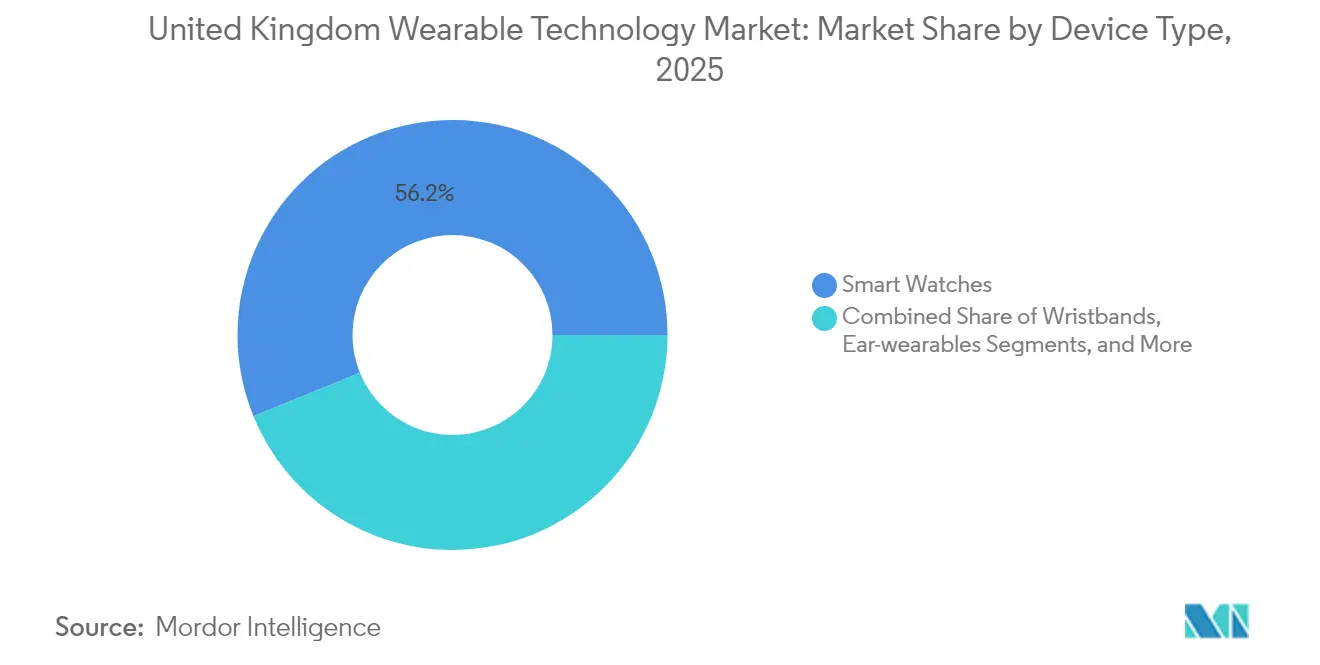
- By device type, smart watches led with 56.16% of UK wearable technology market share in 2025, while ear-wearables advanced at the highest 16.11% CAGR to 2031.
- By connectivity, Bluetooth retained 65.95% share of the UK wearable technology market size in 2025, whereas Ultra-Wideband is expanding at 16.80% CAGR.
- By operating system, watchOS captured 47.52% market share in 2025 and Wear OS is progressing at 15.83% CAGR.
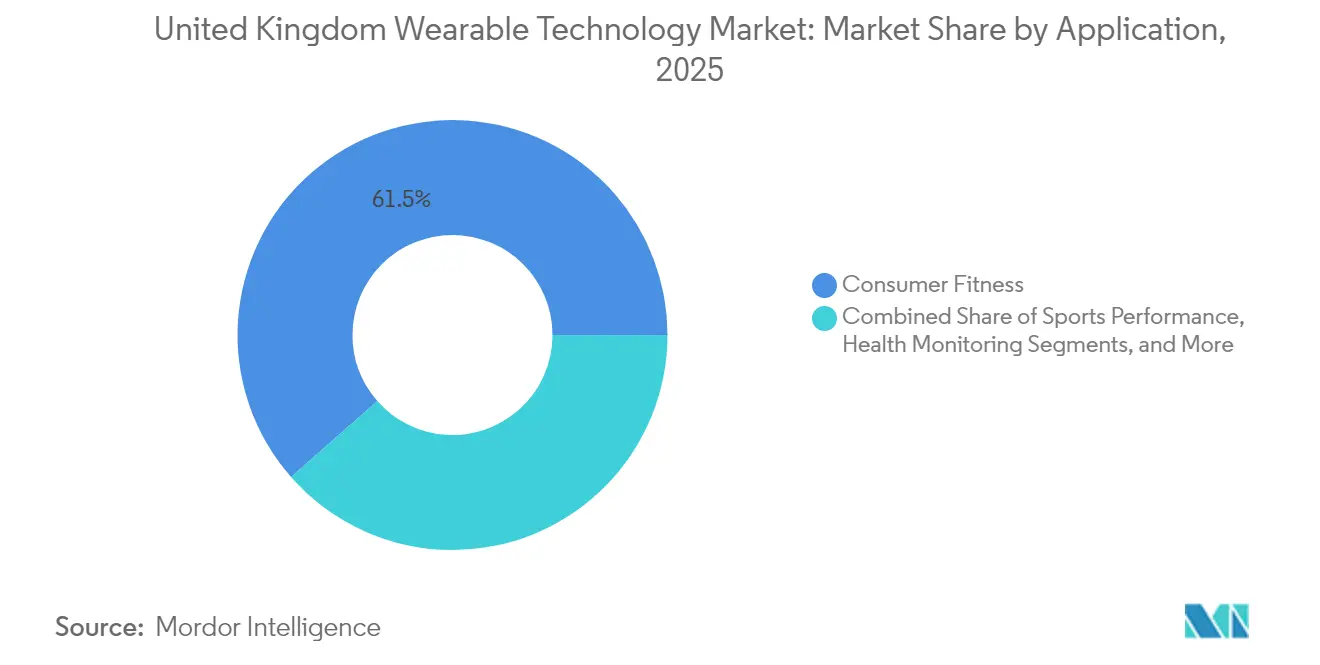
- By application, consumer fitness held 61.48% share of the UK wearable technology market size in 2025 and remote patient monitoring is moving ahead at 16.05% CAGR.
- By geography, England accounted for 83.58% of 2025 revenue, with Wales registering the fastest 15.88% CAGR through 2031.
Note: Market size and forecast figures in this report are generated using Mordor Intelligence’s proprietary estimation framework, updated with the latest available data and insights as of 2026.
United Kingdom Wearable Technology Market Trends and Insights
Drivers Impact Analysis*
| Driver | (~) % Impact on CAGR Forecast | Geographic Relevance | Impact Timeline |
|---|---|---|---|
| Proliferation of NHS Digital Health Initiatives | +2.8% | England, Scotland, Wales, Northern Ireland | Medium term (2-4 years) |
| Integration of Wearables with UK Fintech Ecosystem for Health Insurance Incentives | +2.1% | England core, spillover to Scotland and Wales | Short term (≤ 2 years) |
| Adoption of AI-Powered Predictive Health Analytics in Consumer Wearables | +3.2% | Global with UK early adoption | Long term (≥ 4 years) |
| Rise of Workplace Wellness Regulations in the UK | +1.9% | England, Scotland, Wales, Northern Ireland | Medium term (2-4 years) |
| Expansion of 5G and IoT Infrastructure Across the UK | +2.4% | England, Scotland, Wales, Northern Ireland | Short term (≤ 2 years) |
| Growing Demand for Remote Patient Monitoring in Ageing Population | +3.1% | England, Scotland, Wales, Northern Ireland | Long term (≥ 4 years) |
| Source: Mordor Intelligence | |||
Proliferation of NHS Digital Health Initiatives
Virtual wards supported 4 million UK patients in 2024 and integrated care boards across West Yorkshire, Humber and North Yorkshire, and Cambridge and Peterborough plan broader coverage. Unified procurement frameworks shorten the path from clinical validation to national rollout, so device vendors with MHRA-cleared biosensors receive preferential consideration. Scotland and Wales mirror England’s model, evidencing nation-wide adoption of remote patient monitoring that underpins steady demand for validated wearables. NHS targets prioritize chronic respiratory and cardiovascular programs, aligning with smart-watch blood-pressure and pulse-ox features. Predictive analytics platforms further amplify device utility by translating raw data into actionable care-team alerts.
Integration of Wearables with UK Fintech Ecosystem for Health-Insurance Incentives
Fintech insurers link step counts, heart-rate variability, and sleep scores to dynamic premium discounts, spurring usage across younger, digitally native groups. Open banking standards and FCA oversight ensure secure data exchange between wearable apps and financial dashboards, improving adoption confidence. Employers deploy the same data flows to trigger wellness bonuses that lower group health-cover costs. Device makers benefit from recurring revenue when insurers subsidize hardware in exchange for long-term data access. Cross-platform APIs reduce user friction, reinforcing ecosystem stickiness and keeping churn low.
Adoption of AI-Powered Predictive Health Analytics in Consumer Wearables
Machine-learning models analyze multimodal signals to forecast arrhythmia events, stress spikes, or sleep-apnea risk, transforming devices from passive trackers to preventive companions. Apple’s 2025 software update delivers on-device hypertension prediction while Google’s Fitbit Labs pilots conversational AI that nudges users toward behavioral change.[1]Apple Inc., “Apple introduces groundbreaking health features to support conditions impacting billions of people,” Apple Newsroom, apple.com Research institutions partner with manufacturers to derive digital biomarkers that can replace invasive screening for diabetes or COPD. MHRA’s software-as-a-medical-device pathway provides regulatory clarity, accelerating approvals for AI modules integrated into consumer hardware. Continuous upgrades via cloud APIs extend product life cycles and strengthen subscription economics.
Rise of Workplace Wellness Regulations in the UK
Health and Safety Executive guidance increasingly promotes proactive monitoring of fatigue, ergonomics, and mental well-being. Large employers equip staff with wristbands and smart rings that flag cumulative strain, helping them document compliance and negotiate liability insurance discounts. Aggregate anonymized data informs organizational health benchmarks and resource allocation. Tax relief on qualifying wellness expenditures amplifies corporate uptake, particularly in logistics, construction, and financial services where productivity gains outweigh device outlays. Suppliers that deliver privacy-preserving analytics capture an edge because unions and staff councils demand strict data governance.
Restraints Impact Analysis*
| Restraint | (~) % Impact on CAGR Forecast | Geographic Relevance | Impact Timeline |
|---|---|---|---|
| Stricter UK Data Privacy Enforcement Post-GDPR | -1.8% | England, Scotland, Wales, Northern Ireland | Short term (≤ 2 years) |
| Wearable Device VAT Reclassification Risk | -1.2% | England, Scotland, Wales, Northern Ireland | Medium term (2-4 years) |
| Battery Waste Regulations Increasing Compliance Cost | -0.9% | England, Scotland, Wales, Northern Ireland | Long term (≥ 4 years) |
| Consumer Skepticism on Long-Term Accuracy of Biosensors | -2.1% | Global with UK market impact | Medium term (2-4 years) |
| Source: Mordor Intelligence | |||
Stricter UK Data Privacy Enforcement Post-GDPR
The Information Commissioner’s Office intensifies audits of health-data processors and levies heavy fines for consent mis-steps, so smaller brands divert scarce funds into compliance or retreat from the UK. Mandatory data-protection-impact assessments slow new-feature rollouts, stretching time-to-market. Cross-border transfers to U.S. cloud servers trigger additional contractual safeguards that elevate operating expense. Established vendors capitalize on their mature privacy infrastructures, yet even they redesign user flows to gain granular consent without hurting engagement. Clear privacy victory messages on packaging now influence purchasing almost as strongly as battery life or waterproof ratings.
Consumer Skepticism on Long-Term Accuracy of Biosensors
Independent studies reveal variance in calorie-expenditure and sleep depth accuracy across mainstream wearables, fueling doubt among health-conscious buyers. Disappointment with overstated claims pushes some users to abandon devices within months, eroding retention metrics that underpin subscription revenue. Brands respond by publishing peer-reviewed validation, opening APIs for academic scrutiny, and seeking FDA or MHRA clearances. Nevertheless, high expectations make audiences quick to flag inconsistencies on social channels, so marketing narratives shift toward transparency and explainability rather than perfection.
*Our forecasts treat driver/restraint impacts as directional, not additive. The impact forecasts reflect baseline growth, mix effects, and variable interactions.
Segment Analysis
By Device Type: Smart watches solidify leadership while ear-wearables accelerate
Smart watches accounted for 56.16% of UK wearable technology market share in 2025 and generated the highest revenue as Apple Watch’s hypertension clearance validated clinical utility. Ear-wearables lead growth at 16.11% CAGR, propelled by Meta’s AR audio glasses and Apple’s sensor-rich AirPods that discreetly record EEG and EMG signals.
Demand diversifies into smart rings and textile-embedded smart clothing. Oura doubled 2025 ring shipments, demonstrating appetite for minimalist form factors that deliver continuous monitoring without screen fatigue. Smart clothing pilots in elder-care homes record fall risk and hydration data through washable fibers, pointing to future convergence between fashion, medical monitoring, and ESG-compliant materials.


By Connectivity Technology: Bluetooth dominance meets Ultra-Wideband precision
Bluetooth covered 65.95% of connections in 2025, but Ultra-Wideband adoption is rising 16.80% annually as hospitals and warehouses seek centimeter-level indoor location. 5G modems appear in cellular wristbands targeted at high-risk patients who require uninterrupted remote patient monitoring.
Mesh networking firmware lets smart rings relay data to a watch, then to a phone, cutting power draw while maintaining real-time transmission. Ofcom spectrum allocations guarantee coexistence, and device makers design dual-radio chipsets that switch automatically based on bandwidth needs and battery status.
By Operating System: watchOS retains lead yet Wear OS narrows the gap
watchOS commanded 47.52% share in 2025 because of Apple’s tight hardware-software integration and NHS pilot deployments. Wear OS is growing 15.83% CAGR after Masimo and Google launched a reference platform bundling validated pulse-ox and ECG sensors.
Linux-based systems find traction where open-source customization is critical, like industrial safety helmets that combine gas sensing and head-impact detection. Samsung’s cross-platform Galaxy Ring strategy underscores a broader pivot toward ecosystem-agnostic accessories that reduce switching friction for non-iPhone users.
By Application: Fitness still dominates but healthcare monitoring gains momentum
Consumer fitness applications delivered 61.48% revenue in 2025, reinforced by pandemic-era exercise habits. The NHS virtual ward roadmap accelerates remote patient monitoring at a 16.05% CAGR, directly lifting demand for clinically validated sensors that transmit vitals into electronic patient records.
Corporate wellness programs integrate stress and posture analytics to comply with HSE guidelines and curb absenteeism. Sports performance analytics filter down from elite clubs to amateur leagues through subscription-based dashboards. Meanwhile, pregnancy-outcome studies from Garmin illustrate how large-scale consumer datasets now inform clinical research with minimal incremental cost.
By Distribution Channel: Online retail preserves the edge
Online platforms captured 57.86% revenue in 2025 and continue at 15.62% CAGR as brands exploit shoppable livestreams and AI chatbots to personalize bundles. Direct webstores pair devices with cloud analytics subscriptions, boosting lifetime value and shielding margins from retailer fees.
Brick-and-mortar consumer electronics chains remain relevant for high-ticket AR glasses where in-person demos clarify value. Pharmacies add clinically approved watches next to blood-pressure cuffs, aligning with their expanding frontline-care responsibilities. Insurance-sponsored distribution gains ground, with underwriters offering subsidized rings or bands in exchange for health-data sharing consent.
Geography Analysis
England contributed 83.58% of 2025 revenue in the UK wearable technology market after NHS England prioritized virtual wards across integrated care systems. London’s role as a fintech hub accelerates insurer-wearable tie-ins that scale nationally through digital channels. Continuous 5G coverage by the four major operators underpins low-latency remote monitoring and AR use cases in hospitals and logistics centers.
Wales posts the fastest 15.88% CAGR because targeted 5G grants modernize connectivity in rural zones and the Welsh government funds digital health pilots for aging-in-place services. University-led incubators in Cardiff and Swansea supply local start-ups that adapt wearables for bilingual interfaces and region-specific public-health programs.
Scotland maintains stable uptake through NHS Scotland’s COPD and heart-failure remote monitoring, while Northern Ireland benefits from cross-border EU regulatory alignment and shared clinical trials. Regional procurement frameworks emphasize interoperability so vendors must support shared FHIR data standards regardless of deployment area.
Regulatory Landscape
Wearables that make medical claims in Great Britain fall under the UK Medical Devices Regulations 2002 (as amended) and require UKCA marking, with the transition framework running through 30 June 2030. The MHRA also moved the regulatory roadmap forward by publishing draft Medical Devices (Amendment) Regulations 2026 on 8 May 2026. This adds an international reliance pathway and uses a more risk-proportionate approach, which affects how sensor features and software updates are classified and brought to market.
For NHS-facing deployments, procurement and rollout are shaped by the Digital Technology Assessment Criteria (DTAC) V2.0 (updated February 2026). It tightens requirements around clinical safety, interoperability, and data governance for digital health tools used in NHS services, including alignment with ISO 11073 personal health data standards. Cybersecurity obligations for connectable products are further reinforced through the Product Security and Telecommunications Infrastructure security requirements regulations (amended in 2025), increasing the compliance load for Bluetooth, Wi-Fi, and cellular-connected wearable categories sold into the UK.
Value Chain Analysis
The UK wearable technology value chain begins with global component sourcing (sensor modules, batteries, and connectivity chipsets) and continues through device design, assembly, and UK retail and enterprise distribution. After-sales software services and analytics subscriptions add to lifetime value over time. The UK Semiconductor Sectoral Analysis (2026) highlights a national emphasis on low-power architectures, packaging, and integration, which matches wearables design priorities around battery life and always-on sensing.
Downstream, NHS adoption routes shape the service layer. DTAC-gated procurement requires evidence packages such as clinical safety cases (DCB 0129) and data protection impact assessments (DPIA) before wearables can integrate into NHS pathways. Data hosting, integration, and analytics are increasingly central, supported by NHS efforts to build scalable health data infrastructure, including the Health Data Research Service. Distribution also skews toward online direct-to-consumer and insurer- or employer-sponsored channels that bundle devices with ongoing software and coaching services.
Competitive Landscape
Market concentration is moderate, with Apple, Samsung, and Fitbit controlling mainstream channels, while Oura, Garmin, and Polar specialize in rings and sports wearables. Dexcom invested USD 75 million in Oura to merge continuous glucose data with ring-based sleep and readiness scores, creating a holistic metabolic platform.[4]Dexcom Inc., “Strategic investment in Oura,” dexcom.com Apple’s hypertension clearance elevates clinical stakes, pressing rivals to secure similar approvals.
Component suppliers such as TDK entered the hardware stack by acquiring SoftEye to gain AR optics technology and deepen value-chain control.[5]TDK Corporation, “Acquisition of SoftEye,” tdk.com AI start-ups provide algorithms that device vendors license to speed time-to-market for new sensing modalities. The cost of MHRA certifications and WEEE compliance triggers partnership models where smaller innovators license IP to larger firms rather than pursue full product launches.
White-space opportunities persist in mental health and occupational safety. XPANCEO’s smart-contact-lens prototypes reveal potential to bypass form-factor constraints for in-eye glucose sensing. Venture and corporate investors channel funds toward battery chemistry breakthroughs and flexible electronics that promise multi-day wear without trade-offs in comfort or accuracy.
United Kingdom Wearable Technology Industry Leaders
Huawei Technologies Co., Ltd.
Samsung Electronics Co. Ltd.
Fitbit LLC
Xiaomi Inc.
Apple Inc.
- *Disclaimer: Major Players sorted in no particular order

Market Opportunities and Future Outlook
NHS digital transformation offers a clear route to scale for clinically validated wearables that fit into NHS data and assessment processes. The UK government has allocated up to GBP 10 billion for technology and digital transformation in the NHS. Alongside the Single Patient Record and the plan for the NHS App to become a primary access point for NHS services by 2028, these initiatives increase demand for wearables that can satisfy DTAC requirements and work within standardized procurement and interoperability expectations.
A second opportunity area is the regulated reimbursement and assessment pathway for digital tools. NICE expanding its technology appraisal coverage to include wearables and digital tools, with mandated NHS funding for approved technologies, raises the commercial value of clinical-grade evidence generation and post-market performance monitoring. On the supply side, the UK Semiconductor Sectoral Analysis (2026) points to whitespace around low-power architectures and related strategic transactions, supporting differentiation for vendors and UK-based partners focused on power management, integration, and AI-on-device features that reduce cloud dependence while meeting tightening product security expectations for connectable devices.
Recent Industry Developments
- July 2026: Ceretone official UK launch of ready-to-wear hearing aids following changes in UK legislation enabling direct-to-consumer purchases. The regulatory-enabled DTC hearing aids market entry broadens consumer access and expands device categories in the UK wearables ecosystem. This improves accessibility for patients and complements existing health wearables in the market.
- June 2026: Huawei expanded health and fitness ecosystem for HUAWEI WATCH FIT 5 Series in the UK. The ecosystem expansion strengthens health tracking capabilities and cross-device data integration across the UK wearables landscape. It also increases capacity addition in a way that supports Huawei's position in clinical-grade and health-tracking wearables in the UK market.
- May 2026: Huawei launched HUAWEI WATCH FIT 5 Series in the UK with Curve Pay integration. The product launch adds fintech-enabled payments to wearables and improves consumer convenience for UK users. The Curve Pay integration deepens wearable-to-payment functionality and supports wallet-enabled usage across the UK.


Research Methodology Framework and Report Scope
Market Definition and Coverage
For this report, the market covers revenue generated in the United Kingdom from wearable technology devices and the related device sales value, counted at the point of sale into end users through retail and enterprise procurement.
Scope exclusions: We exclude smartphones and tablets, and we also exclude pure software-only subscriptions that are sold without a wearable device.
Segmentation Overview
- By Device Type
- Smart Watches
- Head-mounted Displays
- Wristbands
- Ear-wearables
- Smart Clothing
- Smart Rings
- Other Device Types
- By Connectivity Technology
- Bluetooth
- Wi-Fi
- Cellular
- NFC
- Ultra-Wideband
- 5G
- Other Connectivity Technologies
- By Operating System
- watchOS
- Wear OS
- Proprietary OS
- RTOS
- Linux
- Other Operating Systems
- By Application
- Consumer Fitness
- Healthcare Monitoring
- Remote Patient Monitoring
- Corporate Wellness
- Sports Performance
- Medical Diagnostics
- Other Applications
- By Distribution Channel
- Online Retail
- Offline Consumer Electronics
- Specialist Health Stores
- Pharmacies
- Department Stores
- Other Distribution Channels
- By Geography
- England
- Scotland
- Wales
- Northern Ireland
Data Sources, Market Sizing, and Validation
Desk Research
Desk research starts by setting clear boundaries around what gets counted as a wearable device in the United Kingdom, then mapping demand and supply signals to that boundary. We rely on public sources to ground the model in adoption and shipment activity, such as the Office for National Statistics for household spending context, HM Revenue and Customs trade statistics for import and export flows, Ofcom releases for connectivity and device usage indicators, and NHS England publications for remote monitoring and virtual ward direction.
To convert those signals into a value model, we also review manufacturer and retailer statements through annual reports, investor presentations, and earnings commentary, which often describe pricing, product refresh cycles, and channel mix changes. Patent databases are used selectively to understand sensing and connectivity direction, and an import and export shipment-level database is used where it helps reconcile unit movement with trade codes that commonly map to wearables and accessories. This list of desk research sources is not exhaustive, and many other public and paid references were used for data collection, validation, and clarification checks.
Primary Interviews and Surveys
Primary work was used to pressure-test adoption assumptions and pricing ranges across key wearable categories, and to clarify how sales split across online, electronics retail, carrier-led bundles, and health-related procurement. We spoke with a mix of device value chain participants, channel stakeholders, and enterprise buyers, and we included viewpoints across England, Scotland, Wales, and Northern Ireland so the model reflects differences in rollout pace and purchasing behavior.
Distribution of primary research fieldwork respondents
| Company type | Respondent position | Region |
|---|---|---|
| Top tier: 29% | CXOs: 12% | |
| Mid tier: 55% | Functional/Unit leaders: 30% | |
| Smaller Players: 16% | Managers: 58% |
Market-Sizing & Forecasting
Sizing is built using a top-down and bottom-up approach, where the main structure starts from the United Kingdom demand pool and then gets reconstructed using device penetration, replacement behavior, and category mix across wearables. In practice, we use adoption indicators and trade movement as starting anchors, then translate unit expectations into value using category-level average selling prices that reflect model mix and channel dynamics.
A few inputs that matter in this market include smartwatch and band replacement cycles, share shifts toward hearables and fitness-focused devices, connectivity choices that influence attach rates (Bluetooth, cellular, and Wi-Fi), and the split between consumer purchases and health-related programs that influence volumes and acceptable pricing. Channel mix also matters because online promotions and carrier bundles can move realized price away from list prices, which we correct using primary pricing checks. Results are corroborated with selective bottom-up approximations, such as sampled ASP times units by category and channel checks, followed by supplier and distributor sanity checks where disclosure is limited.
For forecasting, we rely mainly on scenario analysis, since category mix shifts and pricing can change quickly after new product launches and regulatory or reimbursement changes. The forward view is guided by expected replacement waves, connectivity coverage direction, health monitoring demand, and expert consensus on pricing progression, then stress-tested across conservative and optimistic adoption cases.
Data Validation & Update Cycle
Validation is done through several pass-through checks so the final totals do not rely on one data series. Model outputs are compared against independent indicators such as trade trends, channel commentary, and adoption signals, and then variances are reviewed to understand whether the issue comes from scope, price, or units. If a mismatch remains large after internal review, the assumption is revisited and respondents may be re-contacted to confirm what changed and why.
Before sign-off, another analyst reviews key inputs, calculations, and year-to-year movements, which helps catch unit conversion issues and unrealistic pricing jumps. Reports are refreshed annually, and interim updates are triggered when a material event affects demand or pricing, such as a major device refresh, policy change, or a notable shift in channel promotions. Right before delivery, a fresh pass is completed so clients receive the latest updated view rather than an older snapshot.
Mordor Intelligence's United Kingdom Wearable Technology Market Size Compared Against Other Published Estimates
Published market sizes for UK wearables can look far apart because the boundary is not always the same, and the value point can also change, such as retail selling price versus factory-level revenue. Differences also come from how each source treats accessories, services, and whether enterprise health deployments are counted as device revenue or left out.
Import and export movement signals, category-level price ranges from channel checks, and replacement cycle validation through interviews are the checks that keep Mordor Intelligence's estimate tied to device sales value in the United Kingdom rather than broader consumer electronics revenue.
Benchmark comparison
| Source | Market Size | Gaps in Research Methodology |
|---|---|---|
| Mordor Intelligence | USD 5.89 B (2025) | |
| Trade Journal A | USD 7.10 B (2025) | This estimate appears to include paid companion services and extended warranty revenue inside the wearable total, and it also applies higher blended selling prices based on premium smartwatch mix assumptions. |
| Industry Association B | USD 4.80 B (2025) | This estimate seems to focus on consumer retail sell-through only, thereby excluding a portion of enterprise and health program device procurement and undercounting categories sold via carrier bundles. |
The spread across figures is mainly explained by what is counted around the device, and by how prices are translated from channel behavior into a single value number. By keeping the scope limited to wearable device sales value and then cross-checking units and pricing with independent signals, the model stays repeatable and easier to reconcile year to year.


Key Questions Answered in the Report
How much revenue will the UK wearable technology sector generate by 2031?
The segment is forecast to reach USD 14.02 billion in 2031, up from USD 6.81 billion in 2026.
Which device type is expanding at the quickest pace across the country?
Ear-wearables are advancing at a 16.11% CAGR, the highest among all product categories.
In what ways are NHS virtual wards shaping demand for connected devices?
The virtual-ward model relies on continuous remote monitoring, so hospitals are procuring clinically validated smart watches and rings that stream real-time vitals into electronic patient records, accelerating adoption in both acute and chronic-care pathways.
What benefits does Ultra-Wideband deliver to future UK wearables?
Ultra-Wideband offers centimeter-level indoor positioning that supports asset tracking in hospitals, hands-free device unlocking, and precise proximity alerts, driving a 16.80% CAGR for this connectivity option.
Why do UK data-privacy rules present a hurdle for smaller wearable vendors?
Post-GDPR enforcement demands strict consent workflows, regular audits, and secure cross-border data transfers, adding compliance costs that weigh more heavily on resource-constrained start-ups than on established brands with mature privacy infrastructures.
Which UK region is recording the fastest growth in wearable adoption?
Wales leads regional expansion with a 15.88% CAGR, supported by targeted digital-health funding and nationwide 5G rollout initiatives.
Page last updated on:






