Market Overview
| Study Period | 2020 - 2030 |
|---|---|
| Base Year For Estimation | 2024 |
| Forecast Data Period | 2025 - 2030 |
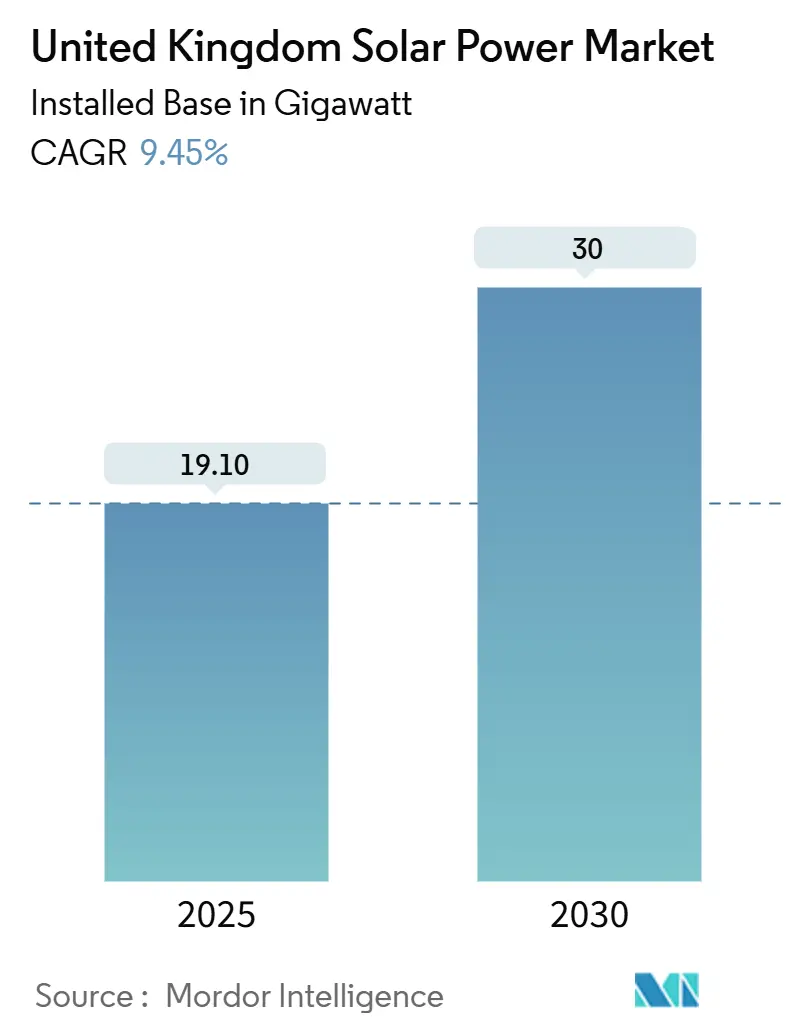
| Market Volume (2025) | 19.10 gigawatt |
| Market Volume (2030) | 30 gigawatt |
| Growth Rate (2025 - 2030) | 9.45% CAGR |
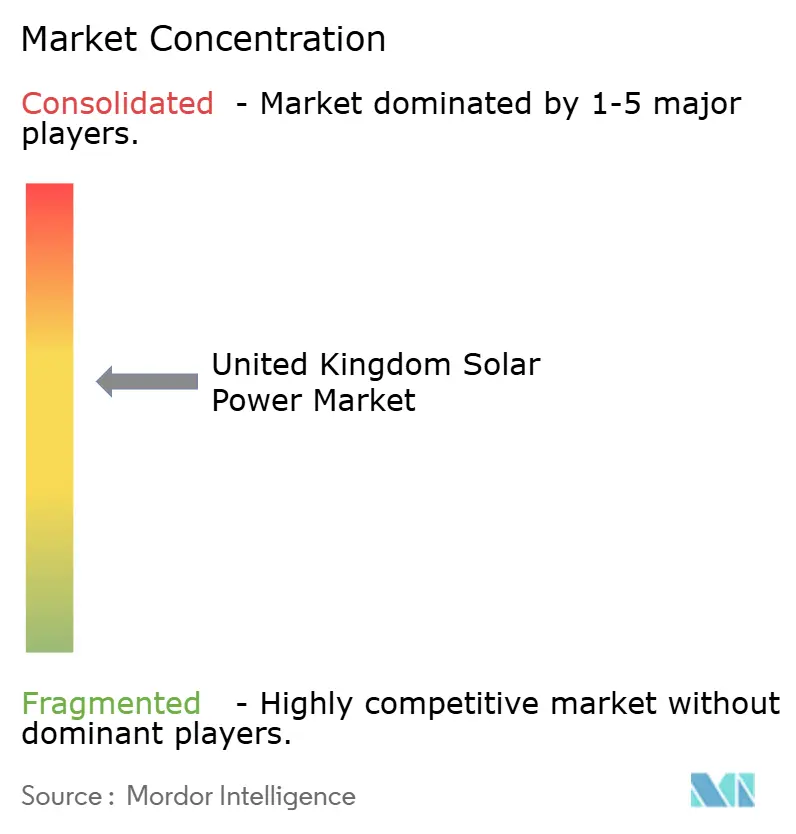
| Market Concentration | Medium |
Major Players
*Disclaimer: Major Players sorted in no particular order Image © Mordor Intelligence. Reuse requires attribution under CC BY 4.0. |
|
United Kingdom Solar Power Market Analysis by Mordor Intelligence
The United Kingdom Solar Power Market size in terms of installed base is expected to grow from 19.10 gigawatt in 2025 to 30 gigawatt by 2030, at a CAGR of 9.45% during the forecast period (2025-2030).
This outlook places the current United Kingdom solar power market size and projected expansion in a clear context, underscoring the sector’s momentum as a mainstream power source that no longer relies on subsidies to compete. Momentum stems from grid-parity module pricing, faster grid connection reform, and rising corporate demand for certified renewable energy supply. Additional drivers include rooftop mandates in new housing, the rapid uptake of battery-coupled projects that unlock stacked revenues, and policy incentives for domestic component manufacturing. Persistent headwinds persist: planning friction on high-grade farmland, long queue times in the northern part of the country, and volatile Contracts-for-Difference (CfD) clearing prices that complicate financing for smaller projects. Market participants able to secure land, grid access, and diversified income streams are expected to outperform as the UK advances toward its Clean Power 2030 solar targets.
Key Report Takeaways
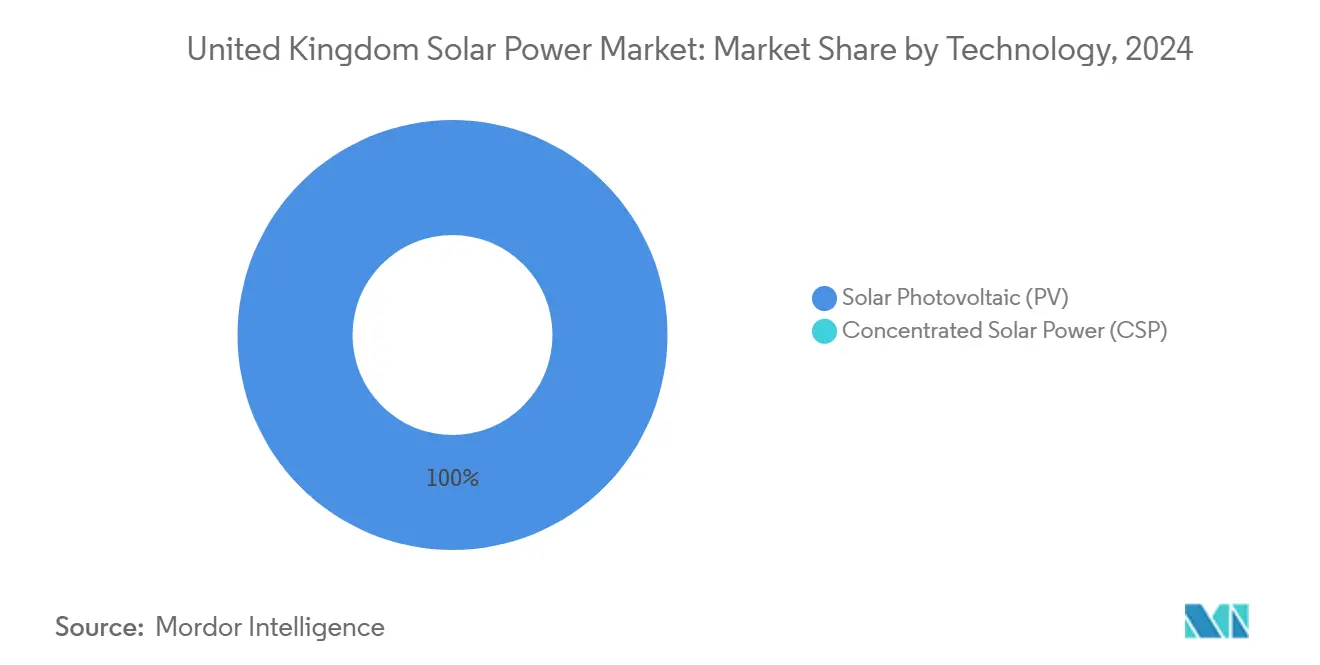
- By technology, photovoltaic modules maintained 100% of the United Kingdom solar power market share in 2024; monocrystalline products drive a 9.5% segment CAGR through 2030.
- By grid type, on-grid assets accounted for 97.5% of the United Kingdom solar power market size in 2024; off-grid systems are projected to grow at a 15.6% CAGR between 2025 and 2030.
- By end user, utility-scale plants captured 73.8% of the United Kingdom solar power market size in 2024, whereas residential installations are expected to grow at a 20.9% CAGR through 2030.
United Kingdom Solar Power Market Trends and Insights
Drivers Impact Analysis
| Driver | (~) % Impact on CAGR Forecast | Geographic Relevance | Impact Timeline |
|---|---|---|---|
| Renewable Energy Obligation Certificates (ROCs) Extension Spurs Corporate PPAs | 1.2% | England and Wales, with spillover to Scotland | Medium term (2-4 years) |
| Grid-Parity Achievement in Utility-scale Projects Accelerating Merchant Solar | 1.8% | National, with concentration in Southern England | Short term (≤ 2 years) |
| National Grid's ESO Reform Favouring Distributed Solar Participation | 1.1% | National, with emphasis on grid-constrained regions | Medium term (2-4 years) |
| Rising Demand for Agri-PV to Decarbonise UK Farming Sector | 0.9% | Rural England, particularly East Midlands and East Anglia | Medium term (2-4 years) |
| Battery-Coupled Solar Economics Enhanced by Ofgem's Flexible Connection Code | 1.5% | National, with emphasis on Scotland and Northern England | Short term (≤ 2 years) |
| OEM Supply-Chain Localisation Incentives Under UK Net-Zero Strategy | 0.8% | National, with concentration in industrial regions | Long term (≥ 4 years) |
| Source: Mordor Intelligence | |||
Renewable Energy Obligation Certificates Extension Spurs Corporate PPAs
The ROC buy-out price mechanism provides generators with fixed-price certificates until accreditation ends, offering corporates a lower-cost route to decarbonize electricity procurement compared to penalty payments. Large retailers now contract multi-hundred-megawatt solar parks under fixed-price or collar-price power purchase agreements, with creditworthy offtakers replacing subsidies as the main revenue anchor.[1]Ofgem, “Renewables Obligation Annual Report 2023-24,” ofgem.gov.uk
Grid-Parity Achievement Transforms Utility-Scale Solar
Solar levelised costs now track or sit below traded power prices, enabling projects to clear financing without CfD guarantees. National Grid ESO’s GBP 58 billion “Networks Beyond 2030” plan reserves new capacity for merchant renewables, reflecting market confidence in the deployment of subsidy-free energy.
National Grid ESO Reform Favouring Distributed Solar
The shift to a “first-ready, first-connected” queue screens out speculative applications and prioritises projects with land control and planning consent. This rule is expected to halve the existing backlog and accelerate energization for rooftop and community-scale developers who can satisfy readiness tests.[2]National Grid ESO, “Networks Beyond 2030,” nationalgrideso.com
Battery-Coupled Solar Economics Enhanced by Flexible Connection Code
Separate metering now lets co-located batteries qualify for ROC or REGO benefits while earning balancing-service income during non-generation windows. Storage also mitigates curtailment in constrained zones, unlocking projects that were previously considered stranded.
Restraints Impact Analysis
| Restraint | (~) % Impact on CAGR Forecast | Geographic Relevance | Impact Timeline |
|---|---|---|---|
| Land-Use Planning Constraints in England's National Planning Policy Framework | -0.7% | England, particularly agricultural regions | Medium term (2-4 years) |
| Import Dependency Risk from Xinjiang Silicon Module Supply Chain | -0.5% | National | Short term (≤ 2 years) |
| Grid Congestion & Long Queue Times for Connections in Northern England | -1.0% | Northern England and Scotland | Medium term (2-4 years) |
| Volatile CFD Strike Prices Limiting Small-scale Project Bankability | -0.6% | National | Short term (≤ 2 years) |
| Source: Mordor Intelligence | |||
Land-Use Planning Constraints Challenge Expansion
The National Planning Policy Framework directs local planners to preserve prime farmland, leading to protracted hearings for multi-hundred-acre arrays. Between 2018 and 2023, fewer than 20% of large solar applications were successful on their first submission, resulting in additional months of legal and consultation costs for each megawatt delivered.[3]Parliament UK, “Debate: Solar Farms,” parallelparliament.co.uk
Grid Congestion Creates Northern Bottlenecks
By late 2024, generation projects awaiting connection reached 176 GW, with 20% facing waits longer than ten years. Ofgem-approved reforms will enable National Grid ESO to remove dormant queue positions and release capacity; however, new 400 kV circuits must be implemented to sustain the northern build-out.
Segment Analysis
By Technology: Photovoltaic Dominance Continues
Photovoltaic systems accounted for the entire commercial deployment base in 2024, confirming their fit for the UK’s diffuse irradiance. Monocrystalline modules sustained 20-23% panel efficiency and now anchor most ground-mounted bids. The UK solar power market size for PV technology is expected to expand in line with the overall 9.45% CAGR as next-generation n-type TOPCon and heterojunction lines push conversion rates beyond 24.5%. Emerging perovskite-silicon tandem cells have achieved a laboratory efficiency of 28.6%, but field banks will require certification and bankability validation before entering mainstream procurement.[4]VDE, “Perovskite PV Bankability,” vde.com
Polycrystalline options remain useful for cost-sensitive rural or community arrays, although their share is eroding each year. The absence of concentrated solar power reflects the UK climate’s low direct-normal irradiation and limited contiguous, South-facing land, reinforcing PV’s unchallenged position. As module ASPs fall, performance-per-acre considerations increasingly trump initial capex, sustaining demand for higher-efficiency formats across both utility and rooftop schemes.
Note: Segment shares of all individual segments available upon report purchase
Get Detailed Market Forecasts at the Most Granular Levels
Download PDF
By Grid Type: On-Grid Dominance With Rising Hybrid Use
On-grid assets accounted for 97.5% of installations in 2024, primarily due to the reliability of their infrastructure and the availability of export payments under the Smart Export Guarantee. The segment continues to capture bulk capacity through easy access to wholesale markets and eligibility for ancillary services. Off-grid systems, although a niche, are growing at a 15.6% CAGR as farms, telecom sites, and remote estates opt for solar-plus-storage solutions rather than costly network extensions. Hybrid systems that operate grid-tied in normal conditions yet island during outages provide resilience for critical facilities such as data centers.
Battery costs trending below USD 120/kWh enable four-, six-, and even eight-hour packs, giving off-grid customers near-round-the-clock autonomy. The hybrid architecture also appeals to commercial property owners who are pursuing security of supply alongside energy cost certainty.
By End User: Utility Strength Meets Residential Acceleration
Large utility-scale stations supplied 73.8% of capacity in 2024, leveraging economies of scale and single-axis tracking to lower costs. Projects such as the 350 MW Mallard Pass and the 500 MW Heckington Fen illustrate investor appetite for multi-hundred-megawatt parks in areas with spare 132 kV lines. Top developers are increasingly incorporating 2-hour batteries sized at 15-30% of PV nameplate capacity to capture evening price spikes.
Residential systems are expanding at the fastest rate, with a 20.9% CAGR, as energy bill inflation, zero-VAT rooftop incentives, and mandatory solar installations in new dwellings converge. More than 40% of new houses in England now include solar panels at the build stage, with average array sizes edging above 4 kW. Small system owners receive SEG payments and benefit from smart meter-driven time-of-use tariffs, thereby boosting their return on investment.
The commercial and industrial bracket benefits from planning exemptions for rooftop builds under 1 MW. Retail chains and warehouses mount 2-15 MW arrays paired with behind-the-meter storage to manage demand charges and power EV fleet charging points.

Note: Segment shares of all individual segments available upon report purchase
Get Detailed Market Forecasts at the Most Granular Levels
Download PDF
Geography Analysis
England dominates the UK solar power market, accounting for the majority of the country's ground-mounted capacity. Southern counties record isolation above 1,100 kWh/kWp, enabling attractive merchant bids. The South West leads in household penetration, while the South East tops installed megawatts thanks to vast greenfield availability and proximity to 132 kV substations. Regional planning authorities in Kent and Lincolnshire exhibit mixed stances: Kent approved the 350 MW Mallard Pass project, whereas Lincolnshire highlighted concerns about farmland protection that delayed similar proposals.
Northern England and parts of Scotland are experiencing grid-capacity shortfalls, with queue times exceeding 2033 for some applicants. National Grid's Eastern Green Link II high-voltage direct-current line, scheduled for completion in 2031, will introduce north-south transfer capability, reducing curtailment risk and enabling new sites along the corridor. Scotland targets 6 GW by 2030, leveraging relaxed development rights for rooftop installations and countryside hospitality assets, as well as installing off-grid clusters.
Wales and Northern Ireland account for smaller portions of the UK's solar power market, but they play strategic roles in the sector. Wales supports community-owned arrays to retain energy revenues locally; Northern Ireland's separate transmission operator drafts connection code updates that align with NESO reforms, positioning the region for faster residential uptake once policy alignment is complete.
Across the UK, agri-PV deployment tends to focus on flat rural regions, such as East Anglia, where dual land-use schemes help reconcile energy and crop output goals. Floating solar tests at utility reservoirs in Cumbria and Greater London utilize otherwise underutilized footprints, contributing incremental gigawatt-hour generation without requiring land conversion.
Competitive Landscape
The top five developers and asset owners control an estimated 45% of built capacity plus late-stage pipelines, indicating a moderately concentrated field. BP’s purchase of Lightsource’s remaining equity marks a shift toward full ownership of solar origination, engineering, and operations.[5]PV Tech, “bp Completes Acquisition of Lightsource bp,” pv-tech.org RWE’s acquisition of JBM Solar adds more than 6 GW of projects, vaulting the group into the top tier. Institutional investors such as Schroders Greencoat expand portfolios via secondary-market acquisitions, targeting operating plants with long-term PPAs.
Competition now centers on capabilities in hybrid system design, land acquisition, and grid-offer negotiation. Large incumbents leverage their balance-sheet strength to lodge connection deposits before queue reforms take effect, while smaller developers focus on rooftop portfolios that require less upfront capital. Vertical integration deepens: module makers partner with UK EPC firms to bundle supply, operations, and maintenance (O&M), as well as performance guarantees, thereby derisking merchant cash flows.
Innovation niches draw emerging players. Agri-PV specialists supply elevated racking that meets tractor clearance, while storage-first developers co-locate four-hour batteries to harvest ancillary-service value. Component localisation incentives attract inverter manufacturers scouting northern industrial parks for assembly lines that satisfy domestic content rules.
Overall, the UK solar power market balances scale advantages with space for nimble entrants offering differentiated siting, technology, or community-ownership models.
United Kingdom Solar Power Industry Leaders
-
Lightsource bp Renewable Energy Investments Ltd
-
EDF Renewables UK (Electricité de France SA)
-
Octopus Energy Generation
-
Foresight Solar Fund Ltd
-
ScottishPower Renewables (Iberdrola SA)
- *Disclaimer: Major Players sorted in no particular order
Need More Details on Market Players and Competitors?
Download PDF
Recent Industry Developments
- May 2025: Ofgem-approved reforms aim to cut grid-connection delays and unlock GBP 40 billion per year for network upgrades.
- April 2025: The UK rooftop segment logged its strongest first quarter since 2012, posting new monthly generation records.
- April 2025: Solar Energy UK reported that the sector added GBP 1.9 billion to GVA and created 20,000 jobs in 2024, forecasting GBP 5 billion and 43,000 roles by 2035.
- March 2025: AlphaReal purchased five solar parks for £160 million, signaling an ongoing institutional appetite for operational assets.
- February 2025: Quinbrook secured the 350 MW Mallard Pass project, one of the country’s largest planned arrays.
Research Methodology Framework and Report Scope
Market Definitions and Key Coverage
Our study treats the United Kingdom solar power market as the total on-grid and off-grid photovoltaic capacity physically installed within UK borders, spanning crystalline-silicon, thin-film, and emerging tandem modules that feed residential, commercial-industrial, and utility demand pools. Energy generated solely for on-site thermal applications or offshore floating wind-solar hybrids is outside this boundary, keeping the lens fixed on PV electricity.
Scope exclusion: Concentrated solar power projects and component export sales are intentionally left out.
Segmentation Overview
- By Technology
- Solar Photovoltaic (PV)
- Concentrated Solar Power (CSP)
- By Grid Type
- On-Grid
- Off-Grid
- By End User
- Utility-Scale
- Commercial and Industrial (C&I)
- Residential
- By Component (Qualitative Analysis)
- Solar Modules/Panels
- Inverters (String, Central, Micro)
- Mounting and Tracking Systems
- Balance-of-System and Electricals
- Energy Storage and Hybrid Integration
Detailed Research Methodology and Data Validation
Primary Research
Mordor analysts interviewed EPC contractors, inverter suppliers, asset managers, and distribution network operators across England, Scotland, and Wales. These conversations validated installed-cost ranges, curtailment penalties, and realistic build-out rates, then challenged early desk assumptions on battery-coupled uptake.
Desk Research
We began with publicly available energy statistics issued by the Department for Energy Security & Net Zero, National Grid's Future Energy Scenarios, and deployment registers maintained by Ofgem, which provide granular commissioning dates and accredited system sizes. Complementary insights flowed from IRENA's Renewable Capacity Database and trade-association briefs from Solar Energy UK, while peer-reviewed papers in journals such as Renewable Energy track efficiency gains and learning curves. To fill financial and developer-level gaps, analysts mined D&B Hoovers and Dow Jones Factiva for disclosed project costs, PPAs, and portfolio announcements. This list is illustrative; many additional public and paid references were assessed to cross-check figures and narrative signals.
Market-Sizing & Forecasting
A top-down reconstruction starts with annual installed-capacity data from government registers, which are then trended forward using pipeline visibility and planning-approval lead times. Results are corroborated with bottom-up checks, sampled module shipments, and median system costs to test volume-value coherence. Key variables inside the model include planning approval success rates, corporate PPA appetite, residential payback periods, battery attachment ratios, grid-connection queue lengths, and real module ASP declines. Multivariate regression against those drivers projects capacity and value through 2030, while scenario analysis stress-tests policy or price shocks. Any bottom-up gaps are bridged by weighting developer disclosures with historic realization factors.
Data Validation & Update Cycle
Outputs pass anomaly screens that flag variances against National Grid demand projections and BloombergNEF price decks. Senior reviewers sign off after peer review. Reports refresh annually; should policy or subsidy changes arise, an interim revision is triggered before clients receive the latest view.
Why Our UK Solar Power Baseline Commands Reliability
Published UK solar estimates often diverge because firms pick different unit measures, currency bases, or update cadences.
Key gap drivers include contrasting scope (some fold in thermal CSP), currency conversions that overlook 2025 sterling swings, or single-source ASP assumptions that Mordor's dual-source checks correct. Others update biennially, whereas we revisit inputs each quarter when planning permissions spike.
Benchmark comparison
| Market Size | Anonymized source | Primary gap driver |
|---|---|---|
| 19.28 GW (2025 installed capacity) | Mordor Intelligence | - |
| USD 8.24 B (2024 market revenue) | Global Consultancy A | Mixes revenue with capacity and fixes exchange at 2022 rates |
| 23.50 GW (2024 installed capacity) | Industry Association B | Excludes rooftop systems below 5 kW |
| 20.2 GW (2024 installed capacity) | Trade Journal C | Pipeline projects counted before final grid connection |
The comparison shows that when scope, currency, and commissioning status differ, headline values drift. Mordor's disciplined cross-checks and quarterly refresh give executives a dependable, transparent starting point for strategy.
Need A Different Region or Segment?
Customize Now
Key Questions Answered in the Report
What capacity will the UK install by 2030?
The UK solar power market is expected to reach 30 GW by 2030, reflecting a 9.45% CAGR from 2025.
Which segment is growing fastest?
Residential rooftop systems expand the quickest, with a projected 20.9% CAGR through 2030 as panel costs fall and new-build mandates take effect.
How do grid-connection reforms benefit developers?
The “first-ready, first-connected” model will halve the queue, allowing projects with land rights and permits to secure earlier energisation dates and faster revenue.
Why is battery storage increasingly paired with solar?
Co-located batteries enable projects to earn frequency-response and balancing-service revenues while reducing curtailment risk, significantly improving project bankability.
What are the main planning challenges for large solar farms?
England’s planning framework prioritises high-grade farmland, leading to lengthy consultations and legal reviews that slow approvals for ground-mounted projects.
Page last updated on:


