
Market Overview
| Study Period | 2020 - 2031 |
|---|---|
| Forecast Data Period | 2026 - 2031 |
| Base Year Market Size (2025) | USD 1.43 Billion |
| Market Size (2026) | USD 1.49 Billion |
| Market Size (2031) | USD 1.76 Billion |
| Growth Rate (2026 - 2031) | 3.47 % |
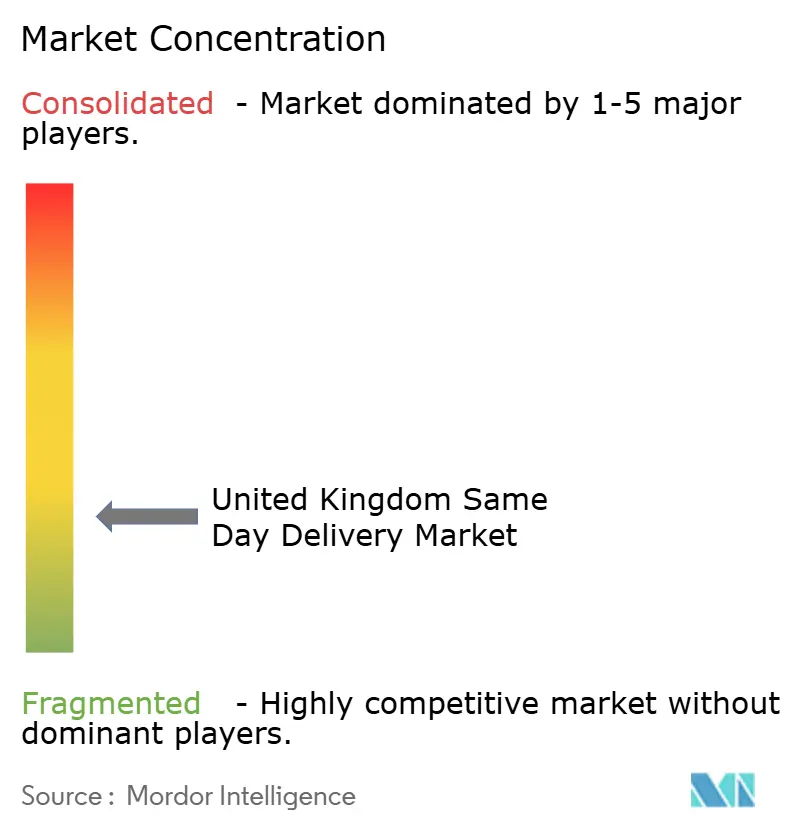
| Market Concentration | Low |
Major Players *Disclaimer: Major Players sorted in no particular order Image © Mordor Intelligence. Reuse requires attribution under CC BY 4.0. | |
United Kingdom Same Day Delivery Market Analysis by Mordor Intelligence
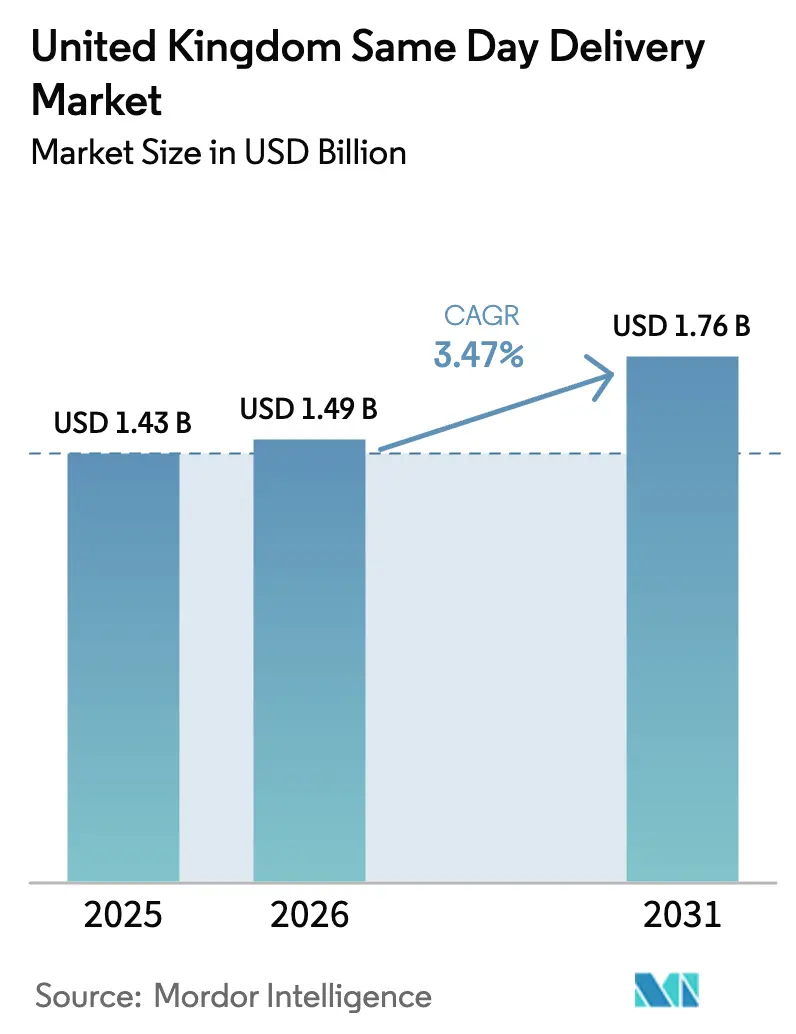
The United Kingdom Same Day Delivery Market size is estimated at USD 1.49 billion in 2026, and is expected to reach USD 1.76 billion by 2031, at a CAGR of 3.47% during the forecast period (2026-2031).
Demand is coalescing around hyper-local fulfillment nodes that cut transit legs, while congestion penalties inside low-emission zones accelerate fleet electrification and cargo-bike adoption. E-commerce parcel density still underpins route economics, yet premium B2B lanes in healthcare, aerospace, and financial services now contribute a disproportionate share of operating profit. Consolidation is reshaping service breadth: DPD UK’s purchase of CitySprint brings 88% national coverage within 60 minutes, whereas InPost’s acquisition of Yodel marries doorstep delivery with 14,000 locker locations for hybrid fulfillment. Technology investment has become table stakes as carriers deploy dynamic dispatch software that trims route distance by 25% and lifts on-time-in-full scores by 15%.
Key Report Takeaways
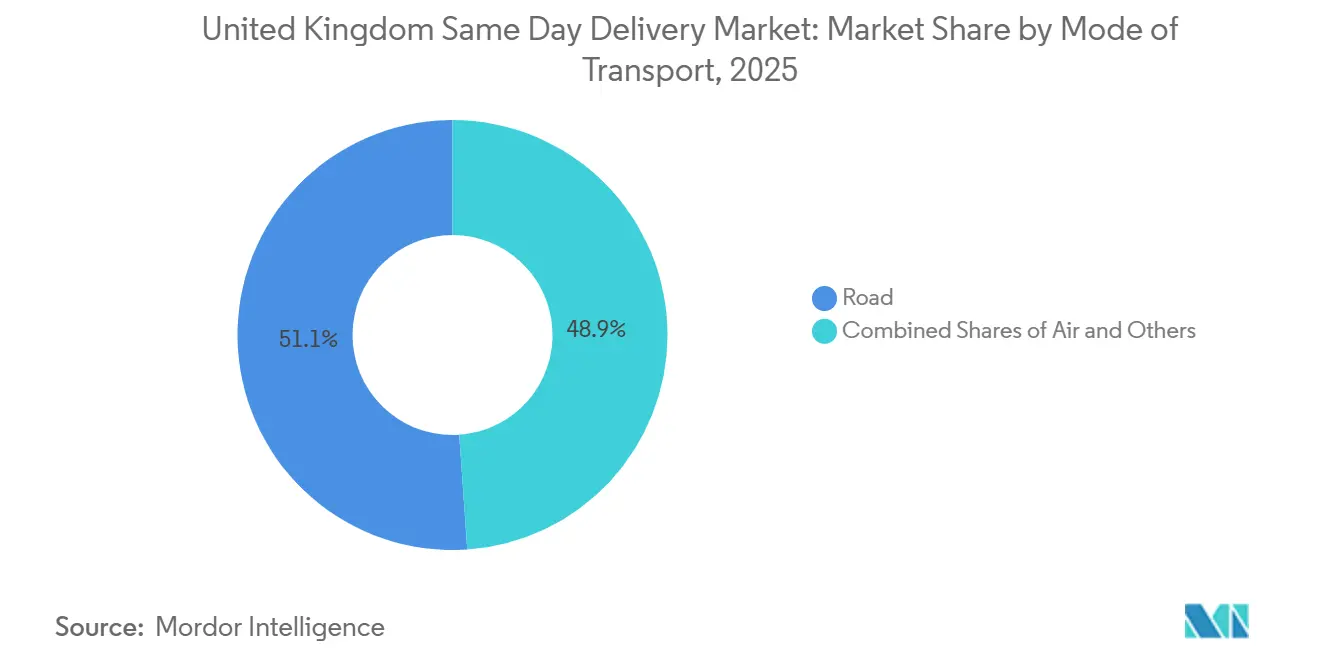
- By mode of transport, road captured 51.09% of the United Kingdom same day delivery market share in 2025, while air freight is set to advance at a 3.92% CAGR through 2031.
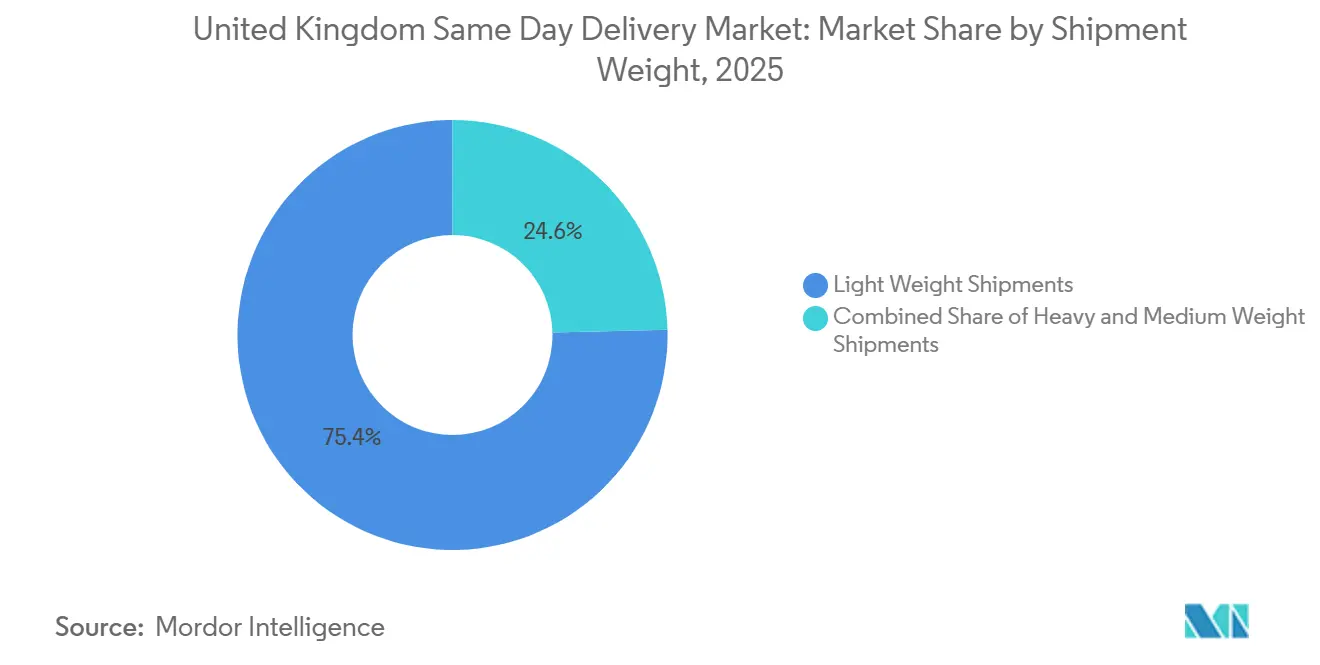
- By shipment weight, light-weight parcels accounted for 75.38% of the United Kingdom same day delivery market size in 2025 and are forecast to expand at a 4.21% CAGR to 2031.
- By customer type, B2C deliveries held 69.71% of volume in 2025, whereas wholesale and retail trade offline is growing fastest at a 3.99% CAGR.
- By end-user industry, e-commerce commanded 53.23% share in 2025, but offline retailers’ click-and-collect programs are the quickest-rising use case at 3.99% CAGR.
Note: Market size and forecast figures in this report are generated using Mordor Intelligence’s proprietary estimation framework, updated with the latest available data and insights as of January 2026.
United Kingdom Same Day Delivery Market Trends and Insights
Drivers Impact Analysis*
| Driver | (~) % Impact on CAGR Forecast | Geographic Relevance | Impact Timeline |
|---|---|---|---|
| Surging hyper-local e-grocery demand post-pandemic | +0.8% | London, Manchester, Birmingham metros | Medium term (2-4 years) |
| Retailer investment in urban micro-fulfillment centres | +0.7% | Major conurbations nationwide | Long term (≥ 4 years) |
| Rapid shift to 100%-tracked deliveries by major carriers | +0.5% | National | Short term (≤ 2 years) |
| ULEZ-linked incentives for zero-emission cargo-bike fleets | +0.6% | London, Bristol, Manchester, Birmingham | Medium term (2-4 years) |
| Retail delivery-pass/subscription models boosting repeat orders | +0.7% | Urban postcodes nationwide | Short term (≤ 2 years) |
| Public sustainability policy driving urban micro-hubs | +0.5% | London, Manchester, Birmingham, Edinburgh, Glasgow | Long term (≥ 4 years) |
| Source: Mordor Intelligence | |||
Surging Hyper-local E-grocery Demand Post-pandemic
On-demand grocery platforms processed close to 100 million UK orders worth about USD 4.06 billion in 2025, yet Deliveroo’s withdrawal from dark stores exposed fragile unit economics, pushing capacity back into supermarket estates. Waitrose’s GBP 85 (USD 114) annual Delivery Pass underwrote same-day slots from 200-plus stores, illustrating how subscriptions anchor repeat demand[1]Corporate Communications, “Delivery Pass Information,” Waitrose, waitrose.com. Ocado’s micro-fulfillment sites now exceed 300 picks per hour, enabling two-hour windows that manual warehouses cannot match. With average delivery radii shrinking under five kilometers, cargo-bike fleets gain a cost advantage inside low-emission zones. As a result, the United Kingdom's same-day delivery market is pivoting from long-haul trunking toward dense urban spokes that reward micro-hubs and zero-emission assets.
Retailer Investment in Urban Micro-fulfillment Centers
Marks & Spencer committed USD 460 million to an automated DC in 2025, targeting 300 picks per hour to support 500 stores’ click-and-collect promises. British Land is converting vacant high-street units into logistics nodes, as rents per square meter for parcel throughput now exceed those for apparel tenants. Argos already fulfills Fast Track orders from 300 outlets, demonstrating parity with pure-play e-commerce on speed while lowering return rates through in-person inspection. These moves cement brick-and-mortar stores as last-mile inventory buffers, sustaining the United Kingdom's same-day delivery market shift toward store-as-warehouse configurations in traffic-restricted cores.
Rapid Shift to 100%-tracked Deliveries by Major Carriers
Descartes routing tools cut van mileage by 25% and improve punctuality by 15%, while insurers grant 10% premium discounts for fleets with telematics-verified proof of delivery. Mapbox’s AI clustering reduces stop distances by 23%, which manual planning cannot replicate. Amazon has begun Prime Air drone drops in Darlington to guarantee sub-60-minute service where van density is low. In consequence, real-time visibility has become baseline rather than value-added, and laggards risk churn as customers migrate to carriers offering live ETAs.
ULEZ-linked Incentives for Zero-emission Cargo-bike Fleets
Transport for London offers up to USD 12,860 toward electric van replacements and USD 2,031 for cargo bikes, estimating that bikes could displace up to 17% of van kilometers by 2030. Amazon has already executed 150 million zero-emission UK deliveries since 2022, validating cargo bikes within a three-kilometer radius. Large-scale carriers now split fleets: cargo bikes in inner ULEZ districts, electric vans in outer boroughs, and diesel only for depot trunking. This bifurcation favors operators with the capital depth to manage multiple asset classes.
Restraints Impact Analysis*
| Restraint | (~) % Impact on CAGR Forecast | Geographic Relevance | Impact Timeline |
|---|---|---|---|
| Chronic courier labor shortages & rising wage floors | -0.6% | Nationwide, acute in London and South East | Short term (≤ 2 years) |
| Van-mile congestion penalties in major UK cities | -0.4% | London, Birmingham, Manchester, Bristol | Medium term (2-4 years) |
| Tight working-time reforms for gig riders from 2027 | -0.5% | National | Medium term (2-4 years) |
| Retailer push-back on premium-speed fees | -0.3% | National | Short term (≤ 2 years) |
| Source: Mordor Intelligence | |||
Chronic Courier Labor Shortages & Rising Wage Floors
The Road Haulage Association calculates a 60,000-driver annual recruitment need from 2025 onward, while the National Living Wage climbed to USD 16.54 per hour in April 2025, squeezing operators reliant on gig labor. Automation helps only at the margin: Prime Air drones remove some van routes, but payload limits confine them to sub-2-kilogram parcels. Carriers without the scale to spread higher wages over dense routes risk ceding share to integrators able to fund electric fleets and robotics.
Van-mile Congestion Penalties in Major UK Cities
A non-compliant van running 250 days a year incurs up to USD 6,094 in fees in London and Birmingham, plus 10%-15% higher insurance premiums and lower resale value[2]Insight Paper, “Clean Air Zone Birmingham,” Birmingham City Council, birmingham.gov.uk . Some carriers respond by renting micro-hubs inside ULEZ perimeters, yet British Land reports these spaces lease at 20%-30% above traditional warehouses. Smaller firms therefore face a capital hurdle that accelerates consolidation in the United Kingdom same-day delivery market.
*Our forecasts treat driver/restraint impacts as directional, not additive. The impact forecasts reflect baseline growth, mix effects, and variable interactions.
Segment Analysis
By Mode of Transport: Air Freight Captures High-Value Lanes
The United Kingdom same-day delivery market size for air freight is expanding at a 3.92% CAGR, outpacing all other modes, even though road still owns 51.09% share in 2025. High-value consignments such as temperature-controlled pharmaceuticals and mission-critical aerospace parts justify per-kilogram rates exceeding USD 67.69, explaining IAG Cargo’s “Critical” service gains. Virgin Atlantic’s Courier product and DHL’s Air Priority bridge standard next-day and bespoke charter pricing, giving shippers a mid-tier option.
Road networks remain indispensable for e-commerce volume, yet zero-emission vans and cargo bikes increasingly handle inner-city drops, while rail lanes pre-position goods overnight to cut peak-hour van mileage. This multimodal mix demonstrates how the United Kingdom's same-day delivery market is diverging: air competes on reliability, road on cost per drop, and bikes on regulatory compliance.


By Customer Type: B2C Volume, B2B Margin
B2C retained 69.71% of the United Kingdom's same-day delivery market share in 2025 and will continue growing at a 3.58% CAGR, buoyed by Amazon’s 80-city footprint. Nonetheless, willingness to pay seldom exceeds USD 13.54, forcing carriers toward automation to achieve a sub-USD 4.06 cost per drop. In contrast, B2B and B2G clients pay USD 27.07-USD 67.69 for mission-critical shipments, safeguarding margins against consumer belt-tightening.
Healthcare, aerospace, and finance depend on guaranteed delivery windows backed by chain-of-custody documentation, and UPS Healthcare’s cold-chain launch exemplifies this specialization[3]Service Overview, “UPS Healthcare Cold-Chain,” UPS Healthcare, ups.com . Carriers that balance high-volume B2C with high-margin B2B therefore enjoy a more resilient revenue mix across economic cycles.
By Shipment Weight: Light-weight Parcels Fuel Micromobility
Light-weight parcels under 2 kg accounted for 75.38% of the United Kingdom same-day delivery market size in 2025 and will rise at a 4.21% CAGR. These items align with the 100 kg payload ceiling of modern cargo bikes, allowing 20-30 stops per run in dense boroughs. Medium-weight parcels remain the province of electric vans, while heavy loads above 20 kg require larger vehicles whose ULEZ surcharges erode profitability.
DPD’s CitySprint absorption brought 3,500 multi-size vehicles under one network, illustrating the scale needed to balance different weight classes. Going forward, carriers that optimize fleet mix to weight distribution will gain cost leadership, further segmenting competition within the United Kingdom same-day delivery market.
By End-user Industry: Offline Retail’s Click-and-collect Resurgence
E-commerce produced 53.23% of demand in 2025, yet brick-and-mortar chains are the fastest-growing end-users at 3.99% CAGR as they deploy same-day click-and-collect to lure footfall. John Lewis launched a two-hour collection from select stores, leveraging existing inventory rather than dark stores. Marks & Spencer’s automated DC underpins a 500-store network that meets parity with Amazon on speed while retaining in-store upsell opportunities.
Healthcare continues to command premium prices, proven by NHS Blood and Transplant’s organ courier lanes exceeding USD 676.98 per trip. Manufacturing just-in-time replenishment and financial services document transfer round out high-margin verticals, giving carriers diversification beyond cyclical retail volumes.
Geography Analysis
Greater London delivered the largest slice of the United Kingdom's same-day delivery market in 2025, aided by population density above 5,700/km² and TfL incentives that cover up to USD 12,860 per electric van. Cargo bikes have already completed 150 million zero-emission drops city-wide, and TfL forecasts 1%-17% van-kilometer displacement by 2030.
Second-tier metros Manchester, Birmingham, and Edinburgh are witnessing rapid micro-fulfillment roll-outs as retailers seek two-hour windows without dark-store capital outlays. InPost’s enlarged 14,000-locker network offers suburban consumers lower-cost same-day alternatives where doorstep density is weak. Wales and Northern Ireland remain smaller contributors; nonetheless, Amazon’s rail partnership on the West Coast Main Line shows how overnight intermodal legs can extend same-day reach without adding daytime van mileage[4]Press Release, “West Coast Main Line Rail Deliveries,” Amazon UK, aboutamazon.co.uk .
The Competition and Markets Authority’s approval of the Evri/DHL merger, which provided that no single segment exceeds a 40% share, suggests regulators will support consolidation that funds emission-compliant fleets. Local specialists Gophr, eCourier retain niche advantages but face higher per-unit costs in ULEZ districts. Consequently, profitability across the United Kingdom same-day delivery market will diverge by locale: London favors micromobility, while regional towns rely on electrified vans and hybrid locker networks.
Regulatory Landscape
The United Kingdom same-day delivery market operates under overlapping road transport, postal, and competition oversight that affects fleet choice, labor models, and consolidation. For operators running goods vehicles above 3.5 tonnes, a Goods Vehicle Operator Licence remains a core compliance requirement, while the Competition and Markets Authority (CMA) continues to scrutinize sector deals, including inquiries linked to DPD/CitySprint and Amazon/Deliveroo, which reinforces how tightly M&A-driven scale-building is reviewed.
Road rules are also tightening around vehicle monitoring and low-emission compliance. From 1 July 2026, Smart Tachograph 2 requirements apply to 2.5-3.5 tonne vans used for international transport or cabotage for hire or reward, and the Goods Vehicles (Testing, Drivers Hours and Tachographs etc.) (Amendment) Regulations 2026 extend elements of the regulatory framework to zero-emission goods vehicles (ZEGVs) up to 4,250 kg. At the same time, Ofcom-led reforms to the Universal Postal Service, aimed at Royal Mail financial sustainability (with referenced savings of GBP 250 million to GBP 425 million in FY 2025/2026), shape the wider competitive context for time-definite parcels where postal networks, integrators, and same-day specialists overlap.
Value Chain Analysis
The value chain starts with demand generation and order capture across e-commerce, grocery, and time-critical B2B shippers, then moves into inventory positioning in stores, urban micro-fulfillment centres, and carrier-operated depots. Dispatch planning and capacity orchestration (routing, driver allocation, and proof-of-delivery workflows) sit in the middle of the chain, where dynamic dispatch and tracking are now central to meeting narrow delivery windows while managing congestion and kerbside constraints.
Physical execution runs from first-mile pickup, through line-haul or repositioning (including overnight pre-positioning into metro areas), to last-mile delivery using mixed assets, including vans, electric vans, and cargo bikes in restricted cores. Vertical integration by platforms such as Amazon Logistics internalizes key steps, including inventory placement, dispatch, and delivery capacity, while the broader ecosystem depends on interlinked public-private infrastructure, including local authority kerbside access, consolidation and micro-hub space, and compliance regimes such as operator licensing and tachograph rules. Returns handling and customer support close the loop, with parcel lockers and hybrid doorstep or OOH models adding a further node that can reduce failed deliveries and help smooth peak capacity needs.
Competitive Landscape
No operator controls more than 15% of the United Kingdom's same-day delivery market, giving the sector a low concentration profile. DPD UK’s acquisition of CitySprint and InPost’s purchase of Yodel both show that parcel companies are buying rivals so they can handle more parcels and grow in scale. This larger volume makes it easier for them to afford electric delivery vehicles and smarter route-planning technology, which are expensive but important for efficiency and sustainability. Amazon’s vertically integrated network covers 80 cities with same-day service and now layers Prime Air drones onto rural fringes, compelling rivals to match sub-60-minute promises or pivot toward specialist B2B niches.
Technology is the principal battleground. Descartes and Mapbox algorithms cut route miles and fuel, while full-stack telematics shave insurers’ risk premia. Smaller couriers that delay tech adoption instead tout local knowledge, yet the Employment Rights Bill 2024 will raise their labor cost floor by 2027, eroding this advantage.
Hybrid fulfillment is emerging as a white-space play. InPost processes 115 million locker parcels annually and projects 300 million post-Yodel, enabling carriers to blend doorstep and locker networks for cost-tiered offerings. Zedify’s cargo-bike franchising model further fragments last-mile choices, proving that capital-light, zero-emission formats can steal share where vans face congestion fees and parking limits. The competitive outlook therefore favors operators that achieve national density, field multi-modal fleets, and sustain software investment.
United Kingdom Same Day Delivery Industry Leaders
Royal Mail
DPD UK
CitySprint
Amazon Logistics
Deliveroo Hop
- *Disclaimer: Major Players sorted in no particular order

Market Opportunities and Future Outlook
The clearest opportunity is in building denser hyper-local fulfilment and micro-consolidation networks that cut transit legs and enable time-definite slots within constrained urban areas. Retailers already use stores as inventory buffers, through click-and-collect and same-day store fulfilment models referenced in the report context, and property-led conversions of high-street space into logistics nodes create additional entry points for carriers and technology providers offering dispatch, inventory visibility, and multi-carrier orchestration.
Fleet and data-driven compliance requirements also create whitespace for operators and vendors that can lower the cost of emission-compliant, fully tracked delivery. Transport for London incentives for electric van replacements (up to USD 12,860) and cargo bikes (USD 2,031) provide a concrete lever for accelerating inner-city micromobility deployment, while the 1 July 2026 Smart Tachograph 2 requirement for certain 2.5-3.5 tonne vans in international hire-and-reward operations increases demand for compliant telematics and fleet-management upgrades. Separately, government work on Smart Data and freight planning points to an active policy pathway for better capacity matching and reduced empty running, which creates room for carriers, platforms, and software providers to integrate order data, routing, and proof-of-delivery across multiple networks.
Recent Industry Developments
- July 2026: Evri Group reached over one billion annual parcels and set a 2030 target of 1.4 billion, supported by GBP 80 million investment in 2025/26. The expansion drives infrastructure, automation and capacity expansion to handle higher parcel volumes.
- July 2026: Royal Mail 2025-26 Sustainability Report shows 31% emissions reduction vs 2020-21 baseline, backed by 8,800 electric vans. The update strengthens regulatory and ESG footing while reducing operating emissions and costs over time.
- June 2026: S⚑curri reports next-day delivery volumes increased 29% year-on-year in April and May 2026. The growth supports market expansion plans and increases the need for scalable routing and fulfillment tech.


Research Methodology Framework and Report Scope
Market Definition and Coverage
For this study, the United Kingdom same-day delivery market is defined as the revenue earned from transporting and delivering shipments within the same calendar day, across business and consumer use cases, where the delivery promise is fulfilled inside the UK.
Scope exclusions: Excluded from this market are cross-border legs, scheduled next-day services, and payments that are purely for warehousing or long-haul linehaul when they are billed separately from same-day delivery.
Segmentation Overview
- By Mode of Transport
- Air
- Road
- Others
- By Customer Type/Buyer
- B2C (Consumer Deliveries)
- B2B (Incl. B2G)
- By Shipment Weight
- Heavy Weight Shipments
- Light Weight Shipments
- Medium Weight Shipments
- By End User Industry
- E-Commerce
- Financial Services (BFSI)
- Healthcare
- Manufacturing
- Primary Industry
- Wholesale & Retail Trade (Offline)
- Others
Data Sources, Market Sizing, and Validation
Desk Research
Desk research was used to map demand signals and operating conditions that shape same-day delivery volumes and pricing in the UK. We relied on public statistics and official publications such as the UK Office for National Statistics (ONS) for online retail and household spending trends, the UK Department for Transport (DfT) for freight and road transport indicators, HM Revenue and Customs (HMRC) trade statistics for directional flow context, and the Competition and Markets Authority (CMA) for consumer and platform-related references that affect delivery expectations.
To keep assumptions realistic, we reviewed additional non-paywalled sources, including Companies House filings, investor presentations, and updates from postal and logistics trade associations, along with reputable press coverage of service changes and capacity additions. Paid subscriptions were also used to cross-check company financials and intelligence, and to confirm shipment-related timelines, pricing actions, and service footprints via import-export and customs-linked data. The examples above are illustrative only, and many other public and paid sources were also checked for data collection, validation, and clarification.
Primary Interviews and Surveys
Primary work centered on interviews and structured surveys with courier operators, last-mile managers, and shipper users such as retailers, food and grocery players, and healthcare logistics teams. Since this is a country-specific market, we also balanced views across major UK urban corridors and secondary towns, so assumptions on delivery density, failed delivery rates, and same-day surcharges could be checked and adjusted.
Distribution of primary research fieldwork respondents
| Company type | Respondent position |
|---|---|
| Top tier: 38% | CXOs: 15% |
| Mid tier: 40% | Functional/Unit leaders: 27% |
| Smaller Players: 22% | Managers: 58% |
Market-Sizing & Forecasting
Sizing started with a top-down build where courier and time-definite parcel activity was reconstructed into a same-day demand pool using UK delivery-speed adoption, shipment mix, and average revenue per delivery assumptions. Only after shaping the national total did we run bottom-up checks through selective roll-ups of operator revenues, sampled price cards, and channel checks on typical same-day surcharges, which helped correct overcounts and undercounts.
Key model inputs included e-commerce order intensity in major cities, same-day eligibility linked to store and micro-fulfillment coverage, average shipment weights that affect cost-to-serve, and fuel and labor cost pass-through into pricing. Delivery density was also modeled because it changes drop rates per hour and therefore the cost per delivery. For forecasting, scenario analysis was used to reflect different paths for retail same-day adoption, fleet electrification costs, and consumer willingness to pay for speed, then the chosen base case was aligned to the most repeated expectations heard in interviews. Where bottom-up coverage was incomplete for smaller local operators, gaps were handled using calibrated revenue-per-delivery ranges tied back to observed urban delivery density and service mix.
Data Validation & Update Cycle
Outputs were validated through multiple checks so the market total matched reality signals, not just one dataset. We compared results against independent indicators such as parcel and courier revenue direction, delivery-time product mix shifts, and cost inflation trends, and then investigated large variances before final sign-off.
A second analyst review was used to stress-test assumptions like same-day penetration and ASP progression, and callbacks were triggered when responses conflicted across shipper and operator viewpoints. Reports are refreshed annually, and interim updates are made when major events materially change pricing, capacity, or regulations. Before delivery, a final pass is completed so clients receive the latest updated view.
Mordor Intelligence's United Kingdom Same Day Delivery Market Size Versus Other Published Estimates
Published figures for UK same-day delivery often disagree because they do not all count the same service items, and they also vary in base years, currency handling, and the way in-house delivery activity is treated. Differences in what gets labeled as same-day, and how revenue is split between delivery and other logistics tasks, tend to create the biggest spreads.
Warehousing and fulfillment fees that sit outside the delivery leg are kept outside Mordor Intelligence's scope, which is why some broader logistics estimates can look higher even when delivery volumes are similar. Another gap driver is the way average price per delivery is trended, since some sources apply stronger surcharge growth without checking it against fuel and labor pass-through patterns and urban density constraints. Refresh cadence also matters because new capacity announcements do not always translate into realized revenue in the same year.
Benchmark comparison
| Source | Market Size | Gaps in Research Methodology |
|---|---|---|
| Mordor Intelligence | USD 1.43 B (2025) | |
| Regional Consultancy A | USD 1.18 B (2024) | Uses a narrower definition centered on premium courier moves and applies conservative same-day penetration into parcel activity, which lowers the implied delivery count and revenue pool. |
| Trade Journal B | USD 1.82 B (2025) | Blends rapid commerce and same-day delivery revenue and assumes higher urban surcharge retention, which lifts ASP without consistent checks against cost pass-through and service eligibility. |
Overall, the spread is mainly explained by whether adjacent logistics revenues and rapid delivery services are counted, and by how price per delivery is projected year to year. Using delivery-speed eligibility, realistic delivery counts, and repeatable price logic keeps the result traceable to clear inputs that can be checked and updated consistently.


Key Questions Answered in the Report
How large will the United Kingdom same-day delivery market be by 2031?
It is forecast to reach USD 1.76 billion, expanding at a 3.47% CAGR from 2026 to 2031.
Which segment contributes the most revenue today?
Road transport remains dominant, holding 51.09% of 2025 revenue.
Why are cargo bikes gaining traction?
Low-emission-zone fees and grants of up to GBP 1,500 per bike make micro-mobility cheaper than vans for inner-city routes.
What drives premium pricing in B2B lanes?
Time-critical shipments in healthcare, aerospace, and financial services command GBP 20-GBP 50 per parcel due to strict delivery windows.
How is technology reshaping last-mile operations?
Dynamic dispatch software cuts route distance 25% and, along with telematics, earns insurers’ premium discounts of 10%-15%.
Page last updated on:


 Your data is secure and never sold or shared.


