Market Overview
| Study Period | 2020 - 2030 |
|---|---|
| Base Year For Estimation | 2024 |
| Forecast Data Period | 2025 - 2030 |
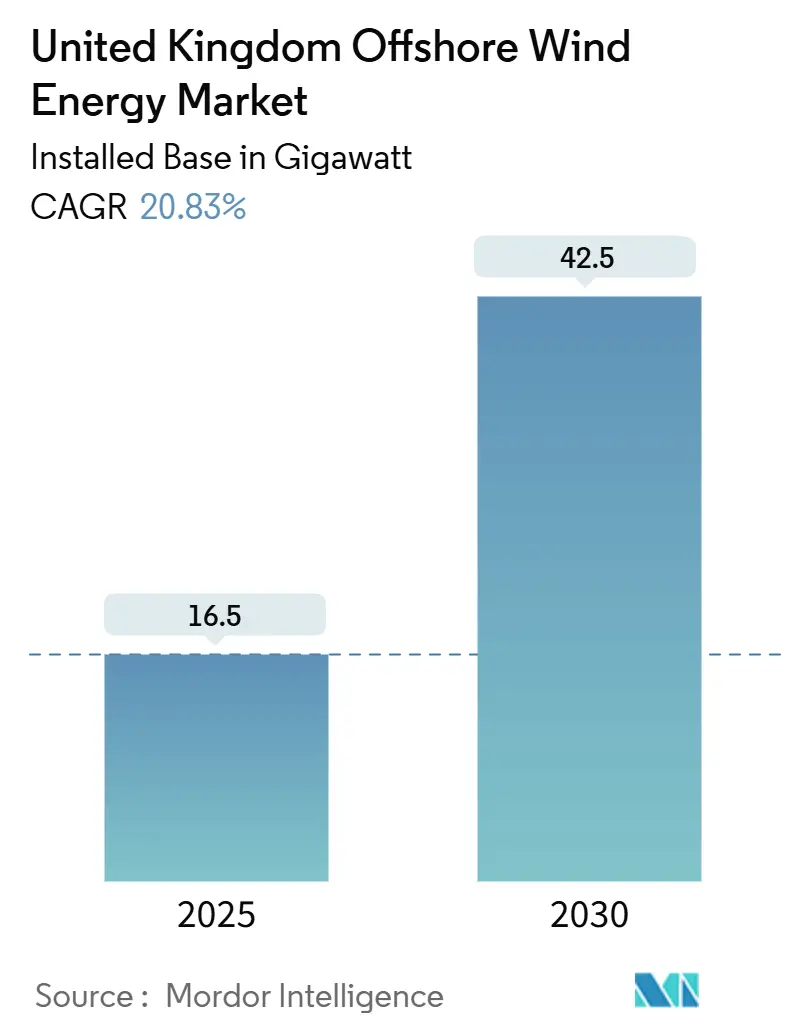
| Market Volume (2025) | 16.5 gigawatt |
| Market Volume (2030) | 42.5 gigawatt |
| Growth Rate (2025 - 2030) | 20.83% CAGR |
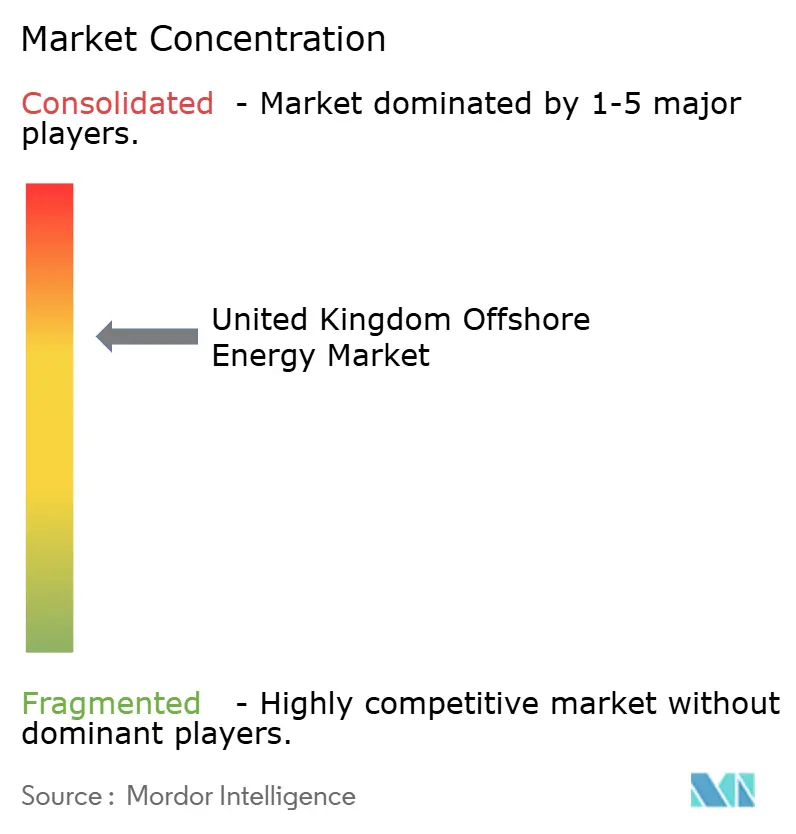
| Market Concentration | Medium |
Major Players
*Disclaimer: Major Players sorted in no particular order Image © Mordor Intelligence. Reuse requires attribution under CC BY 4.0. |
|
United Kingdom Offshore Wind Energy Market Analysis by Mordor Intelligence
The United Kingdom Offshore Wind Energy Market size in terms of installed base is expected to grow from 16.5 gigawatt in 2025 to 42.5 gigawatt by 2030, at a CAGR of 20.83% during the forecast period (2025-2030).
The growth is anchored by the Clean Power 2030 Action Plan, which sets a 43–50 GW deployment goal, and by the widening gap between wholesale power prices and the levelized cost of energy achievable from next-generation 15–20 MW turbines. Fixed-bottom arrays continue to occupy shallow North Sea acreage, yet commercial-scale floating platforms now gather momentum in Scottish and Welsh waters. Corporate power-purchase agreements augment Contracts for Difference (CfD) income and diversify revenue streams as grid-upgrade commitments unlock new landing points for future projects. Intensifying competition for installation vessels and export cable slots remains the primary operational headwind, but institutional capital inflows underscore confidence in long-term asset performance.
Key Report Takeaways
- By foundation type, fixed-bottom systems accounted for 99.5% of the United Kingdom's offshore wind energy market share in 2024, whereas floating foundations are projected to grow at a 53.9% CAGR through 2030.
- By turbine capacity, units above 6 MW represented 79.1% of the United Kingdom offshore wind energy market size in 2024 and are forecast to expand at a 22.1% CAGR.
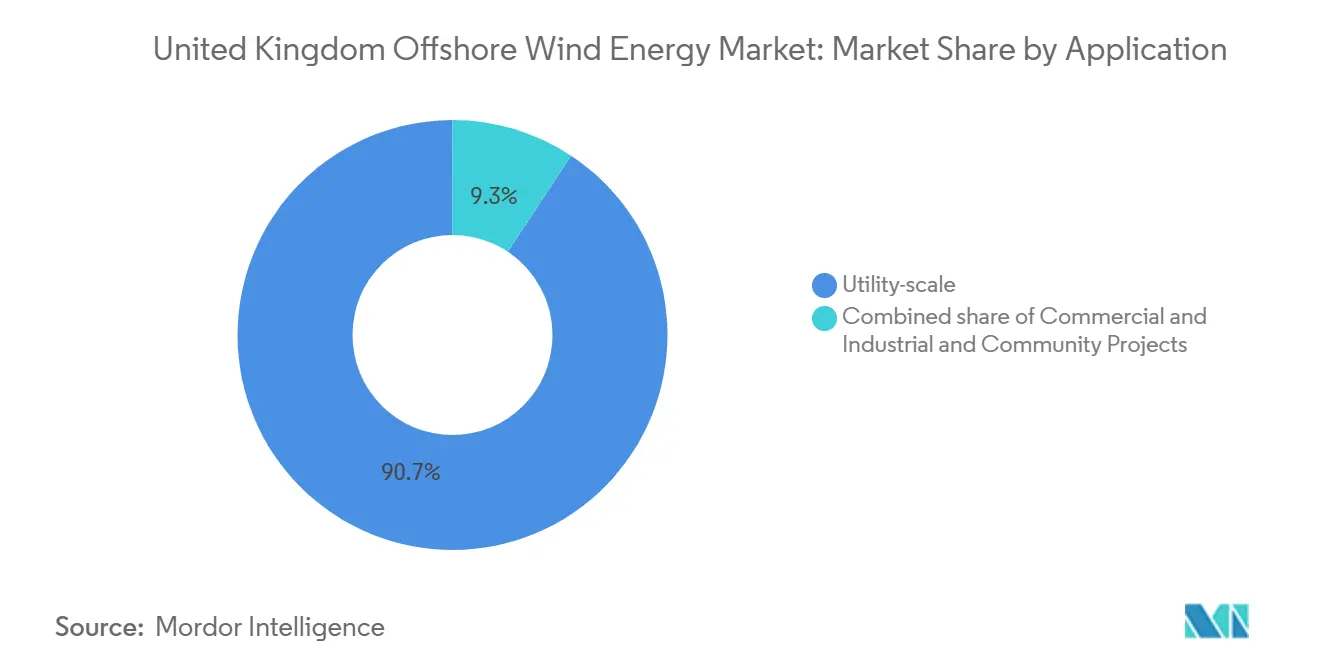
- By application, utility-scale installations captured 90.7% of the United Kingdom offshore wind energy market size in 2024, while commercial and industrial projects are advancing at a 25.6% CAGR.
United Kingdom Offshore Wind Energy Market Trends and Insights
Drivers Impact Analysis
| Driver | (~) % Impact on CAGR Forecast | Geographic Relevance | Impact Timeline |
|---|---|---|---|
| Contracts for Difference (CfD) support scheme | +7.2% | Global | Medium term (2-4 years) |
| Turbine scaling drives CAPEX decline | +5.8% | Global | Long term (≥ 4 years) |
| 50 GW 2030 national target | +4.1% | National | Short term (≤ 2 years) |
| Corporate PPA demand surge | +2.7% | Global | Medium term (2-4 years) |
| North-Sea oil & gas supply-chain crossover | +2.3% | North Sea, Scotland | Medium term (2-4 years) |
| OFTO grid & co-located storage reforms | +1.6% | National | Long term (≥ 4 years) |
| Source: Mordor Intelligence | |||
CfD Scheme Evolution Drives Investment Certainty
Allocation Round 6 delivered a record GBP 1.555 billion budget and raised the administrative strike price from GBP 44/MWh to GBP 73/MWh, neutralizing inflation risk and restoring investor confidence.[1]Department for Energy Security and Net Zero, “CfD Clean Industry Bonus Allocation Framework,” gov.uk Developers now regard CfD tariffs as an insurance floor rather than a ceiling, enabling revenue stacking with merchant sales or corporate PPAs. The forthcoming Clean Industry Bonus incorporates domestic-content thresholds, with GBP 100 million per GW for fixed-bottom arrays and GBP 50 million per GW for floating arrays, redirecting supplier spending toward U.K. fabrication yards. Established projects are rebidding to capture improved terms, thereby accelerating the financial close pipeline and reinforcing the credibility of the United Kingdom's offshore wind energy market.
Turbine Scaling Transforms Project Economics
Commercial platforms have leapfrogged from 8 MW to ratings above 15 MW, delivering 50% fewer foundations per gigawatt and trimming installation-vessel days by more than one-third. However, rotor diameters surpassing 150 m impose heavier structural loads, requiring TMCP steels and advanced blade composites to sustain 25-year lifetimes. Transitioning to 132 kV array circuits counters electrical losses and future-proofs cables for 20 MW nacelles. Ports capable of handling 400-ton nacelles and pre-assembled towers longer than football pitches now attract public-private upgrade funds, deepening the industrial ripple effect of the United Kingdom offshore wind energy market.
50 GW Target Provides Policy Backstop
The Clean Power 2030 milestone anchors national climate obligations and frames offshore wind as the principal mechanism for phasing out unabated gas-fired power. The political consensus around energy security translates into accelerated marine-planning approvals and delegated consent powers for Strategic Resource Areas. Investors interpret the target as both a volume guarantee and a signal that support schemes will evolve rather than disappear, pushing the United Kingdom's offshore wind energy market toward continuous annual auctions.[2]The Crown Estate, “UK laying strong foundations for next chapter in offshore wind story,” thecrownestate.co.uk
Corporate PPA Demand Surge
Tech majors and heavy-industry off-takers now contract multi-gigawatt volumes through physical and virtual agreements that run parallel to CfDs, locking in carbon-free power for up to 20 years. Moray West combined a 15-year CfD with a long-term Amazon PPA, demonstrating that dual income streams can secure lender appetite, even amid capital expenditure inflation. Corporate counterparties gain price hedges against future carbon levies, while developers de-risk merchant exposure and optimize debt-service coverage. As more projects adopt the model, the United Kingdom's offshore wind energy market gains a diversified customer base that extends beyond utilities.
Restraints Impact Analysis
| Restraint | (~) % Impact on CAGR Forecast | Geographic Relevance | Impact Timeline |
|---|---|---|---|
| Grid connection queue & on-shore bottlenecks | -3.7% | National | Short term (≤ 2 years) |
| Foundation & installation vessel shortage | -3.2% | Global, North Sea focus | Medium term (2-4 years) |
| Seabed conflict with new Marine Protected Areas | -1.8% | English waters, offshore MPAs | Long term (≥ 4 years) |
| CfD inflation indexation mis-match | -1.4% | National | Medium term (2-4 years) |
| Source: Mordor Intelligence | |||
Grid Connection Bottlenecks
National Grid ESO lists more than 701 GW in the interconnection queue, with some projects facing 15-year timelines before they are energized.[3]Utility Week, "ESO says £54bn required to upgrade offshore grid," utilityweek.co.uk Ofgem's TMO4+ reform prioritizes the queue for "ready" projects, but legacy first-come applications still block capacity. Transmission reinforcements totaling GBP 54 billion must be approved, built, and commissioned within the decade to accommodate 42.50 GW of offshore additions. Until then, the United Kingdom's offshore wind energy market continues to contend with serial curtailment risk and scheduling uncertainty.
Installation Vessel Capacity Constraints
Only 15–20 vessels outside China can lift 15 MW+ turbines, and none are permanently domiciled in the United Kingdom. Day rates have climbed to USD 350,000, squeezing construction budgets and prompting Ørsted and RWE to secure multiyear charters. Newbuild lead-times exceed three years at USD 400 million per hull, leaving a near-term supply gap. Without domestic shipyard incentives, projects in the United Kingdom offshore wind energy market remain exposed to global scheduling conflicts.
Segment Analysis
By Foundation Type: Floating Technology Gains Altitude
Fixed-bottom foundations accounted for 99.5% of the United Kingdom's offshore wind energy market size in 2024, a dominance rooted in the extensive sub-60m shelf of the North Sea. The segment benefits from standardized monopile manufacturing, mature jack-up vessel operations, and well-understood geotechnical profiles. Financing costs trend downward as lenders perceive minimal construction risk, reinforcing its near-term weight in auction pipelines.
Floating foundations, however, are advancing at a 53.9% CAGR through 2030 by unlocking resources in depths of 60–200 m where wind speeds reach 60% capacity factors. Seven licensed projects exceed 8 GW, led by the 2.3 GW Arven array off the coast of Scotland. Semi-submersible and tension-leg platforms are assembled quayside and then towed to the site, a method that mitigates offshore weather risks and shortens critical‐path schedules. Ports in the Celtic Sea are upgrading heavy-lift cranes and deepwater berths to capitalize on this emerging value chain, signaling the next stage for the United Kingdom's offshore wind energy market.[4]The Crown Estate, “Supply chain for Celtic Sea floating wind farms,” thecrownestate.co.uk

Note: Segment shares of all individual segments available upon report purchase
Get Detailed Market Forecasts at the Most Granular Levels
Download PDF
By Turbine Capacity: Above 6 MW Becomes the New Normal
Turbines above 6 MW captured 79.1% of the United Kingdom's offshore wind energy market share in 2024 and are forecast to grow at a rate of 22.1% annually as OEMs phase out smaller platforms. Leading developers now specify 15-20 MW machines, halving the number of foundations compared with 8 MW baselines and reducing cable lengths per installed megawatt. The resulting drop in balance-of-plant costs explains rising bid competitiveness despite global inflation.
Legacy segments, ranging from 3 MW to 3-6 MW, decline as early arrays approach end-of-life, creating a decommissioning backlog. Component recyclers focus on blade-to-blade repurposing and composite shredding techniques to minimize landfill. Upgrading sub-6 MW sites with next-generation turbines increases capacity fourfold without expanding seabed footprints, further boosting the United Kingdom offshore wind energy market.
By Application: Commercial & Industrial Demand Accelerates
Utility-scale projects held 90.7% of the United Kingdom's offshore wind energy market size in 2024, leveraging economies of scale and CfD support. Transmission operators favor high-capacity connections that streamline grid planning and amortize the cost of onshore reinforcements.
Commercial and industrial (C&I) demand is forecast to grow at a 25.6% annual rate, driven by sustainability targets and rising Scope 2 reporting obligations. Multinationals now sign 200 MW-plus virtual PPAs that bundle offshore output with renewable-energy certificates, securing a zero-carbon supply and hedging electricity price volatility. C&I participation diversifies offtake risk and underpins the bankability of merchant-exposed capacity, anchoring an increasingly sophisticated revenue mix within the United Kingdom offshore wind energy market.
Note: Segment shares of all individual segments available upon report purchase
Get Detailed Market Forecasts at the Most Granular Levels
Download PDF
Geography Analysis
England, Scotland, Wales, and Northern Ireland operated 30.7 GW of offshore wind in 2024, accounting for around 40% of the global total, and aim to reach up to 50 GW by 2030. English waters dominate fixed-bottom developments, with the 3.6 GW Dogger Bank cluster illustrating economies of scale 70 km offshore. Scotland spearheads floating pilots and hosts 11 GW of ScotWind leases, leveraging oil-and-gas fabrication yards for platform assembly.
Wales positions the Celtic Sea as a floating-wind hub, allocating 4.5 GW and investing in port upgrades at Milford Haven and Port Talbot. Northern Ireland's nascent portfolio seeks cross-border interconnection with the Irish Single Electricity Market. Each region draws distinct supply-chain advantages: England's proximity to load centers reduces transmission losses, Scotland's deepwater expertise accelerates mooring innovation, and Wales captures the manufacturing dividend from modular platform assembly.
Future build-out hinges on National Grid ESO's Holistic Network Design, which selects 15 landing points to disperse generation across coastal substations and minimize curtailment. Coordinated cable corridors are designed to share permitting envelopes, thereby reducing environmental impact while sustaining the expansion of the United Kingdom's offshore wind energy market.[5]National Grid ESO, “Holistic Network Design,” nationalgrideso.com
Competitive Landscape
Ørsted controls more than 5 GW of operational capacity, maintaining its leadership despite divesting four farm stakes to Brookfield for £1.745 billion in 2024.[6]Ørsted, “Divests share of four UK offshore wind farms,” orsted.com ScottishPower, SSE Renewables, and RWE follow, each coupling seabed leases with long-term turbine supply agreements that lock in availability and price. Masdar's entry via joint ventures highlights the increasing influx of Middle Eastern capital, while Copenhagen Infrastructure Partners expands through late-stage acquisitions.
The strategic focus now concentrates on floating wind prototypes, grid stabilization technology, and holistic O&M digitalization. Hitachi Energy secured the first European Enhanced STATCOM contract to stabilize voltage at Hornsea 4, signaling new service niches for power-electronics specialists. Emerging retailers like Octopus Energy merge generation assets with retail portfolios, creating vertically integrated models that could reshape value capture across the United Kingdom's offshore wind energy market.
United Kingdom Offshore Wind Energy Industry Leaders
-
Ørsted
-
Vestas
-
Siemens Gamesa Renewable Energy, S.A.,
-
EDF Renewables
-
GE RENEWABLE ENERGY
- *Disclaimer: Major Players sorted in no particular order
Need More Details on Market Players and Competitors?
Download PDF
Recent Industry Developments
- May 2025: Ørsted has canceled its Hornsea 4 offshore wind project in the UK due to escalating supply chain costs, rising interest rates, and increased project execution risks, according to company announcements.
- April 2025: Octopus Energy Generation, the generation arm of Octopus Energy, has acquired a 10% stake in the East Anglia One offshore wind farm.
- March 2025: The Crown Estate has launched the "Offshore Wind Leasing Round 5" to develop floating offshore wind farms in the Celtic Sea. The round aims to award seabed leases for up to 4.5 GW of generation capacity across three project development areas, to establish a new floating wind sector off the coasts of South Wales and South West England.
- February 2025: Copenhagen Infrastructure Partners (CIP) has acquired full ownership of the Morecambe offshore wind project in the UK, signaling continued investor interest in renewable energy projects. The 480 MW project, located off the Lancashire coast, was purchased from COBRA Group and Flotation Energy, with the latter remaining involved as a development partner.
United Kingdom Offshore Wind Energy Market Report Scope
The Scope of the United Kingdom Offshore Wind Energy Market includes:-
By Foundation Type
| Fixed-Bottom |
| Floating |
By Turbine Capacity
| Up to 3 MW |
| 3 to 6 MW |
| Above 6 MW |
By Application
| Utility-scale |
| Commercial and Industrial |
| Community Projects |
By Component (Qualitative Analysis)
| Nacelle/Turbine |
| Blade |
| Tower |
| Generator and Gearbox |
| Balance-of-System |
| Others (Installation, Vessels, O&M) |
| By Foundation Type | Fixed-Bottom |
| Floating | |
| By Turbine Capacity | Up to 3 MW |
| 3 to 6 MW | |
| Above 6 MW | |
| By Application | Utility-scale |
| Commercial and Industrial | |
| Community Projects | |
| By Component (Qualitative Analysis) | Nacelle/Turbine |
| Blade | |
| Tower | |
| Generator and Gearbox | |
| Balance-of-System | |
| Others (Installation, Vessels, O&M) |
Need A Different Region or Segment?
Customize Now
Key Questions Answered in the Report
How large is the current United Kingdom offshore wind fleet?
Installed capacity reached 16.50 GW in 2025 and is projected to reach 42.50 GW by 2030.
Which foundation type dominates projects today?
Fixed-bottom monopiles held 99.5% share in 2024, though floating concepts are scaling rapidly.
What CAGR is expected for floating wind deployments?
Floating foundations are forecast to grow at 53.9% annually through 2030.
How do Contracts for Difference benefit developers?
CfDs provide a revenue floor that reduces financing risk and, when combined with PPAs, create attractive blended income streams.
Why are grid upgrades critical by 2030?
National Grid ESO estimates GBP 54 billion of reinforcements are required to connect the targeted 50 GW pipeline.
What drives rising turbine ratings?
Larger 15–20 MW machines cut foundation counts and installation times, lowering total project CAPEX despite heavier components.


