
Market Overview
| Study Period | 2020 - 2031 |
|---|---|
| Forecast Data Period | 2026 - 2031 |
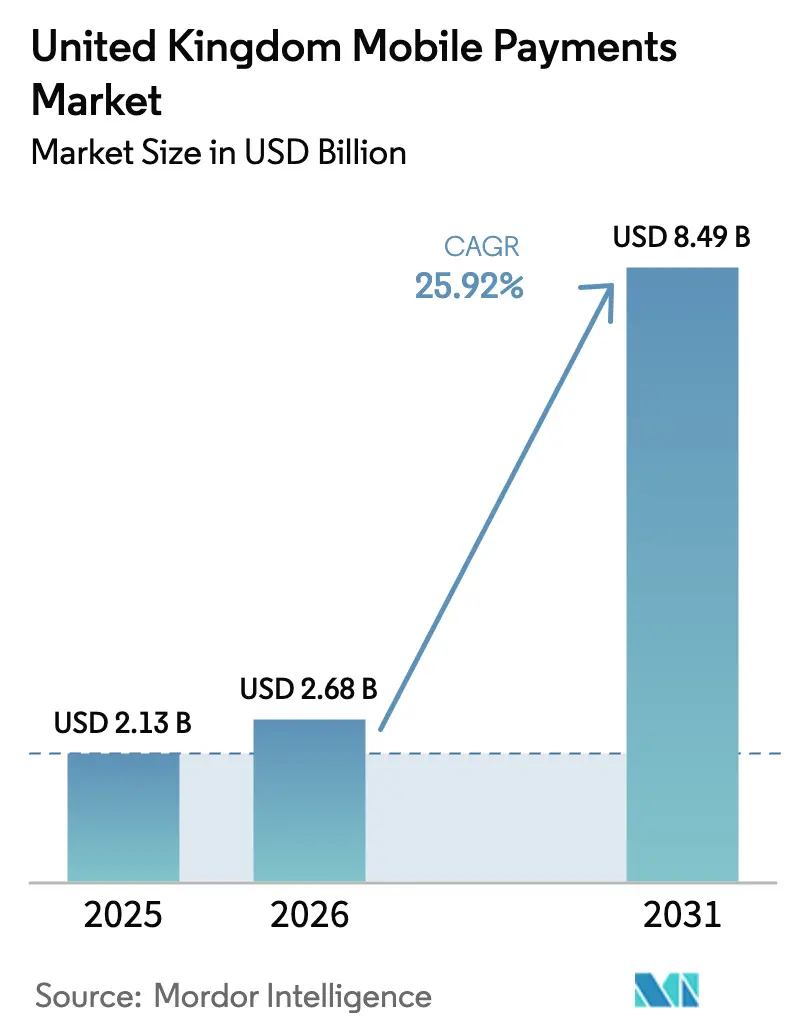
| Base Year Market Size (2025) | USD 2.13 Billion |
| Market Size (2026) | USD 2.68 Billion |
| Market Size (2031) | USD 8.49 Billion |
| Growth Rate (2026 - 2031) | 25.92% CAGR |
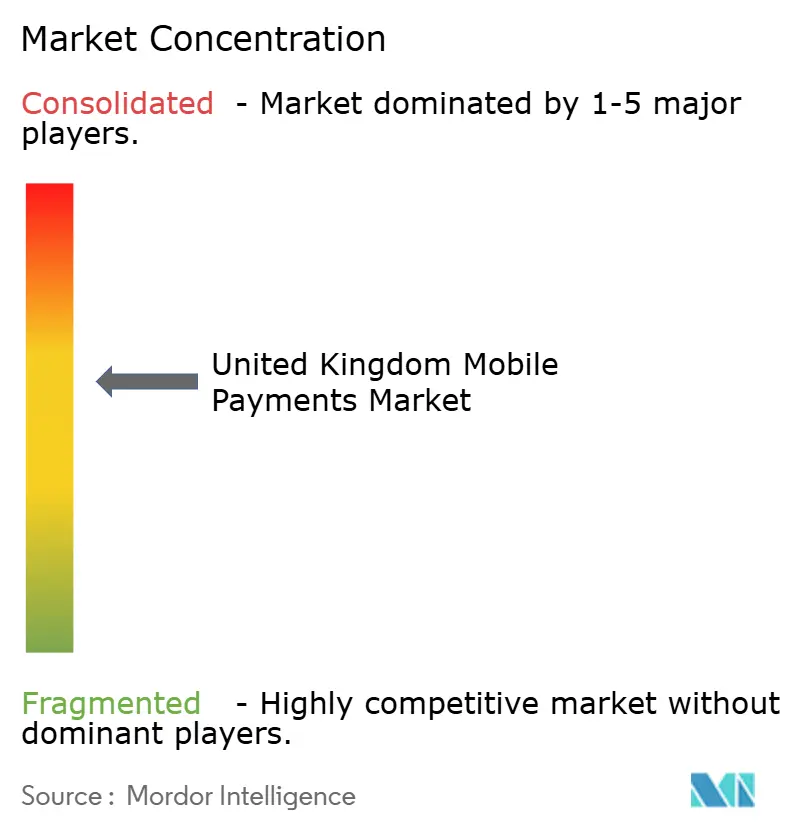
| Market Concentration | Medium |
Major Players *Disclaimer: Major Players sorted in no particular order Image © Mordor Intelligence. Reuse requires attribution under CC BY 4.0. | |
United Kingdom Mobile Payments Market Analysis by Mordor Intelligence
The United Kingdom Mobile Payments Market size was valued at USD 2.13 billion in 2025 and estimated to grow from USD 2.68 billion in 2026 to reach USD 8.49 billion by 2031, at a CAGR of 25.92% during the forecast period (2026-2031). The expansion mirrors the country’s reputation as a payments-technology trailblazer, where open-banking mandates, instant account-to-account rails and a strong cultural bias toward contactless convenience combine to make the smartphone an everyday financial hub. High merchant acceptance of near-field communication readers, mass-market use of fingerprint and facial authentication and the regulatory green light for variable recurring payments (VRPs) have all normalised mobile checkout in grocery stores, cafés and public transport. At the same time, fintech challengers keep chipping away at incumbents’ interchange income streams, and big-tech wallets strengthen ecosystem lock-in by embedding payment credentials deep inside operating systems. On the downside, a persistent rise in authorised push-payment (APP) fraud and the long-standing cap on consumer card interchange fees are pressuring providers to double down on behavioural-analytics engines, tokenisation upgrades and diversified revenue models.
Key Report Takeaways
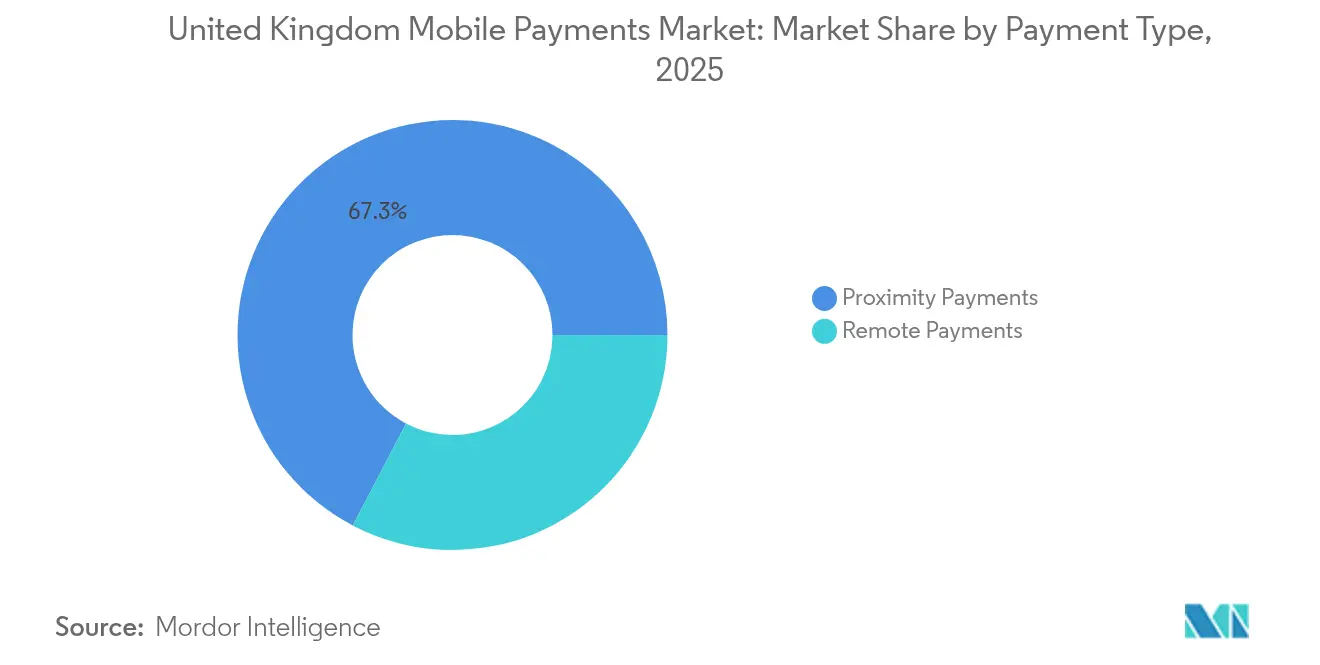
- By payment type, proximity captured 67.32% of the United Kingdom mobile payments market share in 2025; remote payments are forecast to expand at a 30.12% CAGR to 2031.
- By transaction type, the in-store POS segment led with 59.25% revenue share in 2025, while P2P transactions record the highest projected CAGR at 28.14% through 2031.
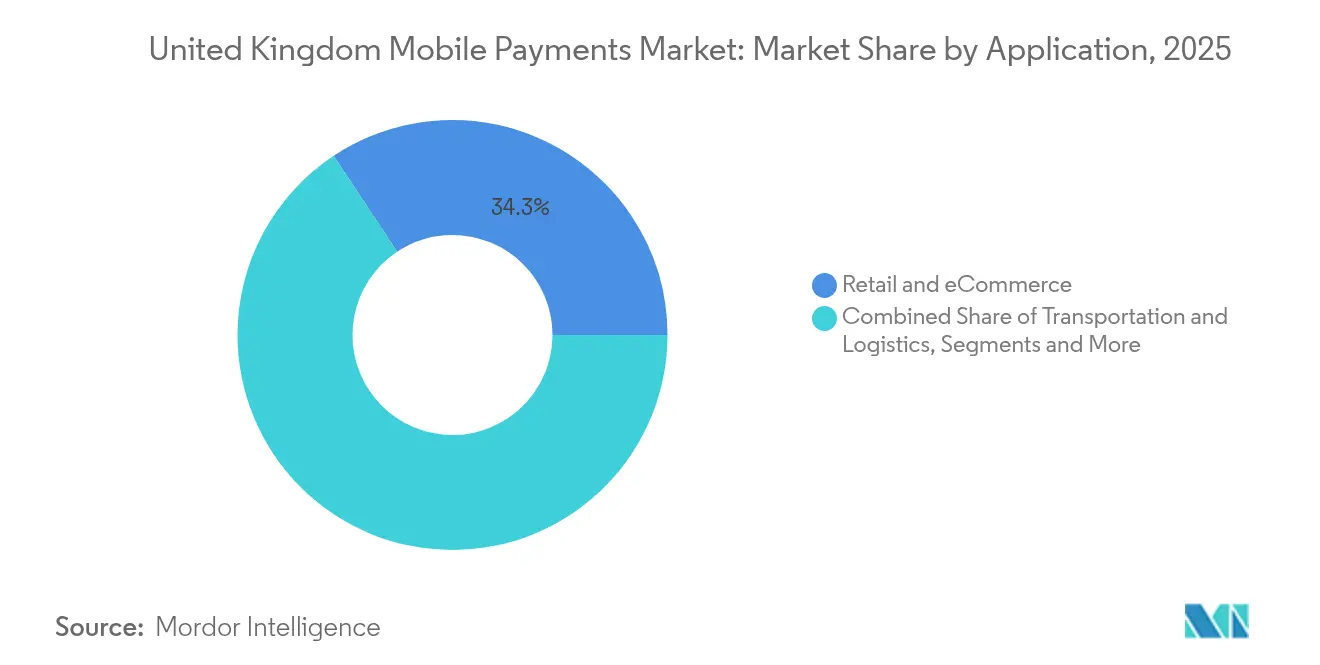
- By application, retail and e-commerce accounted for 34.32% share of the United Kingdom mobile payments market size in 2025; transportation and logistics will grow fastest at a 31.12% CAGR to 2031.
- By end-user, personal users held 81.35% of the United Kingdom mobile payments market share in 2025, whereas the business segment is advancing at a 24.18% CAGR through 2031.
Note: Market size and forecast figures in this report are generated using Mordor Intelligence’s proprietary estimation framework, updated with the latest available data and insights as of 2026.
United Kingdom Mobile Payments Market Trends and Insights
Drivers Impact Analysis*
| Driver | (~) % Impact on CAGR Forecast | Geographic Relevance | Impact Timeline |
|---|---|---|---|
| Development of open-banking-enabled wallet top-ups | +5.3% | UK-wide, urban concentration | Medium term (2–4 years) |
| U.K. Faster Payments Scheme accelerating P2P adoption | +4.8% | National, metro focus | Short term (≤2 years) |
| Surge in QR-code acceptance among SME merchants | +3.7% | England, Scotland, Wales | Medium term (2–4 years) |
| Growing wearable payments on London transport network | +2.9% | London, other cities later | Medium term (2–4 years) |
| Retailer-led super-app ecosystems | +3.2% | UK-wide | Medium term (2–4 years) |
| BNPL-integrated wallets driving basket conversion | +4.1% | National, e-commerce hubs | Short term (≤2 years) |
| Source: Mordor Intelligence | |||
Development of Open-Banking-Enabled Wallet Top-Ups
Open-banking payment volumes reached USD 57 billion in 2024 and are forecast to climb 209% by 2029, helped by a widening circle of application-programming-interface (API) standards and consumer familiarity with “pay-by-bank” buttons. Because the model removes card networks from the funding flow, merchants pay materially lower fees while customers enjoy the extra security of bank-grade authentication. The Financial Conduct Authority’s ongoing work on VRP frameworks is accelerating product launches in which a wallet “pulls” funds straight from a user’s account without additional credential entry. As of 2024, 13% of digitally active consumers and 18% of small businesses use an open-banking service at least once a month. Providers anticipate that real-time, multi-bank top-ups will become table-stakes functionality over the next two years, anchoring wallet loyalty and raising the United Kingdom mobile payments market’s profile as a benchmark for embedded finance.
U.K. Faster Payments Scheme Accelerating P2P Adoption
The Faster Payments Scheme cleared GBP 3.7 trillion (USD 4.7 trillion) in account-to-account transfers during 2023, up 15% from 2022.[2]James Wharton, “Market Review of Card Scheme and Processing Fees,” Payment Systems Regulator, psr.org.uk Instant settlement transforms person-to-person cash flows, making it easier to split bills, gift money or settle rent within seconds. Visa’s A2A overlay service, launched in 2025, brings chargeback-style dispute management and biometric confirmation to the scheme, making higher-ticket P2P transfers safer. For banks, the surge in low-cost, high-frequency traffic is a cross-sell gateway for deposits and unsecured credit, underlining why instant rails are now a board-level priority.
Surge in QR-Code Acceptance Among SME Merchants Across England
QR-code scans once occupied a niche role in specialist retail but now represent a cost-effective card alternative for corner shops, market stalls and mobile traders. With hardware needs limited to a printed code and any camera-equipped phone, merchants keep processing costs below 0.2%, far under regulated interchange caps. Tokenisation and dynamic codes reduce the risk of credential replay attacks, helping consumer trust catch up with convenience. Analysts expect a meaningful share of 2025 smartphone users to rely on QR codes for weekly purchases, an inflection that will widen acceptance to economically sensitive rural and suburban districts where countertop PIN pads were cost-prohibitive.
Growing Wearable Payments on London Transport Network
Transport for London (TfL) now handles more than 500 million trips each year, with 10% of those journeys paid via smartwatches or fitness bands configured for contactless settlement.[1]Paul Hindle, “TfL Tops 1 Billion Contactless Journeys,” FinTech Futures, fintechfutures.com The system automatically charges the lowest possible fare and eliminates the time cost of ticket queues. Since rollout, TfL’s network has processed in excess of five billion contactless journeys using 40 million unique cards from 145 countries, proving global travellers trust the model. The success story is prompting large regional bus and rail operators to adopt the same open-loop architecture, helping keep daily ride frequency at the centre of wallet-provider growth strategies.
Restraints Impact Analysis*
| Restraint | (~) % Impact on CAGR Forecast | Geographic Relevance | Impact Timeline |
|---|---|---|---|
| Interchange fee caps squeezing PSP margins | –2.1% | UK-wide, hits small PSPs hardest | Short term (≤2 years) |
| Rising APP fraud losses | –1.9% | Urban concentration | Short term (≤2 years) |
| Fragmented wallet loyalty-point interoperability | –1.4% | National, multi-wallet users | Medium term (2–4 years) |
| Demographic payments exclusion (55+ cohort) | –1.6% | Rural bias | Long term (≥4 years) |
| Source: Mordor Intelligence | |||
Interchange Fee Caps Squeezing PSP Margins
Debit and credit interchange fees have sat at 0.20% and 0.30% respectively since 2015, creating a margin squeeze for small and mid-tier payment service providers (PSPs).[3]Charlotte Wood, “Visa Boosts Consumer Protection With Smarter Bank Transfer Payments,” Visa, visa.co.uk Card schemes have responded by raising non-regulated ancillary fees, adding an estimated GBP 170 million (USD 206 million) to UK merchants’ cost of acceptance over seven years. Smaller PSPs without volume-based rebates face disproportionate drag and are accelerating toward consolidation or strategic partnerships. Consequently, many are pivoting to account-to-account propositions including Pay-by-Bank buttons to regain share of checkout.
Rising APP Fraud Losses
APP fraud totalled GBP 450.7 million (USD 545 million) in 2024. New reimbursement rules allow victims to recover up to 86% of lost funds within days, improving consumer trust but raising compliance and treasury costs for PSPs. Seventy-two percent of fraud originates online, with investment scams contributing the largest absolute losses. Providers are rolling out behavioural biometrics, real-time device fingerprinting and network-level scam databases, but the arms race inflates opex and can slow time-to-market for new features.
*Our forecasts treat driver/restraint impacts as directional, not additive. The impact forecasts reflect baseline growth, mix effects, and variable interactions.
Segment Analysis
By Payment Type: Proximity Dominates While Remote Accelerates
Proximity transactions accounted for 67.32% of the United Kingdom mobile payments market share in 2025, cementing contactless as the default tender at grocery checkouts, quick-service restaurants and mass-transit gates. Biometric authentication and token-on-file storage keep the fraud-to-sales ratio below card-not-present benchmarks. Remote payments, by contrast, are on track for a 30.12% CAGR, propelled by one-click “buy now” widgets in native apps and progressive-web-app checkout. Retailers are using remote wallets to merge cart abandonment-recovery emails, micro-loyalty incentives and seamless re-orders, blurring the once clear channel lines between physical and digital retail.
As the QR-code boom continues, the boundary between proximity and remote transactions grows increasingly porous. Consumers scan a code at the table, authenticate in their wallet, and the transaction settles remotely even though both parties are in the same venue. Such hybrid experiences further expand the total addressable United Kingdom mobile payments market size.


By Transaction Type: In-Store POS Leads While P2P Grows Fastest
In-store POS claimed 59.25% of 2025 value. Visa’s Tap-to-Phone solution, live on standard Android devices, delivered 320% volume growth within a year and onboarded thousands of micro-merchants that previously relied on cash only. The democratisation of acceptance allows small businesses florists, pop-up food stalls, home-repair contractors to plug into the digital economy without hardware subsidies.
P2P, advancing at 28.14% CAGR, is reshaping social payment etiquette. Instant refunds from split ride-hailing, rent settlements across flatmates and neighbourhood fundraisers all funnel increasing aggregate value through mobile apps. As biometric-secured P2P per-transaction limits rise, the segment will eat into higher-value transfers traditionally executed via desktop banking.
By Application: Retail Retains Lead While Transportation Accelerates
Retail and e-commerce collectively delivered 34.32% of the United Kingdom mobile payments market size in 2025. Grocery chains prime customers with digital-only discounts unlocked exclusively via wallet pay-in, reinforcing app habit formation. Fashion and electronics retailers run targeted pay-with-wallet flash sales that cross-reference loyalty tiers and available BNPL credit lines.
Transport applications grow fastest, at 31.12% CAGR to 2031. TfL’s proven success has lit the path for Manchester and Birmingham pilot schemes financed under the Department for Transport’s multi-modal Pay As You Go expansion. Real-time fare capping, combined with wearables acceptance, extends mobile payments into an essential daily-frequency category, a coveted position for wallet providers aiming to dominate top-of-mind consumer preference.
By End-User: Personal Users Dominate While Business Adoption Accelerates
Personal customers generated 81.35% of 2025 volume. Six in ten adults now possess at least one mobile wallet registration, and 52% used a wallet for payment in the last 12 months. Biometric login, tokenised credentials and single-tap refunds have normalised smartphones as transactional companions for all but the most digitally excluded demographics.
Business usage, while smaller, is scaling rapidly at 24.18% CAGR. More than 60% of SME banking clients accessed accounts via a mobile app in 2024, while 56% of business banks offer mobile-only onboarding. Tap-to-Phone acceptance enables mobile invoice settlement at the point of service, accelerating receivables, and reducing reliance on physical terminals. As corporate card and expense-management providers embed wallet tokens, the United Kingdom mobile payments market size attributable to B2B flows will climb steadily.
Geography Analysis
London remains the epicentre. TfL’s open-loop network, serving over five billion contactless rides, sets benchmarks that fintechs replicate worldwide. The capital’s diverse resident and tourist mix ensures standing demand for multi-currency acceptance, propelling wallet upgrades to support cross-border token translation. In addition, London hosts the highest density of fintech incubators, making it the natural test market for “beta” wallet capabilities like digital identity credentials.
Northern and Midlands centres Manchester, Birmingham and Leeds leverage city-region partnerships to extend PAYG transit acceptance to trams and buses. Edinburgh’s technology cluster sees strong QR uptake among SMEs keen to side-step card-scheme fee inflation. Coastal hubs such as Brighton, Bournemouth and Blackpool prioritise wallet acceptance in hospitality to serve international visitors.
Conversely, rural counties face bandwidth gaps and an ageing demographic profile. Seventeen percent of adults in remote areas report problems accessing banking, and a significant proportion still rely on post-office cash services. Government funding of GBP 8.3 billion for highways and GBP 4.7 billion for local transport between 2025 and 2030 may indirectly bolster mobile coverage and POS infrastructure, but providers must bridge the interim by offering offline-authorisation modes and hybrid chip-and-mobile cards.
Regulatory Landscape
The United Kingdom mobile payments market operates under the Payment Services Regulations 2017 and Electronic Money Regulations 2011, with the Financial Conduct Authority (FCA) providing day-to-day supervision. Competition and access oversight has historically been handled by the Payment Systems Regulator (PSR). In March 2026, the FCA published updated guidance on payment services and electronic money (Our Approach), reinforcing authorization, safeguarding, and compliance controls for wallet issuers, payment institutions, and e-money firms active in mobile checkout and P2P use cases.
In April 2026, HM Government published its response to streamline payment regulation, confirming plans to abolish the PSR and transfer functions to the FCA under FSMA, reducing fragmentation for cards, wallets, and account-to-account rails. The Modernising Payments Regulation programme run by HM Treasury focuses on tokenised payments and the long-term Open Banking framework, shaping roadmaps for pay-by-bank, VRPs, and embedded wallet funding.
Value Chain Analysis
The value chain starts with device and OS platforms that provide secure elements, biometrics, and default wallet placement. It then moves through wallet apps and merchant checkout layers, covering both in-app and in-store payments. Payment orchestration and gateway providers connect merchants to card schemes (tokenisation, routing, and settlement) and to account-to-account rails via Open Banking APIs, while banks, e-money institutions, and acquirers provide funding, safeguarding, and settlement accounts. Infrastructure operators and governance bodies support the system, notably Pay.UK for Faster Payments and the Open Banking ecosystem for API-based initiation, with fraud controls and identity tools built into onboarding, authentication, and transaction monitoring.
Regulatory and industry initiatives influence where value is earned across the chain. The Data (Use and Access) Act 2025 established a statutory framework for Open Banking within the UK Smart Data scheme, and usage indicators point to scale in the rails layer, with 351 million Open Banking payment transactions in 2025 and 16.5 million user connections by December 2025. On the competitive layer, the CMA opened Strategic Market Status investigations in January 2025 into Apple and Google mobile ecosystems, focusing attention on wallet interoperability and platform terms. In December 2025, the FCA announced the UK Payments Initiative, bringing together 31 organizations, including Mastercard Open Banking Services, NatWest Group, and Plaid, to advance commercial VRPs and programmable account-to-account propositions that bypass card interchange economics.
Competitive Landscape
Two global device makers command a majority of mobile wallet token volumes, enough to trigger concurrent inquiries by the FCA and the Payment Systems Regulator into potential competition bottlenecks. Their advantage rests on hardware-embedded secure elements and default-wallet status at the operating-system layer. Traditional card networks hold a complementary moat via tokenisation services and brand acceptance norms, but interchange caps and fee scrutiny keep profitability under the microscope.
Domestic challenger banks compete through cloud-native cores that integrate payments, savings, and invoice workflows under a single login. Mambu’s December 2024 purchase of Numeral adds a modern payment-orchestration layer to its SaaS core, allowing rapid deployment of instant-payment use cases without legacy constraints. Smaller PSPs must either acquire similar capabilities or risk relegation to white-label processing.
Loyalty interoperability, real-time credit scoring, and offline biometric authorisation remain underdeveloped niches. Players who amalgamate these functions can create defensible moats by offering end-to-end journey coverageshopping baskets, transit, peer transfers and cross-border remittances in a uniform user experience.
United Kingdom Mobile Payments Industry Leaders
Apple Inc.
Google LLC (Google Pay)
Samsung Electronics (Samsung Pay)
PayPal (Europe) S.à r.l. et Cie, S.C.A.
Amazon Payments, Inc.
- *Disclaimer: Major Players sorted in no particular order

Market Opportunities and Future Outlook
Commercial VRPs and pay-by-bank wallet top-ups form a clear whitespace at UK checkout, tied to Open Banking moving into a statutory Smart Data footing via the Data Use and Access Act 2025. The UK Payments Initiative in December 2025, with 31 participating organizations, provides a direct pathway for scaling commercial VRPs across banks and fintech enablers, supporting new mobile payment journeys such as subscription management, recurring bills, and wallet funding without storing card credentials.
Infrastructure modernization and consolidation of oversight also create room for rails-linked products and new entrants. The National Payments Vision (August 2025) and related governance, including the Bank of England-chaired Retail Payments Infrastructure Board, continue to set direction for future retail payments infrastructure across Faster Payments and Bacs. March 2025 data shows 31 million Open Banking account-to-account payments, up 70% year-on-year. At the same time, the April 2026 plan to transfer PSR functions into the FCA, alongside progress on tokenised payments, supports opportunities for programmable payments, tokenisation, and multi-rail mobile checkout stacks across retail, transport, and P2P use cases.
Recent Industry Developments
- July 2026: Starling Bank integrated Adyen technology to launch Tap to Pay for UK SMEs, enabling contactless acceptance on a smartphone without dedicated card-reader hardware. This broadens micro-merchant acceptance options and strengthens the in-store POS layer as more small businesses can take wallet-based contactless payments with lower setup friction.
- June 2026: The UK Payments Initiative launched as a new company backed by major UK banks to build alternatives that reduce reliance on international card networks for domestic payments. The move supports faster commercialization of account-to-account propositions, including commercial VRPs, and can shift bargaining power across wallets, acquirers, and merchants.
- January 2025: CMA opened Strategic Market Status investigations into Apple and Google mobile ecosystems, focusing on wallet interoperability and platform terms. This action places wallet providers and merchants under closer regulatory scrutiny and signals potential policy adjustments affecting mobile payments terms in the UK.


Research Methodology Framework and Report Scope
Market Definition and Coverage
For this methodology, the United Kingdom mobile payments market covers the value of payment transactions initiated through a mobile device, including smartphones and wearables, across proximity and remote use cases. The transaction is counted when a mobile instrument is used to authorize and complete the payment in the UK.
Scope exclusions: We exclude purely cash withdrawals, manual bank transfers not initiated as a mobile payment experience, and non-payment mobile banking actions such as balance checks and statements.
Segmentation Overview
- By Payment Type
- Proximity Payments
- Remote Payments
- By Transaction Type
- Peer-to-Peer (P2P)
- In-store Point-of-Sale (POS)
- Person-to-Merchant (P2M/Checkout)
- Other Transaction Types
- By Application
- Retail & eCommerce
- Transportation and Logistics
- Hospitality & Food-Service
- Government & Public Sector
- Other Applications (Education, Healthcare)
- By End-user
- Personal
- Business
Data Sources, Market Sizing, and Validation
Desk Research
Desk work started by mapping the UK payments landscape and isolating the parts that are clearly mobile-led. We leaned on public, non-paywalled sources such as UK Finance publications on payment behavior, Bank of England releases on payment systems and oversight topics, Office for National Statistics (ONS) indicators for consumer spending and digital adoption, HM Treasury and FCA policy notes impacting payment services, and Payment Systems Regulator (PSR) updates on market outcomes and rules.
Those sources helped us set the demand context, define what should count as a mobile payment, and track broad adoption signals like contactless readiness, e-commerce mix, and device-led wallet usage. We also used company filings, investor presentations, and reputable press coverage to confirm product launches, partnership moves, and pricing direction in the market. Where needed, we referenced paid databases for company financials and intelligence, patent databases, and a news and financials platform to cross-check timelines and key metrics. The desk sources listed here are illustrative only, since many other public and paid references were also used to collect, validate, and clarify data points.
Primary Interviews and Surveys
Primary work focused on validating how transaction types are being monetized and how quickly UK users are shifting between proximity and remote mobile payments. We interviewed a mix of payment ecosystem participants, including solution providers, merchant-side stakeholders, and industry experts, then used follow-up surveys to sanity check adoption levels, average transaction values, and how regulated rails show up in the UK context. Because this is a single-country market, the fieldwork was balanced across the UK user base and major merchant categories rather than split by global regions.
Distribution of primary research fieldwork respondents
| Company type | Respondent position | Region |
|---|---|---|
| Top tier: 36% | CXOs: 12% | |
| Mid tier: 48% | Functional/Unit leaders: 29% | |
| Smaller Players: 16% | Managers: 59% |
Market-Sizing & Forecasting
Market sizing was built using a top-down and bottom-up combination, with the main spine coming from a demand pool view of mobile-initiated payment activity in the United Kingdom. In practical terms, we reconstructed totals by linking overall payment activity to mobile-share indicators, then filtering it through what qualifies as a mobile payment experience.
Key inputs used in the model included wallet and contactless adoption signals, the split of proximity versus remote mobile payments, typical transaction-value ranges by use case, e-commerce and in-store spending mix, and the pace of security and authentication upgrades that remove friction for repeat payments. These variables were selected because each one affects the totals in a visible way, and each can be cross-checked through public statistics and what practitioners report. To corroborate the totals, we built selective bottom-up approximations using sampled average values times estimated transaction volumes for common use cases, then ran channel checks on merchant acceptance and solution rollout timelines. When a bottom-up input had gaps, we used conservative ranges based on interview inputs, and then re-balanced the model so the totals still matched the macro demand signals.
For forecasting, we relied on scenario analysis supported by adoption and value drivers that experts could explain for the UK, such as continued shift away from cash, mobile wallet penetration, merchant acceptance expansion, and policy or infrastructure changes that can speed up account-to-account and card-led mobile experiences. Each scenario was reviewed against recent trend direction so the forecast stays aligned with what the market has been able to deliver.
Data Validation & Update Cycle
Validation was done by triangulating the model output against independent signals, including published payments activity trends, consumer behavior indicators, and consistency checks between proximity and remote shares. Outliers were flagged and reworked, which usually meant re-checking a mobile-share assumption, an average value input, or a timing factor tied to policy and infrastructure changes.
Before sign-off, the model goes through a multi-step analyst review where assumptions are re-tested and key calculations are replicated to reduce spreadsheet error risk. If new information materially shifts adoption, pricing, or regulation, we re-contact sources and refresh the inputs so the logic stays consistent with the updated evidence. Reports are refreshed annually, with interim updates added when large market events occur, and a final pre-delivery pass completed so clients receive the latest updated view.
Mordor Intelligence's United Kingdom Mobile Payments Market Size Compared With Other Published Estimates
Published numbers for UK mobile payments often do not match because each publisher uses a different payment boundary, then applies different assumptions for growth drivers such as wallet uptake and average transaction value. Even when the same years are shown, currency timing and what is treated as mobile-initiated can shift the final figure up or down.
The table shows a spread around the 2026 value, and in Mordor Intelligence's model the market is counted as mobile-initiated payments in the United Kingdom across proximity and remote use cases, rather than folding in the full digital payments universe or adjacent processing revenues. Differences also come from whether estimates emphasize conservative or aggressive adoption paths, whether transaction types like P2P and in-store checkout are both included, and how quickly average values are assumed to rise as more high-ticket categories shift onto mobile.
Benchmark comparison
| Source | Market Size | Gaps in Research Methodology |
|---|---|---|
| Mordor Intelligence | USD 2.68 B (2026) | |
| Trade Journal A | USD 2.65 B (2024) | Uses a different base year and typically summarizes mobile payment value without clearly separating proximity versus remote flows, which makes it harder to align the counted demand pool to UK mobile-initiated transactions. |
| Industry Tracker B | USD 1.58 B (2023) | Starts from an earlier year with limited visibility on the post-2020 acceleration in wallet usage and contactless behavior, and the scope description is lighter on transaction-type coverage, which can undercount broader mobile checkout activity. |
Overall, the gap is best explained by year alignment and what is counted as a mobile payment versus a wider digital payments bucket. By keeping the model tied to observable adoption signals and clearly defined transaction types, our estimate stays traceable to repeatable steps that can be rechecked when assumptions change.


Key Questions Answered in the Report
What is the current size of the United Kingdom mobile payments market?
The market stands at USD 2.68 billion in 2026 and is projected to reach USD 8.49 billion by 2031.
Which segment holds the largest share of the United Kingdom mobile payments market?
Proximity payments dominate with 67.32% value share thanks to widespread tap-to-pay acceptance.
Why are variable recurring payments (VRPs) significant for UK mobile payments?
VRPs allow merchants to pull funds directly from bank accounts, bypassing card fees and giving users fine-grained control over authorisations.
How is APP fraud affecting mobile payment adoption?
APP fraud caused GBP 450.7 million in losses in 2024, prompting tighter reimbursement rules that improve consumer confidence but raise compliance costs for PSPs.
Which geography shows the fastest growth in mobile payments within the UK?
Piloted Pay As You Go transit schemes in Manchester and Birmingham indicate those regions will see the sharpest uptake, although London remains the overall leader.
How are interchange-fee caps influencing provider strategy?
Fee caps compress margins, so PSPs are investing in account-to-account rails and value-added analytics to diversify revenue away from regulated card interchange.
Page last updated on:






